
0 ITEMS

Multiple Property REFM Financial Model Excel Template
This Real Estate Investment Financial Model helps users turn a property acquisition, renovation, development, or resale strategy into a structured five-year financial forecast. Instead of starting from a blank spreadsheet, entrepreneurs, investors, developers, consultants, and analysts can work from a ready-to-use model designed around the financial realities of real estate investment. The template helps estimate revenue assumptions, project timelines, acquisition costs, construction budgets, operating expenses, payroll, cash flow needs, profitability, investor returns, and long-term funding requirements in one connected planning tool. Built for business planning, lender discussions, investor presentations, and internal decision-making, the model gives users a clear way to understand whether a real estate project or property investment company can support its cost structure and reach sustainable profitability. It is especially useful for fix-and-flip projects, renovated single-family homes, upgraded multi-family properties, and ground-up development strategies where large cash outflows occur before property sales generate revenue. Users can update assumptions for purchase prices, renovation costs, sale timing, financing terms, staffing, overhead, and market conditions to see how each change affects the overall forecast. The template includes integrated financial statements, cash flow forecasting, profitability analysis, scenario planning, visual charts, performance metrics, and lender-friendly outputs. It helps users evaluate when capital may be required, how long payback may take, when break-even may occur, and which assumptions have the greatest impact on returns. By connecting revenue, costs, funding, and timing, the model supports more confident planning before committing capital to acquisitions or development activity. Designed to be editable and practical, the Real Estate Investment Financial Model works for founders preparing a business plan, property investors raising capital, consultants building client projections, and business owners assessing expansion opportunities. The model can be customized in Microsoft Excel or Google Sheets, allowing users to replace sample assumptions with their own numbers, review professional outputs, and present a more credible financial plan to lenders, partners, stakeholders, or investors.
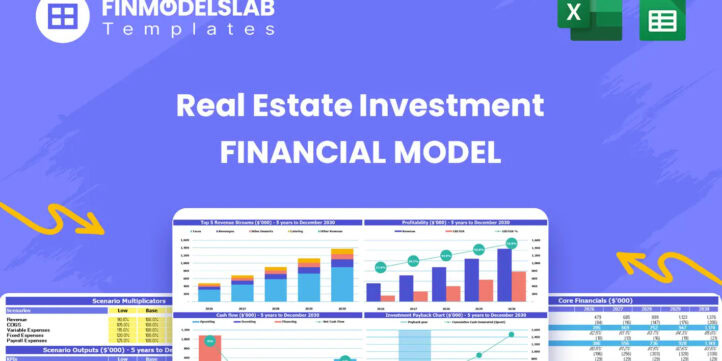


Financial Model Overview
The Real Estate Investment Financial Model is a ready-to-use financial model template designed to help investors, developers, founders, consultants, analysts, and business owners evaluate the economics of a real estate investment strategy before committing capital. It is built for property acquisition, renovation, development, and resale models where revenue is generated through the sale of improved, renovated, or newly developed properties. The template brings together core assumptions, project timing, revenue forecasts, startup costs, operating expenses, payroll, cash flow, profitability, investor returns, and financial statements in one structured workbook. Because real estate investment often requires significant cash outflows long before sales proceeds are received, this model helps users identify funding needs, liquidity gaps, break-even timing, and return potential in advance. It is useful for business planning, lender discussions, investor presentations, internal budgeting, and strategic decision-making, giving users a professional framework that can be customized for individual projects, portfolios, or real estate investment companies.
All-in-One Dashboard
The all-in-one dashboard gives users a centralized view of the most important inputs and outputs in the Real Estate Investment Financial Model. Instead of moving through disconnected sheets to understand the business, users can review core assumptions and key results in one place, including revenue expectations, major cost categories, cash flow movement, profitability, financing needs, and investor return metrics. This section is useful because it acts as the control center for the model, helping users quickly see how changes in acquisition timing, renovation budgets, sale prices, overhead, and financing assumptions affect the overall forecast. For a real estate investment business, a dashboard is especially valuable because deal performance depends on multiple moving parts, including property purchase price, construction timeline, holding period, resale value, interest cost, and operating overhead. By summarizing the model’s most important outputs, the dashboard helps users prepare for lender conversations, investor updates, partner meetings, and internal decision reviews without having to rebuild summary reports manually.
Low Base High Scenario Analysis
The Low Base High scenario analysis section helps users evaluate how the investment plan may perform under different market and execution conditions. In the base case, users can model the most likely version of the project or portfolio, while the low case may reflect downside assumptions such as lower exit prices, longer construction timelines, higher renovation costs, slower absorption, or tighter financing conditions. The high case can be used to test upside potential if sale prices improve, project delivery accelerates, construction costs come in under budget, or deal volume increases. This component is important for real estate investment planning because small changes in exit value, cost overruns, and timing can have a major impact on cash flow, break-even timing, IRR, ROE, and overall profitability. Scenario analysis helps users avoid relying on a single forecast and instead understand the range of possible outcomes. It supports better risk management, more realistic investor expectations, and stronger funding discussions by showing how resilient the business model may be if market conditions change.
Professional Charts
The professional charts section translates the financial model’s key outputs into visual reports that are easier to interpret and present. Real estate investment forecasts can involve complex relationships between acquisition costs, construction spending, operating expenses, financing, property sales, cash balances, and profitability over time. Charts help simplify those relationships by showing trends such as revenue growth, cost movement, EBITDA development, cash flow timing, cumulative profit, capital requirements, and return metrics across the forecast period. This is useful for founders and analysts who need to communicate financial results clearly to partners, lenders, investors, or internal teams. Instead of relying only on rows of numbers, users can use the visual outputs to explain when the business is expected to generate sales proceeds, where cash pressure may occur, how profitability develops after projects are sold, and how investor returns may change over time. Presentation-ready charts make the model more practical for pitch decks, business plans, investment memos, board updates, and financing packages.
ROE Components and DuPont Analysis
The ROE components section uses a DuPont-style analysis to help users understand what is driving return on equity rather than only viewing the final return figure. In real estate investment, ROE can be influenced by profitability, asset efficiency, leverage, project margins, debt structure, equity contribution, sale timing, and cost control. This component helps break down return performance into underlying drivers so users can evaluate whether returns are being created through strong project economics, efficient use of capital, financing leverage, or a combination of factors. Inputs may include net income, equity balances, total assets, financing assumptions, property values, and operating performance. Outputs may include return on equity, margin indicators, leverage relationships, and related performance measures. This is useful for decision-making because it helps users identify where improvements are needed. If returns are weak, the model may show whether the issue comes from high construction costs, low sale margins, excessive overhead, slow capital turnover, or inefficient financing. For investor presentations, this section adds depth by showing the financial logic behind the return profile.
Revenue Inputs
The revenue inputs section allows users to define the assumptions that drive property sale revenue throughout the forecast. For a real estate investment model, revenue does not typically come from simple monthly sales volume; it is often tied to specific properties, acquisition dates, renovation or development periods, completion timing, sale dates, expected exit values, and disposition strategies. This section may include assumptions for renovated single-family homes, upgraded multi-family assets, newly constructed properties, or other real estate assets that are acquired, improved, and sold. Users can enter purchase dates, projected sale timing, expected sale prices, renovation completion assumptions, and other drivers that determine when revenue appears in the financial statements. The value of this section is that it connects deal-level planning to the broader five-year forecast. By updating revenue assumptions, users can test whether the projected sales pipeline is sufficient to cover acquisition costs, construction spending, payroll, overhead, financing costs, and investor expectations. It also helps make revenue forecasts more transparent and defensible for lenders and stakeholders.
Bank-Ready Reports
The bank-ready reports section provides structured financial outputs designed to support lender review, financing discussions, and professional stakeholder communication. Real estate investment businesses often need to show more than a simple profit estimate; lenders usually want to understand the full financial picture, including profit and loss projections, cash flow forecasts, balance sheet movement, funding needs, operating expenses, and the timing of capital inflows and outflows. This component organizes the model’s results into clear reports that can be shared as part of a loan request, refinancing discussion, investor package, or business plan. Inputs from the assumptions, revenue, cost, payroll, and financing areas flow into these reports automatically, helping users avoid manual report-building errors. The reports are useful because they show whether the project or business can remain liquid, repay obligations, absorb cost overruns, and generate enough proceeds from property sales to support the planned strategy. For entrepreneurs and developers preparing funding documents, this section helps present the financial plan in a format that looks organized, credible, and easier to review.
Revenue Breakdown
The revenue breakdown section gives users a more detailed view of how projected income is generated across different properties, deal types, or revenue streams. In a real estate investment business, total revenue may come from multiple asset categories, such as renovated single-family homes, upgraded multi-family buildings, new development projects, or other property dispositions. This section helps separate those streams so users can see which projects contribute most to total revenue, when each sale is expected to occur, and how the timing of individual dispositions affects the overall forecast. Inputs may include deal names, asset types, projected sale values, expected closing dates, unit counts, renovation status, and development milestones. Outputs may include monthly and annual revenue by property, category, or project phase. This is useful for planning because it prevents the forecast from becoming a single high-level number with no supporting detail. Investors and lenders can better understand the project pipeline, while management can identify whether revenue is too concentrated in a few transactions or too dependent on delayed closings.
KPI Dashboard and Benchmark Metrics
The KPI dashboard and benchmark metrics section helps users monitor the financial performance of the real estate investment plan through clear key performance indicators. Common metrics may include IRR, ROE, equity multiple, payback period, EBITDA, gross margin, cash balance, break-even timing, project profitability, and capital requirement indicators. The section may also help users compare their assumptions and outputs against practical industry benchmarks, such as construction cost expectations, development timelines, selling cost percentages, overhead levels, and return targets. This is useful because real estate investment decisions rely heavily on measurable performance, not just narrative assumptions. A KPI dashboard helps users quickly identify whether the model is producing realistic results and whether the business plan is strong enough for investor or lender review. If metrics are below target, users can adjust acquisition pricing, renovation budgets, sale assumptions, financing terms, or operating expenses to test improvement strategies. By presenting KPIs in a clear format, this section supports ongoing monitoring, professional reporting, and faster decision-making.
Break-Even Analysis
The break-even analysis section helps users identify when cumulative revenue is expected to cover cumulative costs and the real estate investment business begins to move into a more financially stable position. This is especially important for property development and fix-and-flip strategies because the business may incur significant costs for acquisitions, construction, staffing, professional fees, office setup, marketing, interest, and overhead before any property sale is completed. Inputs may include acquisition costs, construction budgets, operating expenses, payroll, financing costs, expected sale prices, and the timing of project dispositions. Outputs may include the break-even month, cumulative revenue, cumulative costs, and the amount of time required to recover the initial investment. This component is useful for planning because it shows how long the business may need funding support before it becomes self-sustaining. It also helps users evaluate whether the projected timeline is acceptable for investors, whether additional working capital is required, and whether faster-turnover projects should be added to improve liquidity. For funding documents, break-even analysis gives stakeholders a clear milestone for financial viability.
Startup Costs and Funding Requirements
The startup costs and funding requirements section helps users estimate the capital needed before the real estate investment business can operate effectively and before deal-level financing begins to support acquisitions and development activity. This section may include office setup, technology, legal formation, licensing, professional services, initial marketing, due diligence tools, deal flow systems, insurance, working capital reserves, and other pre-launch or early-stage costs. It can also be used to separate corporate startup capital from larger property acquisition and construction funding needs. Outputs may include total startup investment, monthly funding gaps, capital required by period, and the amount of equity, debt, or investor funding needed to support the plan. This is useful because real estate businesses can underestimate the cash required to operate while projects are still in progress and before sales proceeds arrive. By clearly organizing startup and funding assumptions, the template helps users prepare a more realistic budget, support lender or investor conversations, and avoid liquidity surprises. It also gives founders and operators a practical basis for deciding how much capital to raise, when to raise it, and how to allocate it across setup, overhead, and project activity.
File types:
Excel – Single-User: .xlsx
Excel – Multi-User: .xlsx
Similar ProductsOther customers were also interested in...


 HenrySheykin
Apartments Acquisition REFM Financial Model Excel ...
The Real Estate Acquisition Financial Model Financial Model Template helps investors, developers, an... Read more
Multi Family Acquisition REFM Financial Model Exce...
The Real Estate Acquisition Financial Model Financial Model Template helps investors, developers, an... Read more
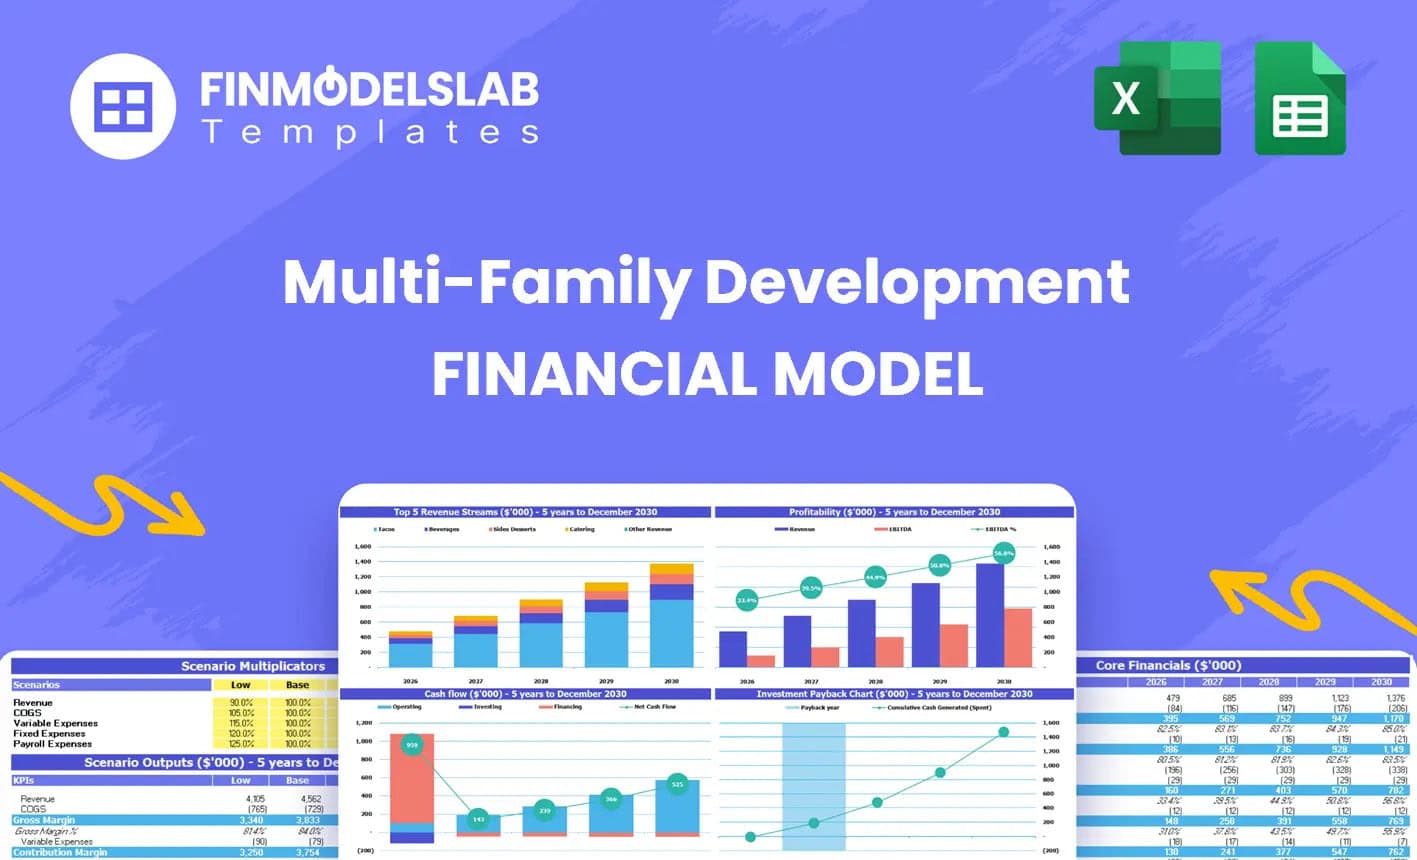
Multi Family Development REIT Financial Model Exce...
The Multi-Family Development Financial Model helps developers, real estate entrepreneurs, consultant... Read more
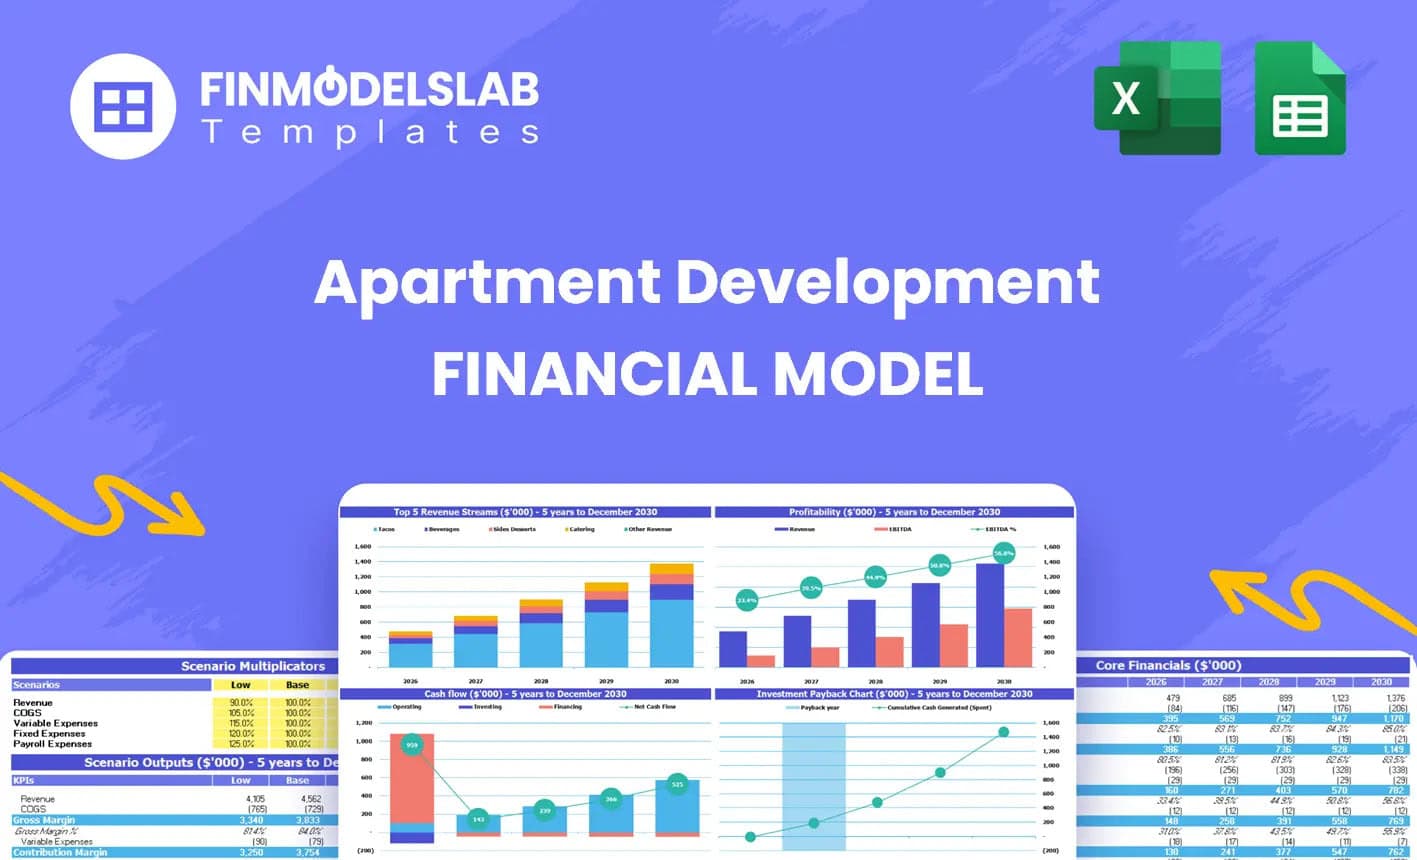
Apartments Development REFM Financial Model Excel ...
The Apartment Development Financial Model Template helps real estate developers, entrepreneurs, busi... Read more
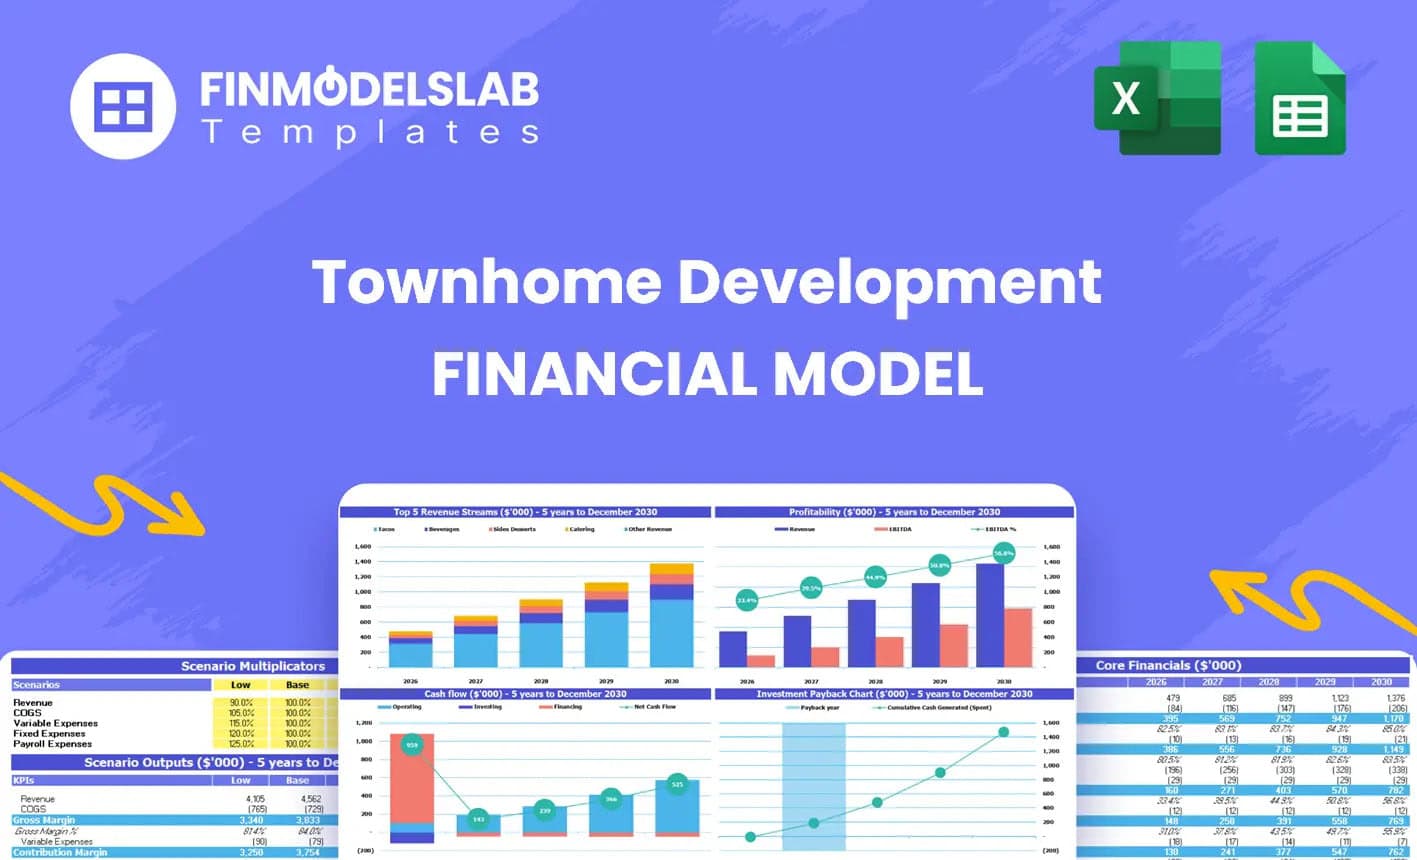
Townhomes Development Real Estate Financial Model ...
The Townhome Development Financial Model Template helps developers, founders, consultants, analysts,... Read more
Condominium Development REFM Financial Model Excel...
The Condo Development Financial Model helps developers, investors, analysts, consultants, and busine... Read more
Real Estate Agency Financial Model Excel Template
The Real Estate Brokerage Financial Model Financial Model Template helps users build a structured fo... Read more
Residential Development REIT Financial Model Excel...
The Residential Development Financial Model helps users evaluate the financial feasibility of a resi... Read more
Single Family Development REFM Financial Model Exc...
The Residential Development Financial Model helps users evaluate the financial feasibility of a resi... Read more
Vacation Rentals Hotel Financial Model Excel Templ...
The Vacation Rental Financial Model helps users turn a short-term rental concept, property managemen... Read more
You must log in to submit a review.