
0 ITEMS

Shrimp Farm Financial Model Excel Template
The Shrimp Farming Financial Model helps entrepreneurs, aquaculture operators, consultants, analysts, and business planners turn a shrimp farming concept into a structured financial forecast. Instead of relying on disconnected estimates for hatchery output, grow-out cycles, product pricing, feed costs, energy usage, payroll, and capital investment, this template brings the key financial assumptions into one organized model. It is designed to help users evaluate whether a shrimp farm can generate enough revenue, manage its cost structure, and support the startup funding required for commercial aquaculture operations. This financial model template is especially useful for founders preparing business plans, investor presentations, lender discussions, internal budgets, or expansion proposals. Shrimp farming can be capital intensive, and small changes in survival rates, harvest weight, feed cost percentages, product mix, or selling prices can materially affect cash flow and profitability. The model gives users a practical way to test these assumptions, compare scenarios, estimate startup costs, review operating expenses, plan payroll, and understand the financial impact of production decisions before committing significant capital. The template supports five-year financial planning with editable assumptions, automated calculations, and outputs designed for decision-making. Users can model revenue assumptions across shrimp product categories, estimate cost of goods sold, forecast overhead and staffing needs, and review projected profit and loss, cash flow, and funding requirements. It also helps clarify when the business may reach break-even, how margins may improve as production scales, and which operational drivers have the greatest effect on profitability. Built for both non-financial users and experienced planners, the Shrimp Farming Financial Model provides a ready-to-use structure that can be customized for different farm sizes, production systems, pricing strategies, and growth plans. Whether you are launching a new shrimp aquaculture venture, expanding an existing facility, preparing a funding package, or advising a client, the model helps replace guesswork with a clear financial framework. It gives stakeholders a more complete view of startup investment, ongoing expenses, cash flow timing, profitability potential, and the financial decisions needed to build a sustainable shrimp farming operation.
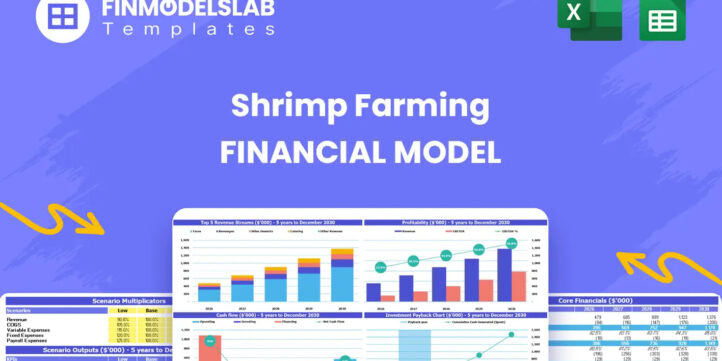


Financial Model Overview
The Shrimp Farming Financial Model is a ready-to-use financial model template built for planning, evaluating, and presenting the economics of a shrimp aquaculture business. Shrimp farming requires careful coordination between biological production assumptions and financial outcomes, because revenue depends on hatchery performance, grow-out survival, harvest weight, product mix, pricing, and sales timing, while costs are driven by feed, energy, labor, facility overhead, capital equipment, and working capital needs. This model helps users connect those operating drivers to projected revenue, expenses, cash flow, profitability, and funding requirements. It is useful for entrepreneurs launching a shrimp farm, existing operators planning expansion, consultants building client forecasts, analysts preparing business cases, and founders creating investor or lender materials. Instead of building a complex spreadsheet from scratch, users can work from an editable structure designed around shrimp farming economics, update assumptions for their own facility, and generate a clearer view of how the business may perform over time.
All-in-One Dashboard
The all-in-one dashboard gives users a centralized view of the most important inputs and outputs in the Shrimp Farming Financial Model. This section is designed to bring together core assumptions such as production volumes, pricing, cost drivers, capital investment, payroll, operating expenses, and financing assumptions, then translate those inputs into key outputs such as revenue, gross margin, EBITDA, net profit, cash position, and funding needs. For a shrimp farming business, this is especially useful because operational assumptions are highly interconnected. A change in mortality rate, harvest weight, feed cost, or product pricing can affect revenue, cost of goods sold, cash flow, and profitability at the same time. The dashboard helps users review the business quickly without moving through every calculation tab, making it easier to spot weak points, validate assumptions, and prepare for stakeholder conversations. It also supports faster decision-making by showing whether the model is pointing toward a viable operation, a funding gap, or a need to adjust production or pricing strategy.
Low, Base, and High Scenario Analysis
The low, base, and high scenario analysis section helps users test how the shrimp farm may perform under different operating and market conditions. Rather than relying on a single forecast, the model allows users to compare conservative, expected, and optimistic cases using different assumptions for production output, survival rates, average harvest weight, product pricing, feed costs, energy costs, operating expenses, and growth timing. This is important for shrimp aquaculture because outcomes can vary significantly based on biological performance, market demand, input cost inflation, and facility efficiency. A low case can show what happens if mortality is higher, pricing is weaker, or costs increase, while a high case can show the upside if production stabilizes quickly and premium products sell at stronger margins. The base case provides a practical middle view for planning. This component is valuable for investors, lenders, and internal teams because it demonstrates that the user has considered risk, uncertainty, and operational variability. It also helps management decide how much cash reserve may be required and which assumptions must be monitored most closely.
Professional Charts
The professional charts section converts the model’s financial outputs into clear visual reports that can be used for presentations, business plans, and internal reviews. Instead of presenting only rows of spreadsheet data, this component helps users illustrate trends in revenue, expenses, EBITDA, net income, cash flow, margins, capital requirements, and growth over time. For a shrimp farming operation, visual reporting is useful because many stakeholders need to understand how production scaling translates into financial performance. Charts can show whether revenue increases steadily as harvest volumes grow, whether operating costs remain under control, when cash flow turns positive, and how profitability changes as the farm reaches a more efficient operating scale. These visuals are especially helpful in investor or lender discussions, where decision-makers may want a concise explanation of the farm’s financial trajectory. By presenting the forecast in a more polished and understandable format, the model helps users communicate the business opportunity, the capital plan, and the expected financial outcomes with greater confidence.
ROE Components and DuPont Analysis
The ROE components section uses a DuPont-style framework to help users understand what is driving return on equity in the shrimp farming business. Instead of looking only at a single return percentage, this component breaks performance into underlying drivers such as profitability, asset efficiency, and leverage. For a capital-intensive business like shrimp farming, this level of analysis is important because a farm may require substantial investment in land, construction, tanks, recirculating aquaculture systems, hatchery infrastructure, equipment, and working capital before it produces meaningful returns. The model can help users evaluate whether returns are being generated by strong operating margins, efficient use of assets, or financing structure. It also highlights where improvement may be needed, such as increasing harvest yield, improving product margins, reducing costs, or generating more revenue from the same asset base. This component is useful for investors and owners because it provides a more detailed view of financial performance than profit alone. It supports better capital allocation decisions and helps users assess whether the projected return justifies the level of investment and risk.
Revenue Inputs
The revenue inputs section is where users define the assumptions that drive sales in the Shrimp Farming Financial Model. This may include hatchery output, breeding stock, production cycles, juvenile retention, purchased juveniles, stocking levels, mortality rates, survival rates, average harvest weight, harvest timing, saleable volume, product categories, and selling prices. Because shrimp farm revenue is directly tied to biological and operational performance, this section is one of the most important parts of the model. Users can adjust assumptions to reflect their own farm design, production system, regional pricing, customer mix, and expected operating efficiency. The model then uses these assumptions to calculate projected sales over the forecast period. This is useful for financial planning because it links revenue to realistic production capacity rather than arbitrary sales targets. It also helps users understand which assumptions have the greatest impact on income, such as improving survival rates, increasing average harvest weight, shifting more volume to higher-value products, or selling surplus juveniles as a secondary revenue stream.
Bank-Ready Reports
The bank-ready reports section organizes the financial forecast into outputs that are suitable for lenders, investors, partners, and other stakeholders. These reports may include projected profit and loss statements, cash flow forecasts, balance sheet summaries, assumption summaries, debt service views, profitability metrics, and funding requirement outputs. For shrimp farming, this is particularly valuable because lenders and investors often need to see how the business will use capital, how quickly operations can scale, whether cash flow can support expenses and debt obligations, and when the farm is expected to become profitable. A professionally structured report package helps users present the model in a format that is easier for financial decision-makers to review. It also reduces the risk of leaving out critical information, such as startup costs, operating burn, capital expenditures, working capital needs, and repayment capacity. This component supports funding preparation by turning detailed calculations into a more organized financial story that explains how the shrimp farm plans to move from investment to production, revenue generation, and sustainable profitability.
Revenue Breakdown
The revenue breakdown section gives users a detailed view of revenue by product stream, category, and pricing assumption. A shrimp farm may sell whole fresh shrimp, head-off fresh shrimp, frozen shrimp, peeled products, value-added products, juveniles, or other related outputs depending on its strategy and market access. This component helps users allocate total harvest volume across different product types, assign selling prices, and evaluate how each revenue stream contributes to total sales. It is useful because product mix can have a major impact on profitability. Selling a larger share of harvest into premium categories may improve revenue per kilogram, while a broader mix may help the farm reach restaurants, retailers, wholesalers, and direct buyers. The revenue breakdown also helps users test whether the business is too dependent on a single product type or customer segment. By showing revenue at a more granular level, the model supports pricing decisions, sales planning, market positioning, and production strategy. It also gives investors and lenders a clearer explanation of how projected sales are built from actual shrimp output rather than broad assumptions.
KPI Dashboard
The KPI dashboard helps users monitor the financial and operating indicators that matter most for shrimp farming performance. This section may track metrics such as revenue growth, gross margin, EBITDA margin, net profit margin, cash balance, operating cash flow, harvest volume, revenue per kilogram, cost of goods sold as a percentage of revenue, payroll as a percentage of revenue, break-even timing, payback period, return on equity, and other key indicators. It can also support comparison against internal targets or industry benchmarks where appropriate. For a shrimp farming business, KPI tracking is important because profitability depends on both production efficiency and financial discipline. The dashboard helps users identify whether the farm is improving over time, whether cost percentages are moving in the right direction, and whether the business is generating enough cash to support operations and growth. This component is useful for monthly reviews, investor updates, board discussions, and management decision-making. It helps turn the model from a one-time planning document into a practical performance management tool.
Startup Costs and Capital Investment Planning
The startup costs and capital investment planning section helps users estimate the upfront funding required to launch or expand a shrimp farming operation. This component may include facility construction, land preparation, tanks, recirculating aquaculture systems, filtration equipment, hatchery equipment, water treatment systems, pumps, backup power, laboratory equipment, refrigeration, vehicles, permits, licenses, professional fees, initial marketing, insurance deposits, and opening working capital. Shrimp farming can require substantial capital before the first harvest is sold, so it is essential to understand the full startup investment rather than focusing only on obvious equipment purchases. This section helps users separate one-time capital expenditures from ongoing operating expenses, estimate the timing of cash outflows, and determine how much equity, debt, or other funding may be needed. It is useful for business planning because it shows whether the project is adequately capitalized from the beginning. It also helps investors and lenders understand how funds will be deployed and whether the proposed capital plan is realistic for the scale of the farm.
Break-Even and Profitability Analysis
The break-even and profitability analysis section helps users understand when the shrimp farm may move from losses to sustainable profit. This component can estimate break-even timing, required revenue, required harvest volume, contribution margin, gross margin, EBITDA, net profit, and the relationship between fixed costs, variable costs, and sales volume. For shrimp farming, break-even analysis is especially useful because the business often has significant fixed costs, including facility lease or ownership costs, technical staff, biologists, managers, insurance, permits, utilities, and equipment-related expenses. At the same time, variable production costs such as feed and energy rise with output. The model helps users see how much shrimp must be produced and sold to cover the cost base, and how changes in pricing, survival rates, harvest weight, product mix, or feed efficiency can shift the break-even point. This section supports decision-making by showing whether the farm’s planned capacity is sufficient, whether pricing needs to be adjusted, and whether the business can reach profitability within an acceptable timeframe.
File types:
Excel – Single-User: .xlsx
Excel – Multi-User: .xlsx
Similar ProductsOther customers were also interested in...



 eFinancialModels
Agriculture Financial Model Templates Bundle
This is a collection of financial model templates for businesses in the Agriculture Industry and its... Read more
 HenrySheykin
Cannabis Financial Model Excel Template
The Cannabis Business Financial Model is a ready-to-use financial model template designed to help en... Read more
Poultry Farm Financial Model Excel Template
The Poultry Farming Financial Model helps users turn a poultry farm concept into a structured, lende... Read more
Fruits Farming Financial Model Excel Template
The Fruit Farming Financial Model helps users turn a fruit farm concept, orchard expansion, or agric... Read more
Greenhouse Farming Financial Model Excel Template
The Greenhouse Farming Financial Model helps users evaluate the economics of a controlled environmen... Read more
Fish Farm Financial Model Excel Template
The Fish Farming Financial Model template helps entrepreneurs, aquaculture founders, business owners... Read more
Marijuana Financial Model Excel Template
The Cannabis Business Financial Model is a ready-to-use financial model template designed to help en... Read more
Soy Production Financial Model Excel Template
The Soy Production Financial Model helps users turn a soybean farming and processing plan into a str... Read more
Vegetable Farming Financial Model Excel Template
The Vegetable Farming Financial Model helps users turn a farming concept, expansion plan, or funding... Read more
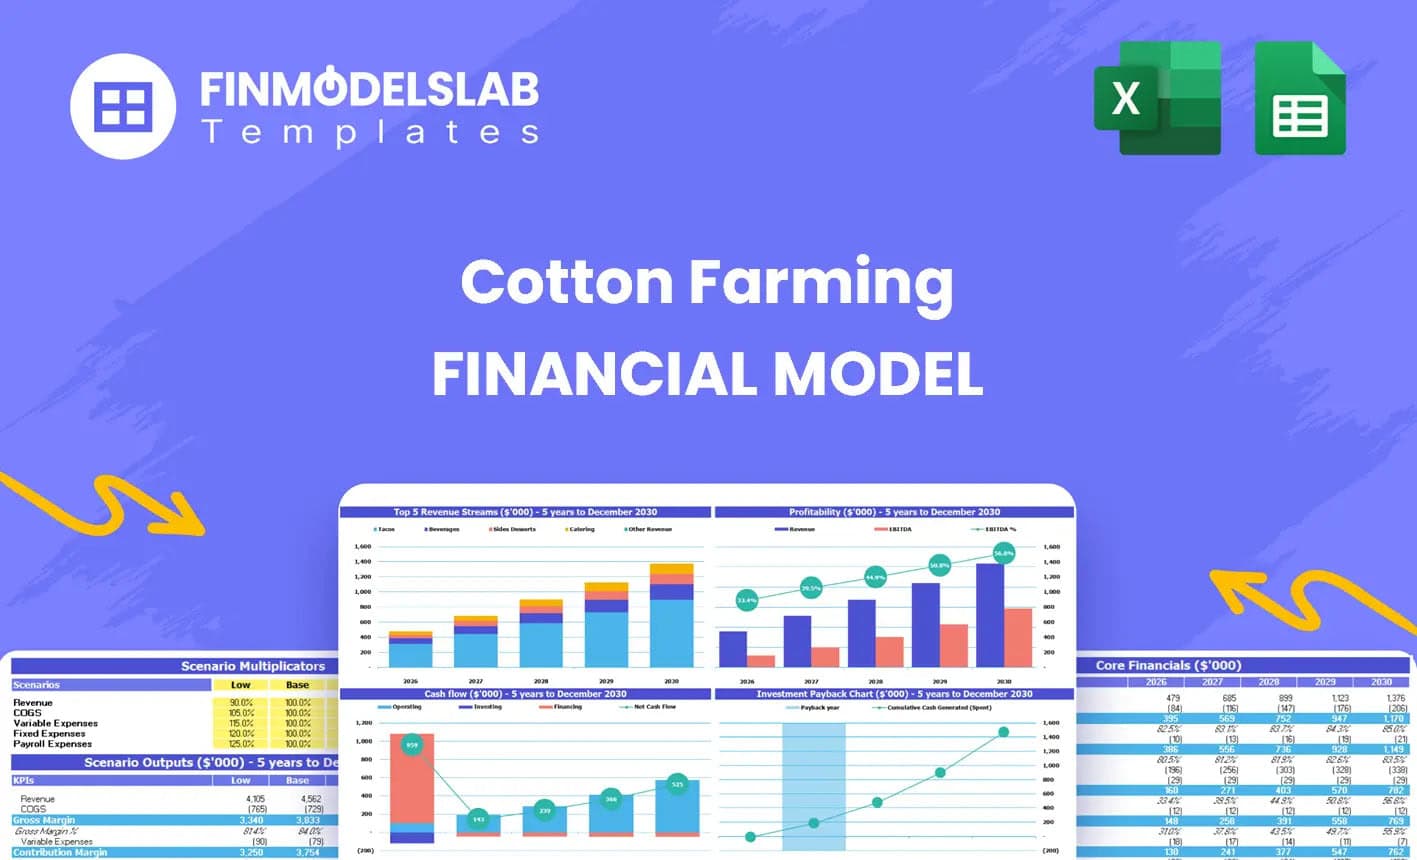
Cotton Growing Financial Model Excel Template
The Cotton Farming Financial Model Financial Model Template helps entrepreneurs, farm owners, consul... Read more
You must log in to submit a review.