
0 ITEMS

Public Relations Agency Financial Model Excel Template
The Public Relations Agency Financial Model helps entrepreneurs, agency founders, consultants, analysts, and business owners turn a PR agency idea into a structured financial forecast. Instead of starting with a blank spreadsheet, users can work from a ready-to-use model designed around the economics of a professional services agency, including client retainers, service-based revenue, operating costs, payroll, startup costs, cash flow, profitability, and long-term financial planning. It is built to support business plans, funding documents, internal budgeting, client pitch preparation, and strategic decision-making. This template is especially useful for anyone launching, expanding, or evaluating a public relations firm that earns revenue from services such as media relations, crisis communications, digital PR, content support, and ongoing monthly retainers. Users can adjust the core revenue assumptions, pricing, client acquisition inputs, service mix, and growth expectations to reflect their own strategy. The model then connects those assumptions to projected financial results, helping users understand how changes in pricing, customer acquisition, staffing, and operating expenses affect the agency’s performance over time. The Public Relations Agency Financial Model includes integrated financial statements, cash flow forecasting, scenario planning, revenue analysis, KPI tracking, and investor-ready outputs. It helps users estimate funding needs, plan monthly and annual budgets, review profitability, evaluate the timing of break-even, and assess whether the agency has enough liquidity to support payroll, rent, software, contractor costs, and marketing activity. By organizing the most important assumptions in one place, it gives users a clearer view of what it may take to build a sustainable and scalable PR business. Designed for practical use in Excel and Google Sheets, the template is fully editable and suitable for both non-financial users and experienced finance professionals. Founders can use it to prepare investor discussions, consultants can adapt it for client work, and agency owners can use it to test hiring plans, service pricing, revenue growth, and cost controls. With pre-built formulas, professional formatting, and a structured layout, this financial model template saves time while giving users a more disciplined way to plan, analyze, and present the financial future of a public relations agency.
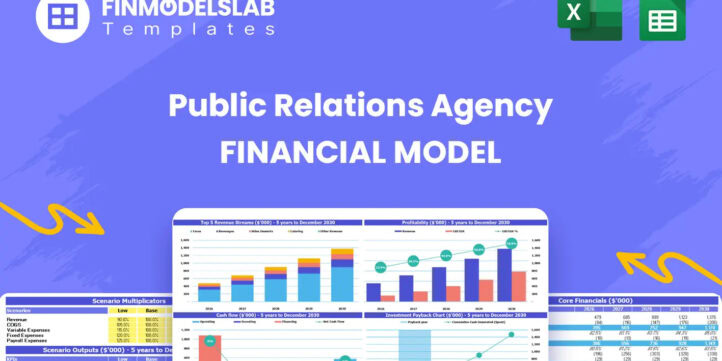


Financial Model Overview
The Public Relations Agency Financial Model is a ready-to-use financial model template designed to help founders, agency owners, consultants, and analysts plan the financial future of a PR business with more structure and confidence. Public relations agencies often rely on a mix of monthly retainers, project-based work, crisis support, media relations, digital PR, content services, and strategic communications packages, so a generic spreadsheet can miss the specific revenue and cost drivers that matter most. This model brings the core financial planning elements into one organized workbook, helping users forecast revenue, estimate startup investment, plan payroll, manage operating expenses, review cash flow, and evaluate profitability over a multi-year period. It is useful for business plans, funding applications, investor discussions, internal budgeting, strategic planning, and decision-making before launching or scaling a public relations firm.
All-in-One Dashboard
The all-in-one dashboard gives users a central place to review the most important inputs and outputs of the Public Relations Agency Financial Model without having to search through multiple tabs. It is designed to summarize core assumptions, projected revenue, profitability, cash position, margins, and other high-level indicators in a clear and practical format. Users can update assumptions such as service pricing, client acquisition, monthly retainers, operating expenses, staffing, and growth expectations, then use the dashboard to see how those changes flow through the financial forecast. For a PR agency, this is especially useful because decisions about new client acquisition, retainer pricing, freelance support, media monitoring tools, and payroll can quickly affect cash flow and margins. The dashboard helps founders, managers, and stakeholders understand the overall financial picture at a glance, making it easier to review performance, compare plan versions, prepare for meetings, and communicate financial expectations in a concise way.
Low, Base, and High Scenario Analysis
The low, base, and high scenario analysis component helps users test how the agency may perform under different business conditions. A public relations agency can experience uncertainty around client wins, retainer levels, renewal rates, campaign demand, staffing needs, and marketing efficiency, so relying on a single forecast can create a false sense of certainty. This section allows users to model conservative, expected, and optimistic outcomes by changing key drivers such as client acquisition rates, monthly fees, customer acquisition cost, service mix, payroll timing, contractor usage, and overhead. The outputs show how these assumptions affect revenue, gross margin, EBITDA, net income, cash flow, and funding needs. This is valuable for planning because it helps users understand risk before making major commitments. It can also support investor and lender conversations by showing that the business has been stress-tested and that management understands how to respond if growth is slower, costs are higher, or demand exceeds expectations.
Professional Charts
The professional charts component turns financial outputs into visual reports that are easier to understand and present. Instead of reviewing only rows of numbers, users can analyze key trends in revenue, expenses, profit, cash flow, margins, and growth over time through pre-built charts and graphs. For a public relations agency, these visuals can help explain how monthly retainers build recurring revenue, how operating leverage improves profitability as the client base grows, and how payroll or contractor costs affect margins. The charts may be used in investor presentations, bank discussions, internal planning meetings, or strategy reviews with partners and advisors. They are especially useful when communicating financial plans to stakeholders who need a clear view of the agency’s trajectory but may not want to study the detailed spreadsheet. By making the forecast more presentation-ready, this component helps users turn financial data into a more persuasive story about market opportunity, operating discipline, and growth potential.
ROE Components and DuPont Analysis
The ROE components and DuPont analysis section helps users evaluate how efficiently the public relations agency uses capital to generate returns. Return on equity is an important metric for investors and business owners because it shows how much profit is being produced relative to shareholder investment. The DuPont approach breaks this return into underlying drivers, such as profitability, asset efficiency, and financial leverage, so users can better understand why returns are improving or weakening. In a PR agency model, this can reveal whether performance is being driven by strong margins, efficient use of working capital, lean fixed assets, or a financing structure that supports growth. Users may input assumptions related to equity funding, retained earnings, debt, assets, net income, and balance sheet activity, while the model helps calculate the resulting return profile. This component is useful for funding preparation, investor analysis, and strategic decision-making because it goes beyond simple profit figures and shows how effectively the agency converts capital into financial results.
Revenue Inputs
The revenue inputs section is where users define the assumptions that drive the agency’s sales forecast. For a public relations agency, revenue often depends on the number of active clients, the monthly retainer charged for each service, the mix of services sold, the pace of new client acquisition, customer acquisition cost, churn or retention assumptions, and annual pricing changes. This component allows users to model core offerings such as strategic media relations, crisis communications, digital PR, content support, and related communications services. Inputs may include monthly fees, starting client counts, acquisition volumes, marketing spend, conversion assumptions, and growth rates. The model then uses these assumptions to calculate projected revenue over time. This is useful because it connects the agency’s commercial strategy directly to its financial forecast. Users can test whether pricing is high enough to support payroll, whether marketing spend produces enough new clients, and whether the projected service mix creates a healthy path toward sustainable profitability.
Bank-Ready Reports
The bank-ready reports component organizes the model’s outputs into a format suitable for lenders, financial institutions, advisors, and other stakeholders who need to review the agency’s financial outlook. These reports may include standard financial statements such as the profit and loss statement, cash flow statement, and balance sheet, along with supporting summaries that show revenue, expenses, margins, debt capacity, and liquidity. For a PR agency seeking a loan, working capital facility, line of credit, or startup financing, clear financial reporting is essential. Lenders want to understand whether the business can generate enough cash to cover payroll, rent, software subscriptions, contractor costs, taxes, debt service, and ongoing operating needs. This section helps users present their projections in a structured and professional way. It also supports internal financial management by giving founders and agency leaders a consistent view of expected income, expenses, assets, liabilities, and cash movement over the forecast period.
Revenue Breakdown
The revenue breakdown section provides a detailed view of how total agency revenue is generated across different services and streams. Rather than looking only at total sales, users can analyze the contribution of each offering, such as media relations retainers, crisis communications, digital PR, content services, campaign support, or other advisory services. Inputs may include price per service, number of clients using each service, service adoption rates, monthly retainer amounts, and growth assumptions. Outputs can show revenue by category, percentage contribution by service line, and changes in mix over time. This is useful for a public relations agency because not all services have the same margin, staffing requirement, or sales cycle. A high-value crisis communications service may produce strong revenue but be less predictable, while monthly retainer work may create steadier cash flow. By reviewing the revenue breakdown, users can identify which offerings deserve more sales focus, which may need repricing, and how the overall service mix affects profitability and growth.
KPI Dashboard
The KPI dashboard helps users monitor the operating and financial metrics that matter most for managing a public relations agency. Key performance indicators may include revenue growth, gross margin, EBITDA margin, net profit, cash balance, client acquisition cost, active clients, average monthly retainer, revenue per employee, operating expense ratio, and other performance benchmarks. This component is useful because agency performance is not measured by revenue alone. A growing agency can still face pressure if payroll expands too quickly, client acquisition costs rise, contractor expenses increase, or cash collections lag behind billings. The KPI dashboard helps users track the relationship between business activity and financial results, making it easier to identify issues early and make informed decisions. It can support monthly management reviews, investor updates, board reporting, and internal planning conversations. For founders and operators, it provides a practical way to compare performance against targets and keep the agency aligned with profitability, liquidity, and growth objectives.
Startup Cost and Operating Expense Planning
The startup cost and operating expense planning component helps users estimate the funding required to launch and operate the PR agency before it reaches stable profitability. Startup costs may include office furniture, laptops, monitors, IT setup, branding, website development, legal setup, licenses, initial marketing, deposits, software subscriptions, and working capital reserves. Operating expenses may include rent, payroll, payroll taxes, freelancers, media monitoring software, project management tools, public relations databases, accounting, insurance, travel, business development, and ongoing marketing. Users can adjust these assumptions to reflect a lean remote agency, a larger office-based firm, or an established agency planning expansion. The model then connects these costs to the profit and cash flow forecast, helping users understand how much capital is needed and when expenses may put pressure on cash. This section is valuable for budgeting, fundraising, and decision-making because it reduces the risk of underestimating launch costs or scaling expenses before revenue can support them.
Break-Even Analysis
The break-even analysis component helps users identify when the public relations agency may become profitable and what level of revenue is needed to cover its cost structure. This section typically uses assumptions from revenue, gross margin, fixed costs, payroll, variable costs, and operating expenses to calculate the point at which the agency’s income is sufficient to cover ongoing obligations. For a PR firm, break-even may be influenced by the number of retainer clients, average monthly fees, contractor usage, software costs, office overhead, founder salaries, and marketing spend. The outputs can help users understand the timing of profitability, the monthly revenue target required to cover costs, and the effect of pricing or expense changes on the break-even point. This is useful for launch planning, investor discussions, and internal management because it turns abstract goals into measurable targets. Founders can use it to decide how many anchor clients are needed before hiring additional staff, increasing marketing spend, or committing to larger fixed expenses.
File types:
Excel – Single-User: .xlsx
Excel – Multi-User: .xlsx
Similar ProductsOther customers were also interested in...



 HenrySheykin
Traditional Advertising Agency Financial Model Exc...
The Advertising Agency Financial Model helps founders, agency owners, consultants, analysts, and bus... Read more

Real Estate Agency Financial Model Excel Template
The Real Estate Brokerage Financial Model Financial Model Template helps users build a structured fo... Read more
Call Center Financial Model Excel Template
The Call Center Financial Model helps users build a structured financial forecast for launching, man... Read more
Event Planner Financial Model Excel Template
The Event Planner Financial Model helps users turn an event planning business idea into a structured... Read more

Attorney Employment Agency Financial Model Excel T...
The Recruiting Agency Financial Model helps founders, agency owners, consultants, and analysts build... Read more

Wedding Planner Agency Financial Model Excel Templ...
The Wedding Planning Agency Financial Model helps users turn a wedding planning business idea into a... Read more

 Giorgos
Events & Weddings Venue – 5 Year Financial M...
Financial Model providing an advanced 5-year financial plan for a startup Events & Weddings Venu... Read more

Event Planning Company – Dynamic 10 Year Fin...
Financial Model providing a dynamic up to 10-year financial forecast for a startup or existing Event... Read more

Escape Room Financial Model – 5 Year Forecast
Financial Model providing an advanced 5-year financial plan for a startup or operating Escape Room B... Read more

Family Entertainment Center – 5 Year Financial M...
Financial Model providing an advanced 5-year financial plan for a startup or operating Family Entert... Read more
You must log in to submit a review.