
0 ITEMS

Insurance Agency Financial Model Excel Template
The Insurance Agency Financial Model helps entrepreneurs, agency owners, consultants, analysts, and business planners build a structured financial forecast for launching or scaling an insurance agency. Instead of starting with a blank spreadsheet, users can work from a ready-to-use model designed around agency economics, including commission revenue, subscription fees, service add-ons, customer acquisition, staffing, operating expenses, and cash flow. It gives buyers a practical way to organize assumptions, forecast performance, and understand how key business decisions may affect profitability over time. This template is especially useful for founders preparing a business plan, independent agents evaluating a new agency concept, platform-based insurance marketplaces, consultants developing client financial projections, and teams preparing funding documents for lenders or investors. It supports financial planning by connecting revenue assumptions with startup costs, payroll, operating expenses, cash flow, and profitability outputs. Users can adjust assumptions such as commission rates, average order values, customer segments, agent subscription pricing, marketing costs, hiring plans, and overhead to reflect their own strategy and market conditions. The Insurance Agency Financial Model is built to help users evaluate whether the business can generate enough revenue to cover costs, reach break-even, and maintain healthy liquidity. It includes structured outputs that can support decision-making around pricing, staffing, marketing budgets, capital requirements, and growth timing. By modeling different assumptions, users can compare potential outcomes and identify which drivers have the greatest impact on profit and cash flow. This is helpful for avoiding underfunding, setting realistic targets, and communicating the financial story clearly to stakeholders. Designed for Excel and Google Sheets, the model is editable, organized, and presentation-ready. It can be used for internal planning, investor discussions, loan applications, board updates, or scenario analysis. The template helps turn a complex insurance agency business model into a clear forecast that shows revenue potential, cost structure, financial statements, break-even timing, cash requirements, and long-term scalability. Whether you are launching a new agency, expanding an existing operation, or preparing a professional funding package, this financial model template provides a practical framework for planning with more confidence.
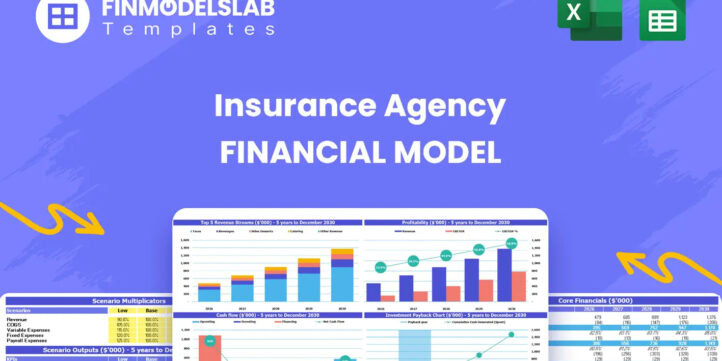


Financial Model Overview
The Insurance Agency Financial Model is a ready-to-use financial model template designed to help users evaluate, plan, and present the financial outlook of an insurance agency business. It brings together the core drivers of agency performance, including policy commissions, subscription fees, client tiers, agent participation, promoted listing revenue, payroll, operating costs, cash flow, profitability, and investor metrics. For an insurance agency, financial planning is especially important because revenue can come from multiple sources while costs may include customer acquisition, compliance, technology, staff, infrastructure, and ongoing support. This template helps organize those assumptions into a structured forecast so entrepreneurs, business owners, consultants, and analysts can understand how the agency may perform over time. It is useful for business plans, funding documents, lender conversations, investor presentations, internal budgeting, expansion planning, and strategic decision-making. Users can edit the inputs, update assumptions, review outputs, test growth cases, and use the model to convert a business concept into a practical financial plan.
All-in-One Dashboard
The all-in-one dashboard gives users a centralized view of the most important inputs and outputs in the Insurance Agency Financial Model. Instead of moving through disconnected calculations, the dashboard is designed to summarize the financial model in a way that is easy to review and communicate. It may include key assumptions such as launch timing, forecast period, commission structure, subscription pricing, agent volume, client acquisition, and major cost categories, while also displaying outputs such as revenue, gross profit, EBITDA, cash position, and profitability trends. This is useful because insurance agency planning often requires quick visibility into both operating assumptions and financial results. A founder can use the dashboard to understand whether the planned agency is moving toward sustainable profitability, while a consultant or analyst can use it to review the logic of the model before presenting it to stakeholders. The dashboard also supports faster decision-making by showing how changes in revenue assumptions, payroll, expenses, or growth rates affect the broader financial forecast. For investor or lender discussions, it provides a clean summary of the business case and helps turn spreadsheet detail into a more accessible planning tool.
Low, Base, and High Scenario Analysis
The low, base, and high scenario analysis component allows users to compare three different versions of the insurance agency forecast. This section is useful because financial planning rarely depends on one fixed outcome. An agency may acquire clients faster than expected, experience slower agent onboarding, face higher marketing costs, or achieve better average policy values through stronger client mix. The scenario analysis lets users test how different assumptions affect revenue, costs, cash flow, and profitability. A low case may reflect conservative customer acquisition, lower average order values, or higher operating costs. A base case may represent the expected business plan. A high case may reflect stronger conversion rates, faster growth, improved commission performance, or greater uptake of subscription and advertising services. This comparison helps users prepare for uncertainty and evaluate the resilience of the business model. It is also valuable for funding preparation because investors and lenders often want to understand downside risk, expected performance, and upside potential. By reviewing multiple outcomes in one model, users can identify which assumptions have the greatest impact on results and make more informed choices about staffing, marketing spend, capital needs, and growth strategy.
Professional Charts
The professional charts component converts key financial outputs into visual reports that are easier to interpret and present. Insurance agency forecasts can include many detailed calculations, but stakeholders often need a fast way to understand the overall story. Charts can help visualize revenue growth, EBITDA development, cash flow movement, expense structure, customer or agent growth, and profitability over time. This component is useful for business plans, pitch decks, lender packages, management meetings, and investor updates because it communicates trends more clearly than rows of numbers alone. Users can review whether revenue is scaling consistently, whether margins are improving, whether cash balances remain healthy, and whether the agency is moving toward stronger financial performance over the five-year forecast period. Professional visuals also make it easier to compare scenarios and explain the relationship between strategy and financial outcomes. For example, a chart showing revenue by year can support a growth narrative, while a cash flow chart can show whether the agency has enough liquidity to support expansion. By including presentation-ready visual outputs, the model helps users save time and produce more polished financial materials for decision-making and stakeholder communication.
ROE Components and DuPont Analysis
The ROE components and DuPont analysis section helps users evaluate the drivers behind return on equity rather than looking only at headline profitability. In an insurance agency financial model, return on equity can be influenced by profit margins, asset efficiency, capital structure, and the amount of owner or investor funding required to support growth. DuPont analysis breaks ROE into more meaningful components, helping users understand whether returns are coming from operating profitability, efficient use of resources, or leverage. This is valuable for investors, founders, and analysts who want to assess the quality of the business model and not just its projected income statement. Inputs may include net income, revenue, total assets, equity, and other financial statement outputs generated by the model. The resulting analysis can help users identify whether the agency needs to improve margins, increase revenue productivity, reduce capital intensity, or adjust its financing structure. For funding discussions, this section adds sophistication because it shows how the business creates returns and where performance improvements may be possible. It also supports long-term planning by helping users evaluate how changes in pricing, operating expenses, technology investment, and growth assumptions affect shareholder returns.
Revenue Inputs
The revenue inputs section is where users define the main commercial assumptions that drive the insurance agency forecast. For this business model, revenue may come from commissions on policy sales, monthly subscription fees from agents, monthly client subscription fees, and additional seller or agent fees such as advertising, promoted listings, or enhanced visibility services. The model can use assumptions such as agent acquisition, client acquisition, client tiers, agent categories, policy sales volume, repeat order rates, average order values, and commission percentages. These assumptions are important because small changes in average order value, conversion rates, or commission rates can significantly affect total revenue and profitability. The revenue input structure helps users replace guesswork with documented planning assumptions. A founder can adjust policy values for individual, small business, or enterprise clients, while an analyst can test how a different commission rate or subscription plan changes the forecast. This component is useful for budgeting and investor preparation because it clearly shows how revenue is expected to be generated. It also helps users evaluate strategic questions, such as whether to focus on higher-value commercial clients, increase agent subscription pricing, expand advertising services, or grow policy volume through stronger client acquisition.
Bank-Ready Reports
The bank-ready reports component organizes financial outputs in a format that supports lender review, credit discussions, and formal funding applications. Insurance agencies may need startup capital for technology development, office setup, compliance, hiring, marketing, working capital, and early operating expenses. Lenders typically want to see clear financial statements, realistic assumptions, repayment capacity, cash flow visibility, and evidence that the business can manage its obligations. This section can include forecasted income statements, cash flow statements, balance sheet outputs, and financial summaries that present the agency’s expected performance in a structured way. The value of this component is that it helps users move beyond informal planning and prepare materials that are easier for banks, loan officers, advisors, and other stakeholders to review. It supports decision-making by showing whether the projected cash flow can support debt service or whether the business needs a different funding structure. For founders and consultants, bank-ready reports can save time by organizing the model’s outputs into lender-friendly financial information. They also help users identify weak points before submitting funding documents, such as insufficient cash reserves, unrealistic growth expectations, or expense levels that reduce repayment capacity.
Revenue Breakdown
The revenue breakdown component gives users a detailed view of how total income is generated across the insurance agency’s different revenue streams. This is important because an insurance agency model may rely on a mix of commissions, subscriptions, client fees, agent fees, and optional service revenue. Looking only at total revenue can hide whether growth is being driven by policy sales, recurring subscription income, promoted listings, or a particular customer segment. This section helps users understand the composition of revenue and evaluate the quality and scalability of each stream. Inputs may include commission rates, average order values, number of clients, number of agents, pricing tiers, repeat purchase assumptions, and service fee adoption. Outputs may show revenue by category, by customer segment, by year, or by period, making it easier to identify the strongest contributors. The revenue breakdown is useful for strategy because it can reveal whether the agency should prioritize higher-value commercial clients, improve subscription conversion, increase agent participation, or promote higher-margin services. It is also helpful for investor conversations because it demonstrates that the forecast is built from identifiable revenue drivers rather than a single broad sales estimate. This level of detail supports more credible planning and better commercial decision-making.
KPI Dashboard
The KPI dashboard component focuses on the performance metrics that help users monitor the health of the insurance agency over time. While financial statements show revenue, expenses, and profit, key performance indicators help explain why those results are happening. For an insurance agency, relevant KPIs may include agent count, client count, average order value, commission rate, subscription revenue, acquisition cost, revenue per client, revenue per agent, EBITDA margin, cash balance, and break-even timing. A KPI dashboard is useful because it translates the model into operational measures that can be tracked monthly, quarterly, or annually. Users can compare projected performance against internal goals, industry expectations, or investor requirements. The dashboard can also help identify areas that need attention, such as rising acquisition costs, slower client growth, declining policy value, or lower-than-expected subscription uptake. For decision-making, the KPI dashboard helps management connect operating actions to financial outcomes. For example, improving client acquisition may increase commission revenue, while reducing marketing cost per customer may improve profitability and cash flow. This section is especially useful for ongoing management after launch because it gives founders and operators a structured way to monitor progress and adjust the business plan.
Startup Cost Planning
The startup cost planning component helps users estimate the initial investment required before the insurance agency begins operating at scale. This may include technology platform development, server infrastructure, software tools, licensing and compliance costs, legal setup, office equipment, initial marketing, professional services, deposits, and working capital reserves. For an insurance agency with a digital or platform-based model, startup costs can be especially important because the business may require upfront spending on technology, systems, marketing, and operational setup before revenue becomes consistent. This section helps users separate one-time launch costs from recurring operating expenses, making it easier to understand the true funding requirement. Inputs may include individual cost categories, timing of payments, expected useful life for capital expenditures, and any initial cash reserve target. Outputs can show total startup investment, funding needed before launch, and how those costs affect the balance sheet and cash flow forecast. This component is useful for founders preparing to raise capital, apply for a loan, or determine how much personal investment is required. It also helps prevent underfunding by making launch expenses visible early in the planning process. A clear startup cost plan supports more realistic budgeting and gives stakeholders confidence that the agency has considered the resources needed to begin operations properly.
Break-Even Analysis
The break-even analysis component helps users determine when the insurance agency is expected to generate enough contribution from commissions, subscriptions, service fees, and other revenue streams to cover its fixed and variable costs. This is one of the most important planning tools for a new or growing agency because it shows how much revenue is needed before the business becomes self-sustaining. Inputs may include fixed operating expenses, payroll, technology costs, customer acquisition costs, agent support costs, commission margins, subscription pricing, and average revenue per client or agent. Outputs may show the break-even month, required sales volume, required revenue level, and the relationship between overhead and contribution margin. This section is useful for decision-making because it helps users understand whether the agency’s pricing, staffing plan, and marketing strategy are realistic. If break-even depends on very aggressive client acquisition or unusually high policy values, users can revisit assumptions before committing capital. If the model shows a rapid path to break-even, the user can use that insight to support investor or lender discussions while still testing downside cases.
File types:
Excel – Single-User: .xlsx
Excel – Multi-User: .xlsx
Similar ProductsOther customers were also interested in...

 HenrySheykin
Travel Agency Financial Model Excel Template
The Travel Agency Financial Model helps entrepreneurs, founders, consultants, analysts, and business... Read more
Recruitment Agency Financial Model Excel Template
The Recruiting Agency Financial Model helps founders, agency owners, consultants, and analysts build... Read more
Bookkeeping Agency Financial Model Excel Template
The Accounting Firm Financial Model Template helps founders, practice owners, consultants, analysts,... Read more
Architecture Firm Financial Model Excel Template
The Architectural Firm Financial Model Template helps founders, architecture practice owners, consul... Read more

Consulting Agency Financial Model Excel Template
The Consulting Firm Financial Model helps users turn a service-based consulting concept into a struc... Read more
Financial Advisors Agency Financial Model Excel Te...
The Financial Advisor Financial Model is a ready-to-use financial model template built for planning,... Read more

Life Coaching Financial Model Excel Template
The Life Coaching Financial Model helps coaches, entrepreneurs, consultants, founders, and business ... Read more
Notary Financial Model Excel Template
The Notary Service Financial Model helps entrepreneurs, business owners, consultants, analysts, and ... Read more
Legal Services Financial Model Excel Template
The Legal Services Financial Model Financial Model Template helps entrepreneurs, law firm founders, ... Read more

Private Counseling Practice Financial Model Excel ...
The Private Counseling Financial Model helps users turn a therapy practice concept into a structured... Read more
You must log in to submit a review.