
0 ITEMS

Pre-Money vs Post-Money Valuation: Formulas and Examples

Two words on a term sheet — “pre-money” or “post-money” — can change how much of your company you give away by five percentage points or more, even when the headline valuation and the check size stay exactly the same. Yet the difference between them comes down to a single equation and one ownership formula, both of which take less than a minute to apply.
This guide walks through the core math, side-by-side worked examples at $3M and $1M raises, how option pool placement quietly shifts dilution onto founders, current seed and Series A benchmarks, the five calculation mistakes that cost founders equity, and a four-step framework for evaluating any offer before you sign.
Key Takeaways
- Post-money valuation equals pre-money valuation plus the investment amount: a $10M pre-money company that raises $2M has a $12M post-money valuation.
- Investor ownership percentage is always calculated as Investment ÷ Post-Money Valuation, regardless of which basis the term sheet uses.
- A $4M pre-money valuation with a $1M raise gives investors 20% ownership; the same $1M raise against a $4M post-money valuation gives investors 25% — a 5-percentage-point difference on identical numbers.
- Option pools structured on a pre-money basis can cost founders 3–5% more ownership than the same pool structured on a post-money basis.
- In Q4 2021, the median post-money valuation on Carta was $24M at seed stage and $78.7M at Series A.
- Y Combinator’s post-money SAFE (introduced in 2018) standardized post-money terms for pre-seed rounds, shifting negotiating norms industry-wide.
- Always convert any term sheet to post-money terms before comparing offers — it’s the only apples-to-apples basis.
Pre-Money vs Post-Money Valuation: Core Definitions and Math
Pre-money valuation is what a company is worth before new investment arrives; post-money valuation is what it’s worth immediately after. The relationship between them is a single equation: Post-Money = Pre-Money + Investment (Wikipedia, 2024).
These aren’t just labels. They determine how much of your company you hand over for every dollar you raise. A founder who confuses the two can give away 5 percentage points more equity than intended — and never realize it until the cap table is already signed.
Plain English: Pre-money is the price tag before the check clears. Post-money is the price tag after. The investor’s ownership slice is always cut from the post-money pie.
The Ownership Formula: How Investment Determines Your Stake
Investor ownership percentage equals Investment Amount divided by Post-Money Valuation (Pilot, 2023). This formula never changes, regardless of whether the term sheet quotes a pre-money or post-money number.
The confusion arises because term sheets can anchor on either side of the equation. When a term sheet says “$10M pre-money,” you must add the investment to get post-money before you can calculate ownership. When it says “$12M post-money,” you can calculate ownership directly.
Here are the two paths:
- Given pre-money: Post-Money = Pre-Money + Investment → Ownership % = Investment ÷ Post-Money
- Given post-money: Ownership % = Investment ÷ Post-Money (no conversion needed)
- Given desired ownership %: Post-Money = Investment ÷ Ownership % → Pre-Money = Post-Money − Investment

Which number does your term sheet give you? Each starting point requires a different calculation path.
Worked Example: $3 Million Investment at Different Valuation Bases
A $3M investment produces very different ownership outcomes depending on whether the term sheet quotes pre-money or post-money. Here’s the math for both scenarios side by side.
Scenario A: $12M pre-money, $3M investment
- Post-Money = $12M + $3M = $15M
- Investor Ownership = $3M ÷ $15M = 20.0%
- Founder Retention = 80.0%
Scenario B: $12M post-money, $3M investment
- Post-Money = $12M (already stated)
- Pre-Money = $12M − $3M = $9M
- Investor Ownership = $3M ÷ $12M = 25.0%
- Founder Retention = 75.0%
The investment amount is identical. The post-money number is identical. Yet the founder gives up 5 more percentage points in Scenario B simply because the term sheet anchored on post-money rather than pre-money. If an investor says “$12M valuation” without specifying which basis, always ask.
According to Runway (2023), if an investor puts $3M into a company for 20% equity, the implied pre-money valuation is $12M — confirming that Scenario A is the standard interpretation when an investor quotes a percentage alongside a pre-money figure (Runway, 2023).
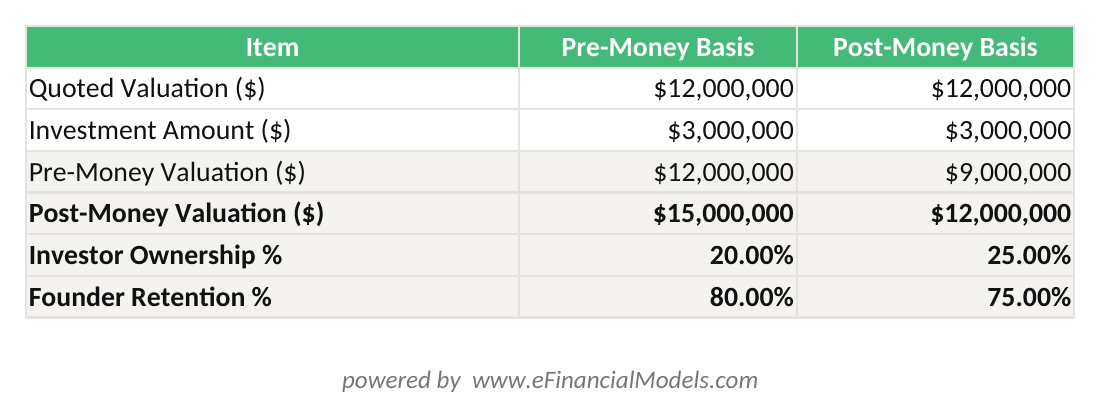
Enter your pre-money valuation and investment amount to see investor ownership and founder retention under both valuation bases.
Worked Example: $1 Million Investment Under Pre-Money vs Post-Money Terms
Smaller rounds make the difference even more visible in percentage terms. CRV’s analysis shows that a $4M pre-money valuation with a $1M investment gives investors 20% ownership, while a $4M post-money valuation with the same $1M investment gives investors 25% ownership (CRV, 2022).
Here’s the step-by-step math:
Pre-money basis:
- Post-Money = $4M + $1M = $5M
- Investor Ownership = $1M ÷ $5M = 20.0%
- Founder keeps 80.0%
Post-money basis:
- Post-Money = $4M (given)
- Pre-Money = $4M − $1M = $3M
- Investor Ownership = $1M ÷ $4M = 25.0%
- Founder keeps 75.0%
The founder loses an extra 5% of the company — worth real money at exit — simply from the framing of one number on the term sheet.

Identical headline valuation, identical investment — but the basis changes investor ownership by 5 percentage points.
Comparison: Pre-Money vs Post-Money Across Key Scenarios
The table below shows how ownership percentages shift across four common raise sizes when the valuation basis changes. In every row, the quoted valuation number is held constant at $10M.
| Investment | Basis | Post-Money | Investor % | Founder % |
|---|---|---|---|---|
| $1M | Pre-money ($10M) | $11M | 9.1% | 90.9% |
| $1M | Post-money ($10M) | $10M | 10.0% | 90.0% |
| $2M | Pre-money ($10M) | $12M | 16.7% | 83.3% |
| $2M | Post-money ($10M) | $10M | 20.0% | 80.0% |
| $3M | Pre-money ($10M) | $13M | 23.1% | 76.9% |
| $3M | Post-money ($10M) | $10M | 30.0% | 70.0% |
| $5M | Pre-money ($10M) | $15M | 33.3% | 66.7% |
| $5M | Post-money ($10M) | $10M | 50.0% | 50.0% |
The gap widens dramatically as the investment grows relative to the valuation. A $5M raise against a $10M post-money valuation leaves founders with exactly 50% — a control-threatening outcome that looks very different from the 33.3% dilution under pre-money terms.

As investment size grows relative to valuation, the gap between pre-money and post-money founder retention widens sharply.
Option Pool Treatment: The 3–5% Founder Dilution Difference
Option pools (also called employee stock option pools, or ESOPs) are blocks of equity set aside to compensate future employees and advisors. Where the option pool sits in the cap table structure determines who actually pays for it.
When an investor requires a 15% option pool and structures it on a pre-money basis, the pool is carved out of the founders’ existing shares before the investment closes. This means the pool dilutes founders, not investors. A 15% option pool structured under a pre-money valuation can cost founders approximately 3–5% more ownership than the same 15% option pool under post-money terms (Open Forest, 2024).
Here’s the concrete math for a $10M pre-money valuation with a $2M raise and a 10% option pool:
Option pool on pre-money basis:
- Effective pre-money (after pool carve-out) = $10M × (1 − 10%) = $9M
- Post-Money = $9M + $2M = $11M
- Investor Ownership = $2M ÷ $11M = 18.2%
- Founders retain: 100% − 18.2% − 10% = 71.8%
Option pool on post-money basis:
- Post-Money = $10M + $2M = $12M
- Investor Ownership = $2M ÷ $12M = 16.7%
- Option pool = 10% of post-money cap table
- Founders retain: 100% − 16.7% − 10% = 73.3%
The difference is 1.5 percentage points in this example. At larger option pools (15–20%) or lower valuations, the gap reaches the 3–5% range cited above. Always ask whether the option pool is pre- or post-money, and model both scenarios before accepting a term sheet.
A pre-money option pool carve-out reduces founder equity before the investor even writes a check.
Calculating Backwards: Deriving Pre-Money From Desired Ownership
Sometimes you know what ownership percentage you’re willing to give and the investment amount, and you need to work backwards to the valuation. This is common when a founder wants to set a minimum acceptable valuation before entering negotiations.
The formula: Pre-Money = (Investment ÷ Desired Ownership %) − Investment
Example: You’re raising $2M and you’re willing to give up no more than 20%.
- Post-Money = $2M ÷ 20% = $10M
- Pre-Money = $10M − $2M = $8M
You need a minimum pre-money valuation of $8M to keep dilution at or below 20%. If an investor offers a $6M pre-money valuation on a $2M raise, the math gives them 25% — above your threshold.
A $2M investment into a $10M pre-money company implies a $12M post-money valuation and buys the investor 16.7% ownership (Sofer Advisors, 2023). That same $2M against a $10M post-money valuation gives the investor 20.0% — a 3.3-point difference from the same quoted number.

Work backwards from your maximum acceptable dilution to set a minimum pre-money valuation before negotiations begin.
Market Benchmarks: Seed and Series A Valuation Data
Real negotiation requires real benchmarks. In Q4 2021, the median post-money valuation on Carta was $24M at the seed stage and $78.7M at Series A (Carta, 2022). These figures represent the peak of the 2021 bull market and have moderated since, but they establish the order of magnitude founders and investors work within.
For context, a $24M seed post-money valuation with a typical $2M–$3M seed raise implies a pre-money valuation of $21M–$22M. At Series A, a $78.7M post-money with a $10M–$15M raise implies a pre-money of $63.7M–$68.7M.
These benchmarks matter because they anchor what’s “normal” when a term sheet arrives. A seed investor offering a $5M pre-money valuation in a market where medians sit at $21M is offering roughly one-quarter of the benchmark — a signal to push back or seek competing offers.
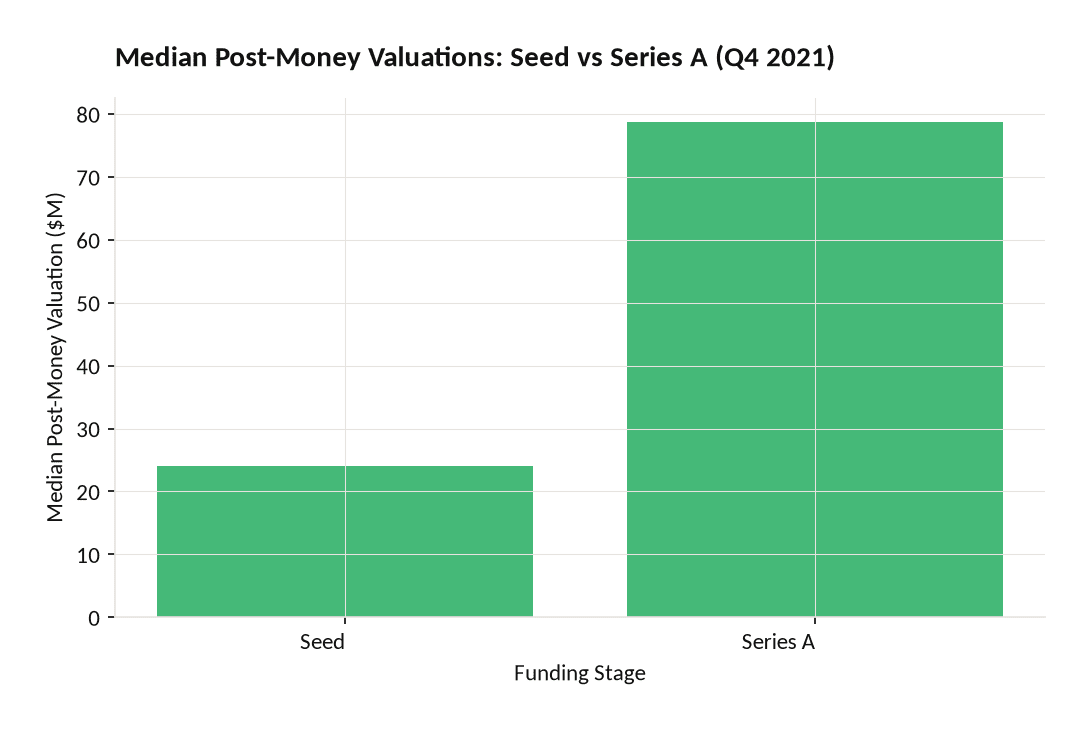
Q4 2021 Carta data shows seed valuations averaging $24M and Series A at $78.7M — benchmarks for founder negotiation context.
Pre-Money vs Post-Money in Term Sheets: Which Favors Founders?
Pre-money terms generally favor founders; post-money terms generally favor investors. The reason is mechanical: when a term sheet anchors on pre-money, the investment amount is additive and the investor’s percentage is naturally diluted by the size of the raise. When it anchors on post-money, the investor’s percentage is fixed regardless of how much they put in.
Y Combinator shifted the pre-seed market significantly in 2018 when it introduced the post-money SAFE (Simple Agreement for Future Equity). The post-money SAFE specifies the investor’s ownership percentage at conversion explicitly, removing ambiguity about dilution. This was a deliberate design choice to give investors more certainty — but it also means founders must model the cap table impact more carefully, since multiple post-money SAFEs stack in a predictable but potentially dilutive way.
For priced rounds (Series A and beyond), pre-money terms remain the dominant convention in the U.S. market. The option pool shuffle — requiring founders to top up the option pool before closing, on a pre-money basis — is a standard investor tactic that effectively lowers the pre-money valuation without changing the headline number.
| Feature | Pre-Money Terms | Post-Money Terms |
|---|---|---|
| Investor % certainty | Lower (depends on raise size) | Higher (fixed at signing) |
| Founder dilution | Lower for same headline number | Higher for same headline number |
| Option pool impact | Founders bear full cost | Shared with investors |
| Common in | Priced rounds (Series A+) | Pre-seed SAFEs (post-2018) |
| Negotiating leverage | Favors founders | Favors investors |
| Conversion complexity | Requires adding investment | Direct calculation |
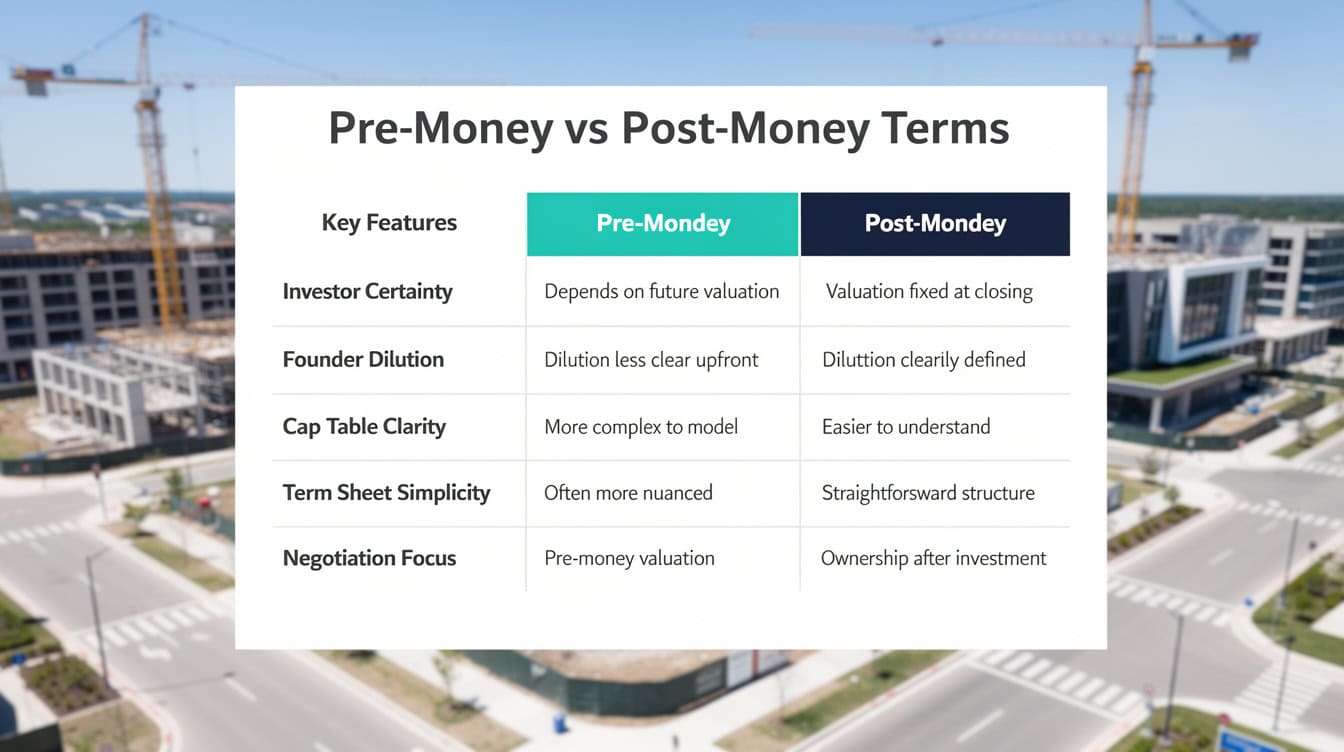
Pre-money terms favor founders on dilution; post-money terms give investors more certainty on their ownership stake.
Common Calculation Errors and How to Avoid Them
Cap table errors from pre/post confusion are more common than most founders admit. Here are the 5 mistakes that appear most often, and the fix for each.
Mistake 1: Treating the quoted valuation as post-money when it’s pre-money.
A term sheet says “$10M valuation.” The founder assumes this is post-money and calculates 20% dilution on a $2M raise. It’s actually pre-money, so post-money is $12M and dilution is 16.7%. The fix: always ask “is this pre- or post-money?” before any calculation.
Mistake 2: Forgetting to add the option pool before calculating investor ownership.
Founders calculate investor % on the current cap table, ignoring the option pool top-up required at closing. The fix: model the fully diluted cap table including the post-close option pool before calculating any percentages.
Mistake 3: Comparing two term sheets on different bases.
Offer A quotes $8M pre-money; Offer B quotes $9M post-money. Offer B looks higher. But with a $2M raise, Offer A implies $10M post-money — making it the better deal. The fix: convert all offers to post-money before comparing.
Mistake 4: Applying the ownership formula to pre-money instead of post-money.
Ownership % = Investment ÷ Pre-Money is wrong. The denominator must always be post-money. Using pre-money understates the investor’s percentage and overstates founder retention.
Mistake 5: Ignoring multiple closings.
Some rounds close in tranches. Each tranche changes the post-money valuation and therefore the ownership percentages of all prior investors. The fix: model each closing separately and recalculate the full cap table after each one.

Each of these five errors has cost founders real equity. The fix for all of them is the same: always work in post-money terms.
Decision Framework: Evaluating and Negotiating Valuation Terms
Before signing any term sheet, run through this four-step framework to understand exactly what you’re agreeing to.
Step 1: Identify the basis. Is the quoted valuation pre-money or post-money? If the term sheet is silent, ask in writing.
Step 2: Convert to post-money. Add the investment to pre-money if needed. This is your single comparable number.
Step 3: Calculate investor ownership. Divide investment by post-money. This is the percentage leaving your cap table.
Step 4: Model the option pool. Determine whether the option pool is pre- or post-money, and recalculate founder retention after both the investment and the pool are accounted for.
For a $5M pre-money valuation with a $2M raise and a 10% post-money option pool:
- Post-Money = $5M + $2M = $7M
- Investor % = $2M ÷ $7M = 28.6%
- Option pool = 10.0%
- Founder retention = 100% − 28.6% − 10.0% = 61.4%
If the same option pool were pre-money, founders would retain even less. Modeling both scenarios takes under five minutes with a cap table template and can save founders millions of dollars in equity value at exit.
For founders managing multiple funding rounds, a startup financial modeling framework that tracks dilution across rounds is essential. You can also explore seed funding models and venture capital financial models to stress-test your cap table before each raise.
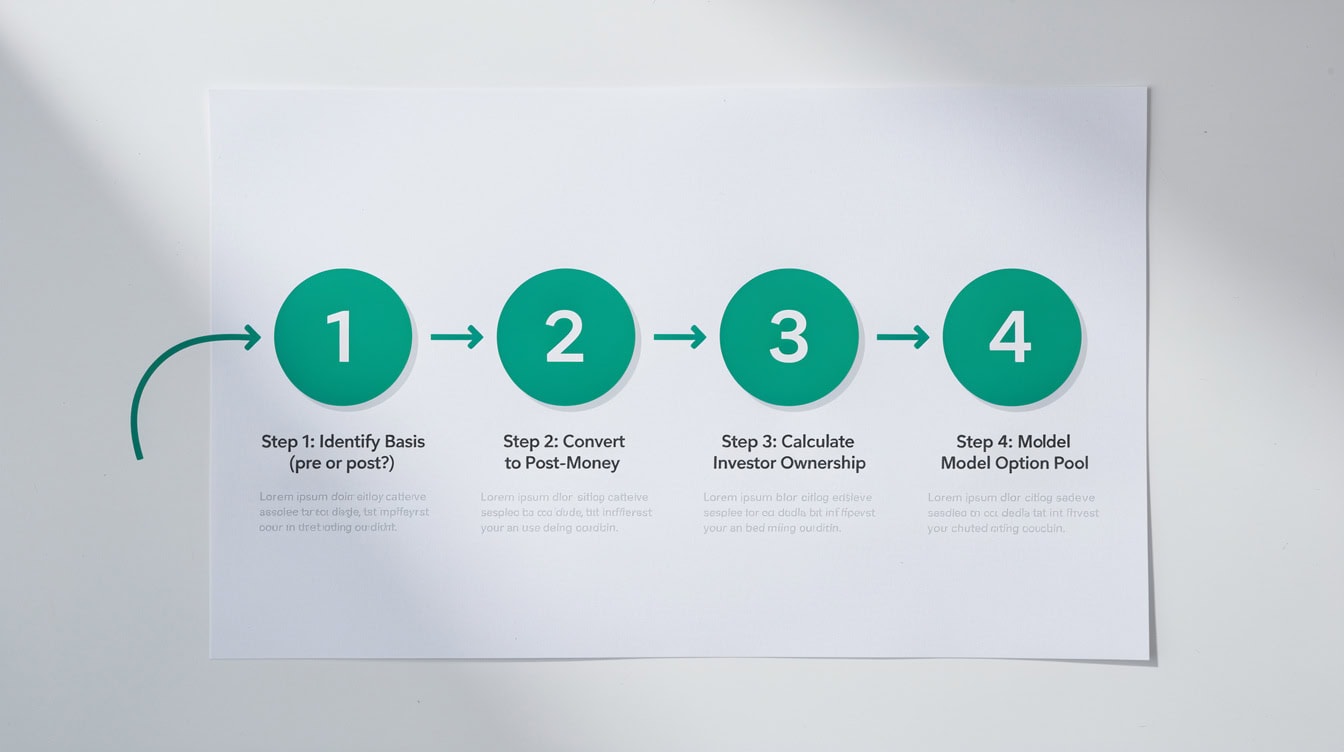
Run every term sheet through these four steps before signing. The process takes under ten minutes and protects founder equity.
Frequently Asked Questions
What is the difference between pre-money and post-money valuation in simple terms?
Pre-money valuation is the value of your company before an investor writes a check. Post-money valuation is the value immediately after the investment closes. The relationship is always: Post-Money = Pre-Money + Investment. If your company is worth $8M before a $2M raise, the post-money valuation is $10M. The investor owns $2M ÷ $10M = 20% of the company. The distinction matters because the same headline number ($10M) means very different things depending on whether it’s quoted as pre- or post-money — a $10M pre-money with a $2M raise gives the investor 16.7%, while a $10M post-money gives the investor 20.0%.
How do I calculate investor ownership percentage from a pre-money valuation?
You can’t calculate ownership directly from pre-money alone — you need the investment amount too. The steps are: (1) Add the investment to the pre-money valuation to get post-money. (2) Divide the investment by post-money to get ownership percentage. Example: $6M pre-money + $1.5M investment = $7.5M post-money. Investor ownership = $1.5M ÷ $7.5M = 20.0%. The formula Ownership % = Investment ÷ Post-Money always holds. Never divide by pre-money — that formula is incorrect and will overstate the investor’s percentage.
Why does the option pool matter for pre-money vs post-money valuation?
Option pools (blocks of equity reserved for future employees) are typically required by investors at closing. If the pool is structured on a pre-money basis, it’s carved out of the founders’ existing shares before the investment closes, which lowers the effective pre-money valuation and increases investor ownership without changing the headline number. A 15% option pool on a pre-money basis can cost founders approximately 3–5% more ownership than the same pool on a post-money basis, according to Open Forest (2024). Always model both scenarios: pre-money pool treatment is a common term sheet tactic that reduces founder equity without appearing to change the valuation.
What is a post-money SAFE and how does it differ from a pre-money SAFE?
A SAFE (Simple Agreement for Future Equity) is a convertible instrument that gives investors the right to equity at a future priced round. Y Combinator introduced the post-money SAFE in 2018 to replace its original pre-money version. The key difference: a post-money SAFE specifies the investor’s ownership percentage at conversion explicitly (Investment ÷ Post-Money Cap), so founders know exactly how much dilution each SAFE creates. With a pre-money SAFE, the dilution depends on how many other SAFEs convert simultaneously, making it harder to model. For example, a $500K post-money SAFE on a $5M cap gives the investor exactly 10.0% at conversion, regardless of other SAFEs. A pre-money SAFE on the same cap could give more or less depending on the total conversion pool.
How do I compare two term sheets that use different valuation bases?
Convert both to post-money valuation before comparing. If Offer A quotes $9M pre-money with a $3M raise, the post-money is $12M and investor ownership is 25.0%. If Offer B quotes $11M post-money with the same $3M raise, investor ownership is $3M ÷ $11M = 27.3%. Offer A is better for the founder despite the lower headline number. The only apples-to-apples comparison is post-money valuation paired with investor ownership percentage. Also check option pool treatment — a higher post-money valuation with a pre-money option pool can still result in lower founder retention than a lower post-money valuation with a post-money pool.
What were typical seed and Series A valuations in recent years?
In Q4 2021, the median post-money valuation on Carta was $24M at the seed stage and $78.7M at Series A, representing the peak of the 2021 venture market (Carta, 2022). These figures have moderated since then as interest rates rose and venture activity slowed through 2022–2023. For a $24M seed post-money with a typical $2M–$3M seed raise, the implied pre-money is $21M–$22M. Founders should use current-year data from Carta’s State of Private Markets reports or PitchBook’s Venture Monitor to benchmark their specific stage, sector, and geography before entering negotiations.
Can pre-money and post-money valuations affect taxes or accounting treatment?
The pre/post distinction itself does not create different tax or accounting outcomes — both represent equity transactions recorded at fair market value. However, the 409A valuation (the IRS-required independent appraisal of common stock fair market value for U.S. companies) is typically updated after each priced round closes, using the post-money valuation as a reference point. A higher post-money valuation raises the 409A strike price for future option grants, which can reduce the economic value of those options for employees. Founders should time option grants carefully relative to funding closes, and consult a qualified tax advisor before issuing options near a funding event.
Conclusion
Pre-money and post-money valuation are two sides of the same equation, but confusing them costs founders real equity. The math is straightforward: Post-Money = Pre-Money + Investment, and Investor Ownership = Investment ÷ Post-Money. Every term sheet negotiation, every option pool discussion, and every cap table model flows from those two formulas.
The practical takeaways: always identify which basis a term sheet uses, convert to post-money before comparing offers, model option pool treatment separately, and benchmark your valuation against current market data before accepting any terms.
I recommend downloading the EFM Cap Table Template with built-in pre-money and post-money calculators to model your fundraising scenarios and ownership dilution accurately before your next term sheet conversation.
























































