
0 ITEMS

India SaaS Market 2026-2031: $50B Export Opportunity

India’s SaaS sector is splitting into two distinct investable themes: a domestic SMB market constrained by low average contract values but massive scale, and a horizontal export engine already generating global revenues at US-comparable gross margins.
Key Takeaways
- India’s SaaS market is projected to reach approximately $50 billion by 2031, growing at a CAGR of roughly 20-22% from an estimated $18-20 billion baseline in 2026.
- The domestic SMB segment accounts for roughly 35% of total India SaaS revenue today, but faces average contract values (ACVs) of $200-$800 per year, compressing unit economics relative to export peers.
- Export-oriented horizontal SaaS companies (think Freshworks, Zoho, Chargebee) command ACVs of $3,000-$15,000 from Western buyers, with gross margins of 70-80%, matching US SaaS benchmarks.
- Customer acquisition costs (CAC) for Indian SMB SaaS run $80-$250 per customer, with payback periods of 18-36 months due to high churn rates of 15-25% annually.
- Indian SaaS companies trade at 4-8x forward revenue multiples on public markets, a 30-40% discount to US SaaS peers, creating a valuation arbitrage opportunity for strategic acquirers.
- India produces over 5 million software developers, with mid-level engineering talent costing 60-70% less than equivalent US roles, structurally supporting superior R&D-to-revenue ratios.
- GST at 18% applies to SaaS services in India, and data localization requirements under the Digital Personal Data Protection Act 2023 are reshaping infrastructure investment decisions for both domestic and export players.
India SaaS Market Overview: 2026-2031 Revenue Projections

India’s SaaS market sits at an estimated $18-20 billion in 2026 and is on track to reach $50 billion by 2031, implying a compound annual growth rate (CAGR) of approximately 20-22%. This growth is not uniform: export revenues are growing faster than domestic revenues, and the two segments require entirely different financial models to evaluate accurately.
Several structural tailwinds support this trajectory. India’s internet user base crossed 900 million in 2024 according to the Telecom Regulatory Authority of India, and UPI (Unified Payments Interface) processed over 131 billion transactions in fiscal year 2023-24, creating the payment infrastructure that SaaS billing and subscription management depends on. The government’s Digital India initiative has accelerated cloud adoption among mid-market enterprises, compressing the sales cycle for domestic SaaS vendors.
India’s developer talent pool exceeds 5 million professionals according to NASSCOM, with average annual compensation for a mid-level software engineer running $15,000-$25,000 compared to $120,000-$160,000 in the United States. This 6-8x cost differential is the single most important structural advantage for Indian SaaS companies competing globally, and it directly inflates gross margins and R&D productivity ratios.
Market Segmentation: SMB Domestic vs. Horizontal SaaS Export
The India SaaS market divides cleanly into two segments with different economics, buyers, and risk profiles. Understanding this split is essential before building any financial model or investment thesis.
The domestic SMB segment serves India’s 63 million micro, small, and medium enterprises (MSMEs), a figure cited by the Ministry of Micro, Small and Medium Enterprises. SaaS penetration among Indian SMBs remains below 15%, compared to 60-70% in the US, which represents the TAM expansion argument. However, low purchasing power limits ACVs: most SMB SaaS products in India price between $200 and $800 per year, with freemium-to-paid conversion rates of 3-8%.
The horizontal SaaS export segment targets Western enterprise and mid-market buyers with category-agnostic tools: CRM, customer support, billing, HR, and marketing automation. Companies in this segment price in USD or EUR, with ACVs of $3,000-$15,000 for SMB buyers in the US and $20,000-$80,000 for enterprise contracts. Freshworks reported $685 million in revenue for fiscal year 2024, with 72% gross margins, demonstrating that Indian-origin SaaS can achieve US-comparable financial profiles at scale.
| Metric | SMB Domestic | Horizontal Export |
|---|---|---|
| ACV Range | $200-$800 | $3,000-$80,000 |
| Gross Margin | 55-65% | 70-80% |
| CAC | $80-$250 | $800-$4,000 |
| Payback Period | 18-36 months | 12-24 months |
| Annual Churn | 15-25% | 8-15% |
| TAM (2031E) | ~$15B | ~$35B |
Financial Performance Benchmarks: Unit Economics of Indian SaaS Companies
Unit economics (the per-customer revenue, cost, and profit metrics that determine whether a SaaS business is structurally sound) differ sharply between India’s two SaaS segments. Investors who apply US benchmarks uniformly to Indian SaaS companies will systematically misprice both risk and opportunity.
Worked Example: LTV/CAC Ratio Comparison
Here’s the math for a mid-market Indian SMB SaaS company versus an export-focused horizontal SaaS company:
SMB Domestic SaaS:
- ACV: $500
- Gross Margin: 60%
- Annual Gross Profit per Customer: $500 x 0.60 = $300
- Annual Churn Rate: 20% (average customer life = 1/0.20 = 5 years)
- LTV: $300 x 5 = $1,500
- CAC: $180
- LTV/CAC Ratio: $1,500 / $180 = 8.3x
- CAC Payback Period: $180 / $300 = 0.6 years (7 months)
Horizontal Export SaaS (US SMB buyer):
- ACV: $6,000
- Gross Margin: 75%
- Annual Gross Profit per Customer: $6,000 x 0.75 = $4,500
- Annual Churn Rate: 12% (average customer life = 1/0.12 = 8.3 years)
- LTV: $4,500 x 8.3 = $37,350
- CAC: $2,500
- LTV/CAC Ratio: $37,350 / $2,500 = 14.9x
- CAC Payback Period: $2,500 / $4,500 = 0.56 years (6.7 months)
The export model generates nearly 25x more LTV per customer despite 14x higher CAC. The payback periods are comparable, but the absolute profit pool is dramatically larger in the export segment.
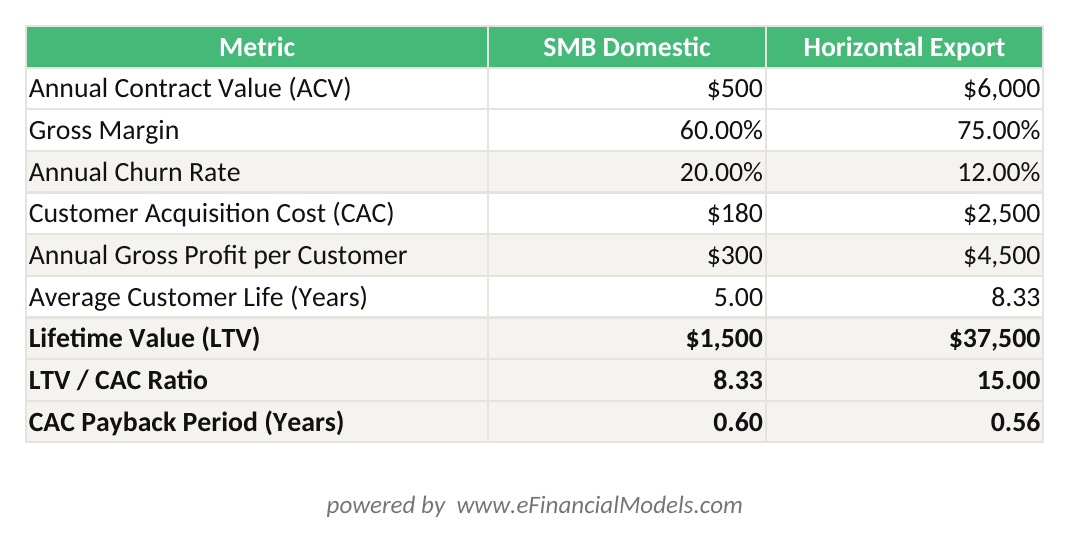
LTV/CAC ratio for export SaaS (14.9x) is nearly double the SMB domestic ratio (8.3x), driven by higher ACV and lower churn rather than lower CAC.
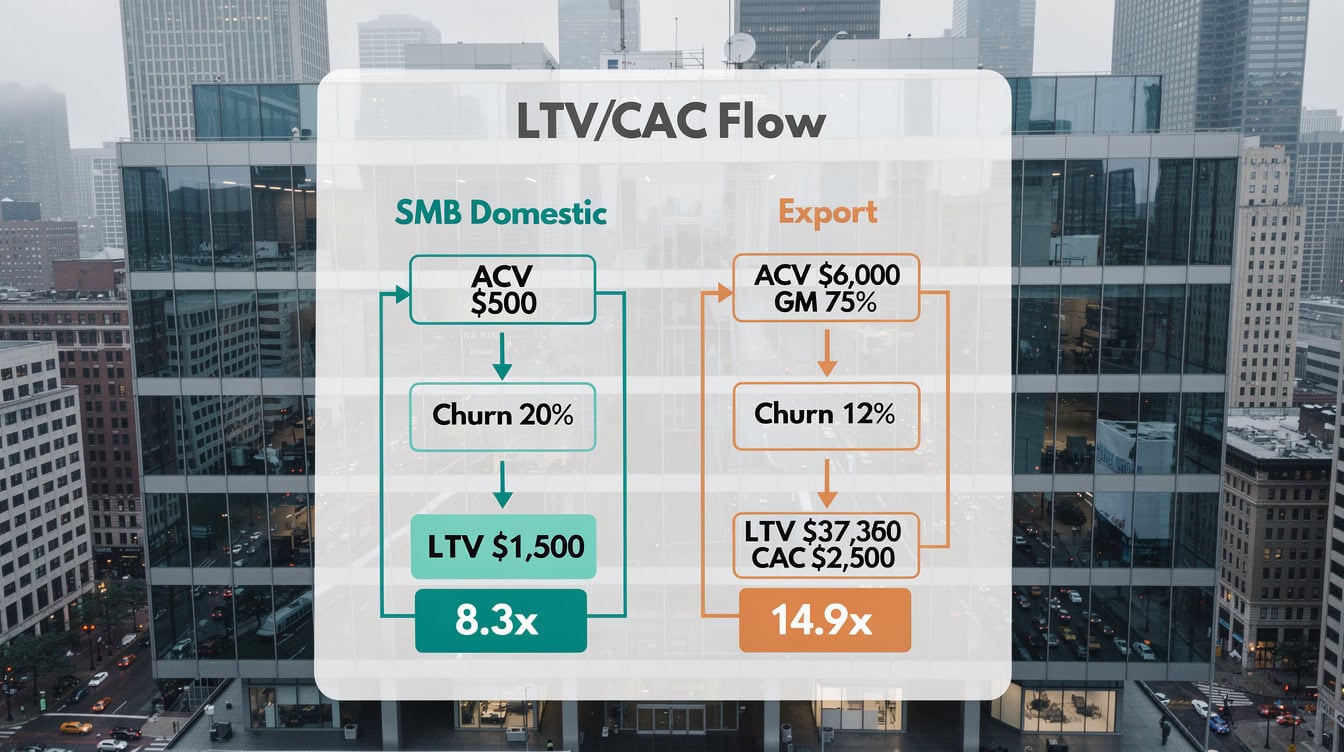
The export SaaS model generates 25x more absolute LTV per customer than the domestic SMB model, despite only 14x higher CAC, making it the superior unit economics profile.
SMB SaaS Segment: TAM, Acquisition Costs, and Monetization Challenges
The Indian SMB SaaS opportunity is real but requires patience and a different monetization playbook than Western markets. The TAM is large: 63 million MSMEs with sub-15% SaaS penetration implies 50+ million potential customers. At even $400 average ACV, that’s a $20 billion domestic TAM at full penetration.
The monetization challenge is structural. Indian SMBs have historically used pirated desktop software or manual processes, making the value proposition for paid SaaS a harder sell than in markets where software spend is normalized. Sales cycles run 30-90 days for SMB deals, and inside sales teams (phone and WhatsApp-based selling) are the dominant go-to-market motion, not self-serve. This keeps CAC higher than pure product-led growth models would suggest.
Churn is the critical risk factor. Annual churn of 15-25% means the average SMB customer stays 4-7 years in the best case, but many cohorts show 30%+ first-year churn as businesses fail or switch to cheaper alternatives. India’s MSME failure rate is significant: according to the Ministry of MSME, a substantial portion of registered MSMEs are inactive or dormant, which directly translates into involuntary churn for SaaS vendors serving this segment.
Companies that have cracked this segment, including Zoho (private, estimated $1B+ revenue), Tally Solutions, and Vyapar, have done so through aggressive freemium models, vernacular language support, and offline-to-online distribution partnerships with chartered accountants and local resellers.

Indian SMB SaaS relies on inside sales and offline reseller networks rather than self-serve, keeping CAC structurally higher than pure product-led growth models would suggest.
Horizontal SaaS Export Model: Competitive Positioning and Western Market Penetration
Export-oriented horizontal SaaS is India’s strongest investable theme for the 2026-2031 period. Indian companies have demonstrated they can build category-leading products at 40-50% lower operating cost than US peers, then sell those products to Western buyers at near-parity pricing.
Freshworks (NASDAQ: FRSH) is the clearest public market proof point. The company generated $685 million in revenue in fiscal year 2024, serves over 67,000 customers globally, and maintains gross margins above 72%. Its customer support and CRM products compete directly with Zendesk and Salesforce at 30-50% lower price points, a positioning that resonates with US SMBs and mid-market buyers facing software budget pressure.
Zoho, still private, is estimated to generate over $1 billion in annual revenue with a reported 25%+ operating margin, an extraordinary figure for a SaaS company at that scale. Zoho’s 55+ product suite and zero-debt balance sheet reflect a capital-efficient growth model that contrasts sharply with the venture-funded burn rates of US SaaS peers.
Other notable export players include Chargebee (subscription billing, raised at a $3.5B valuation), Postman (API development, valued at $5.6B), and Browserstack (software testing, valued at $4B). These companies collectively demonstrate that Indian SaaS can achieve unicorn valuations in horizontal categories without requiring India-specific market dynamics.
Competitive Landscape: Key Players by Segment
The competitive map for India SaaS splits by segment, with limited overlap between domestic SMB leaders and export-focused players.
| Company | Segment | Est. Revenue | Key Metric |
|---|---|---|---|
| Zoho | Export + Domestic | $1B+ | 25%+ operating margin |
| Freshworks | Export | $685M (FY2024) | 72% gross margin |
| Chargebee | Export | $150M+ ARR | $3.5B valuation |
| Postman | Export | $100M+ ARR | $5.6B valuation |
| Tally Solutions | Domestic SMB | $100M+ | 3M+ businesses |
| Vyapar | Domestic SMB | $20-30M ARR | 1M+ paid users |
| Khatabook | Domestic SMB | $15-25M ARR | 10M+ registered |
The domestic SMB segment is more fragmented, with dozens of vertical SaaS players in accounting, HR, inventory, and GST compliance. The GST compliance category alone has generated several well-funded companies (ClearTax, now Clear, raised over $140 million) because the regulatory complexity creates a recurring, non-discretionary use case.
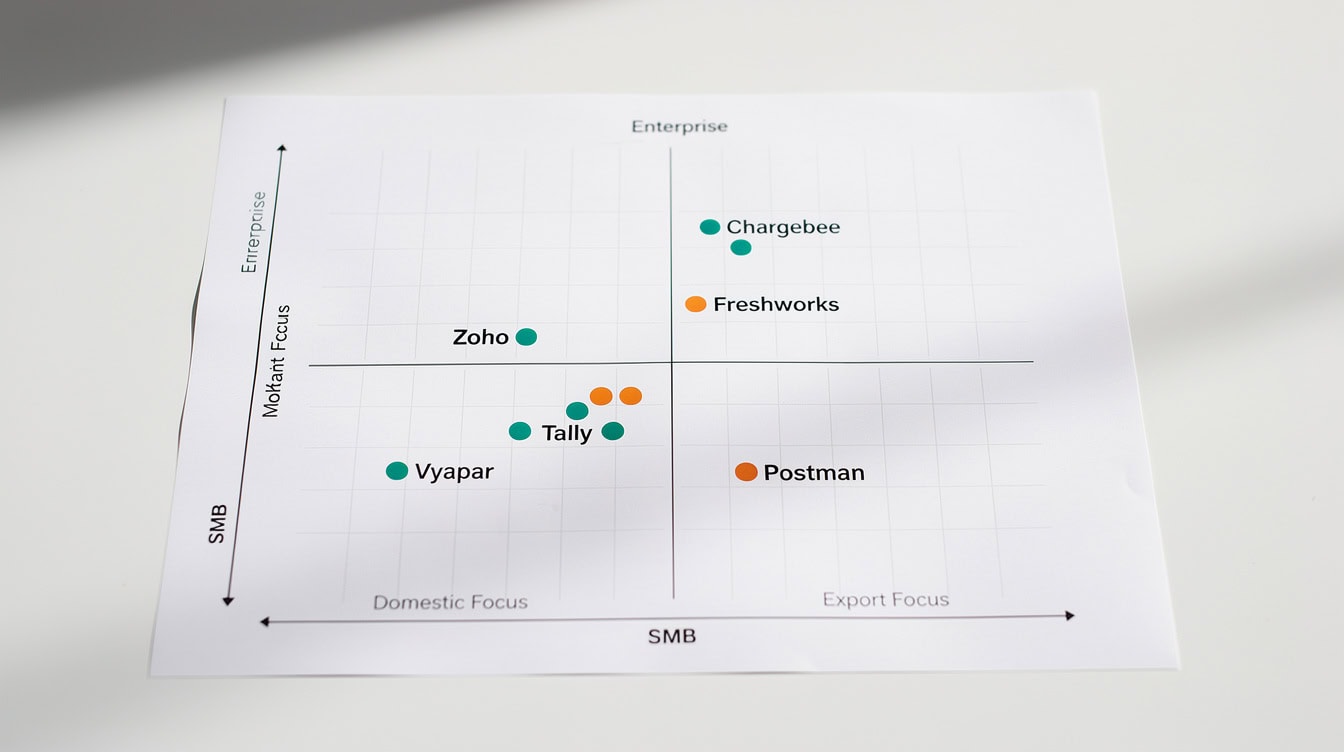
India’s SaaS competitive map shows limited overlap between domestic SMB leaders and export-focused players, suggesting two distinct strategic playbooks rather than one unified market.
Regulatory and Structural Considerations for SaaS in India
Regulatory factors materially affect SaaS business model design, pricing, and infrastructure investment in India. Investors and operators must account for three primary regulatory dimensions.
First, GST treatment: SaaS services in India attract an 18% Goods and Services Tax (GST) rate. For B2B sales, the buyer can claim input tax credit, neutralizing the cost impact. For B2C sales to individual consumers or unregistered small businesses, the 18% GST is a real cost that compresses effective margins or forces price increases. This creates a structural preference for B2B SaaS models in the Indian domestic market.
Second, data localization: The Digital Personal Data Protection Act 2023 (DPDPA) requires certain categories of personal data to be stored within India. The specific categories subject to localization are still being finalized through subordinate legislation, but the direction is clear: SaaS companies serving Indian consumers will need India-based data infrastructure, increasing hosting costs by an estimated 15-25% compared to a pure global cloud architecture.
Third, entity structure: Most Indian SaaS companies targeting export markets use a Delaware C-Corp or Singapore holding company structure with an Indian subsidiary for R&D and operations. This structure optimizes for US venture capital compatibility, ESOP issuance, and eventual US or Singapore IPO. The Reserve Bank of India’s Overseas Direct Investment regulations govern the mechanics of this structure, and compliance costs are non-trivial for early-stage companies.
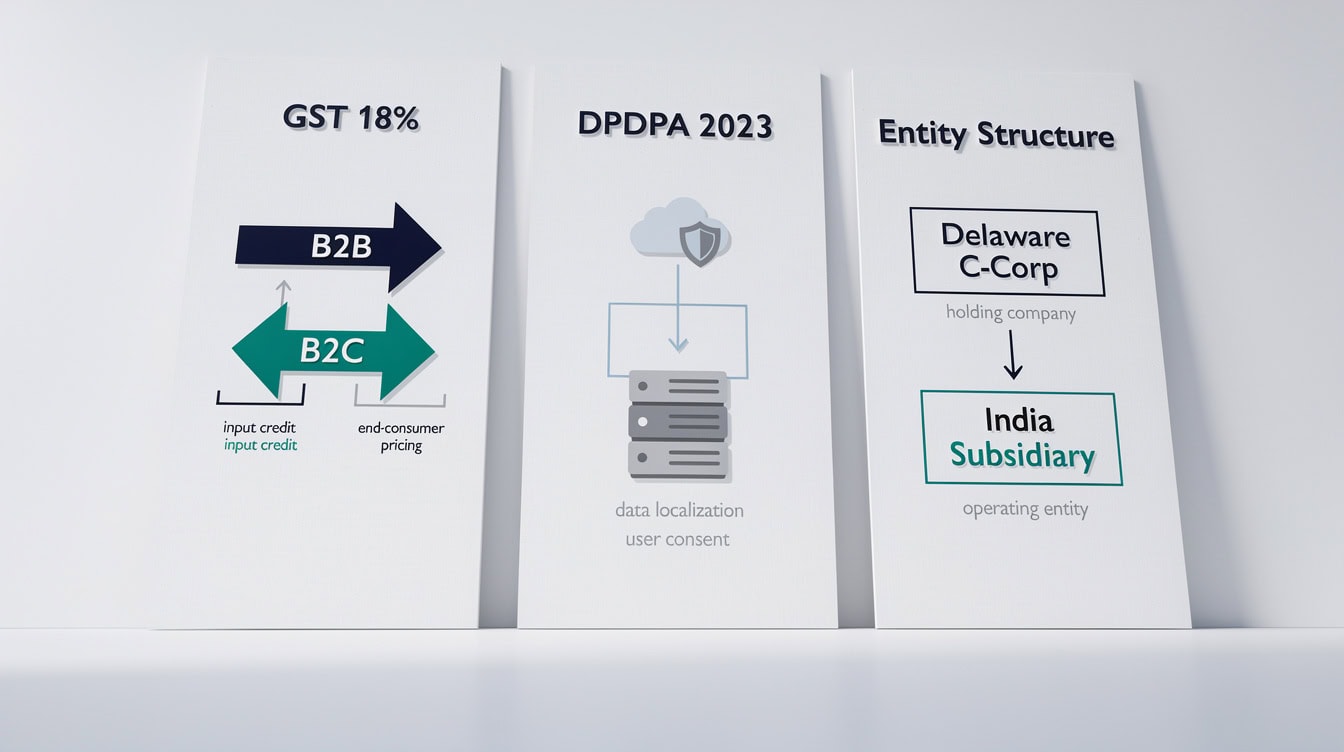
Three regulatory dimensions shape India SaaS business model design: GST at 18%, DPDPA data localization requirements, and the Delaware-to-India holding structure used by most export-focused companies.
Valuation Analysis: Indian SaaS Multiples vs. Global Benchmarks
Indian SaaS companies trade at a meaningful discount to US peers, and understanding the drivers of that discount is essential for building accurate valuation models.
Publicly listed Indian SaaS companies (primarily on US exchanges) trade at 4-8x forward revenue multiples as of 2025-2026, compared to 8-15x for comparable US SaaS companies with similar growth profiles. The discount reflects three factors: perceived execution risk in emerging markets, lower absolute revenue scale, and thinner institutional investor coverage relative to US-listed peers.
Private market valuations for Indian SaaS unicorns have compressed from 2021 peak multiples of 20-30x ARR to 8-15x ARR in 2024-2025, tracking the global SaaS multiple compression cycle. Companies with strong net revenue retention (NRR above 110%) and gross margins above 70% command the upper end of this range.
For acquirers, the valuation gap creates a strategic opportunity. A US strategic buyer acquiring an Indian SaaS company at 6x forward revenue and re-rating it to 12x on their own multiple creates immediate value, provided the product and customer base integrate cleanly. This arbitrage has driven several cross-border M&A transactions, including Salesforce’s acquisition of Mulesoft (which had significant Indian engineering operations) and Zendesk’s acquisition of Smooch.
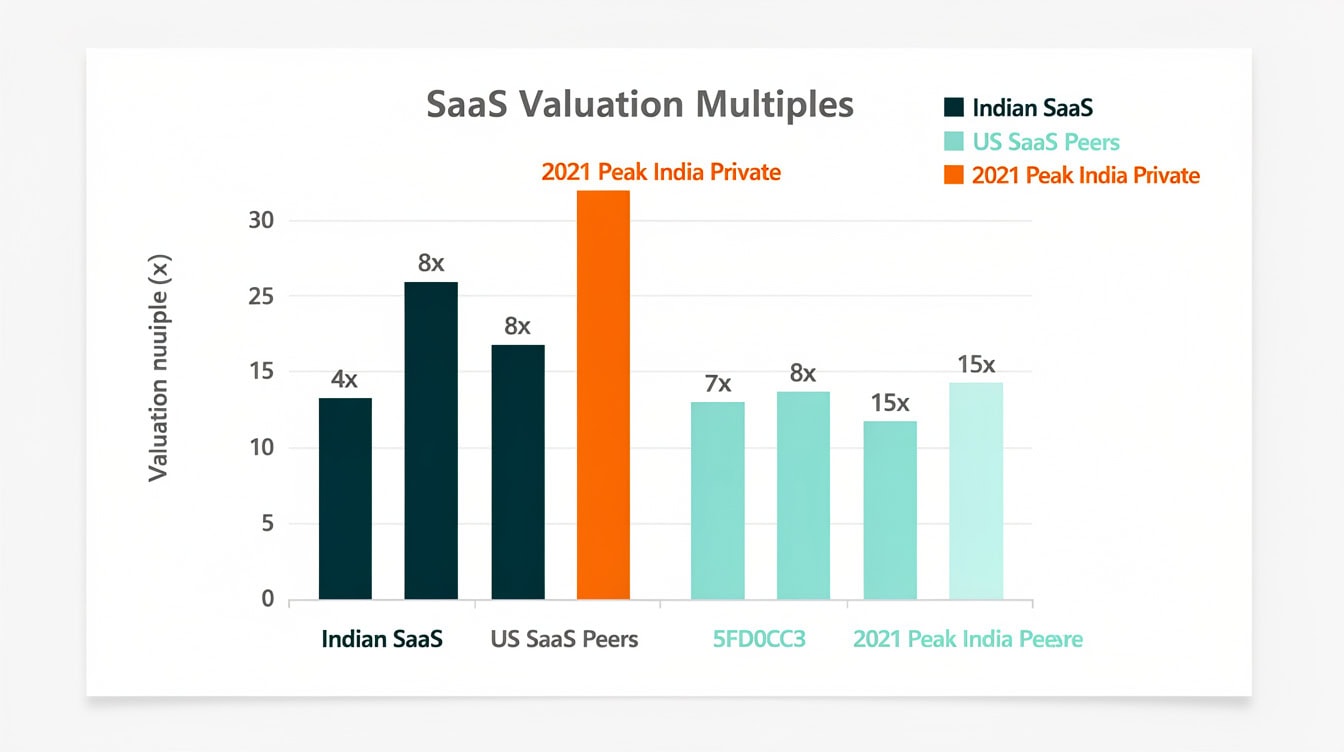
Indian SaaS companies trade at a 30-40% discount to US peers on forward revenue multiples, creating a valuation arbitrage opportunity for strategic acquirers who can re-rate acquired assets on their own multiple.
Investment Thesis: Risk Factors and Opportunity Assessment 2026-2031
The India SaaS investment thesis for 2026-2031 rests on three pillars: talent cost arbitrage sustaining margin superiority, SMB TAM expansion as digital adoption accelerates, and export market share gains in horizontal categories where Indian companies have proven product-market fit.
The primary risks are execution-related, not structural. SMB churn remains the biggest financial risk for domestic-focused investors: a 5 percentage point increase in annual churn (from 20% to 25%) reduces LTV by 20% and can turn a marginally positive unit economics profile negative. For export-focused companies, the risk is go-to-market scaling: building a US or European sales organization from India requires significant investment in local talent, and the failure rate for this motion is high among companies that attempt it before reaching $10M ARR.
M&A activity has been meaningful. Notable transactions include Zendesk’s acquisition of Cleverly (AI-powered support), Salesforce’s investment in multiple Indian SaaS companies through its venture arm, and several PE-backed roll-ups in the GST compliance and HR SaaS verticals. Deal multiples for acquired Indian SaaS companies have ranged from 4x to 12x ARR depending on growth rate, retention, and strategic fit. India’s cloud infrastructure market is growing rapidly to support this activity: Microsoft Azure, for instance, operates data center regions in Pune and Chennai, and Azure’s global infrastructure now spans more than 60 regions worldwide, giving Indian SaaS companies enterprise-grade local hosting options that reduce data sovereignty risk.
For financial modelers building India SaaS projections, the SaaS Financial Model Excel Template from EFM provides a structured framework for modeling cohort-based revenue, churn scenarios, and segment-specific unit economics. The Freemium SaaS Financial Model is particularly relevant for domestic SMB players using freemium conversion as their primary acquisition motion.
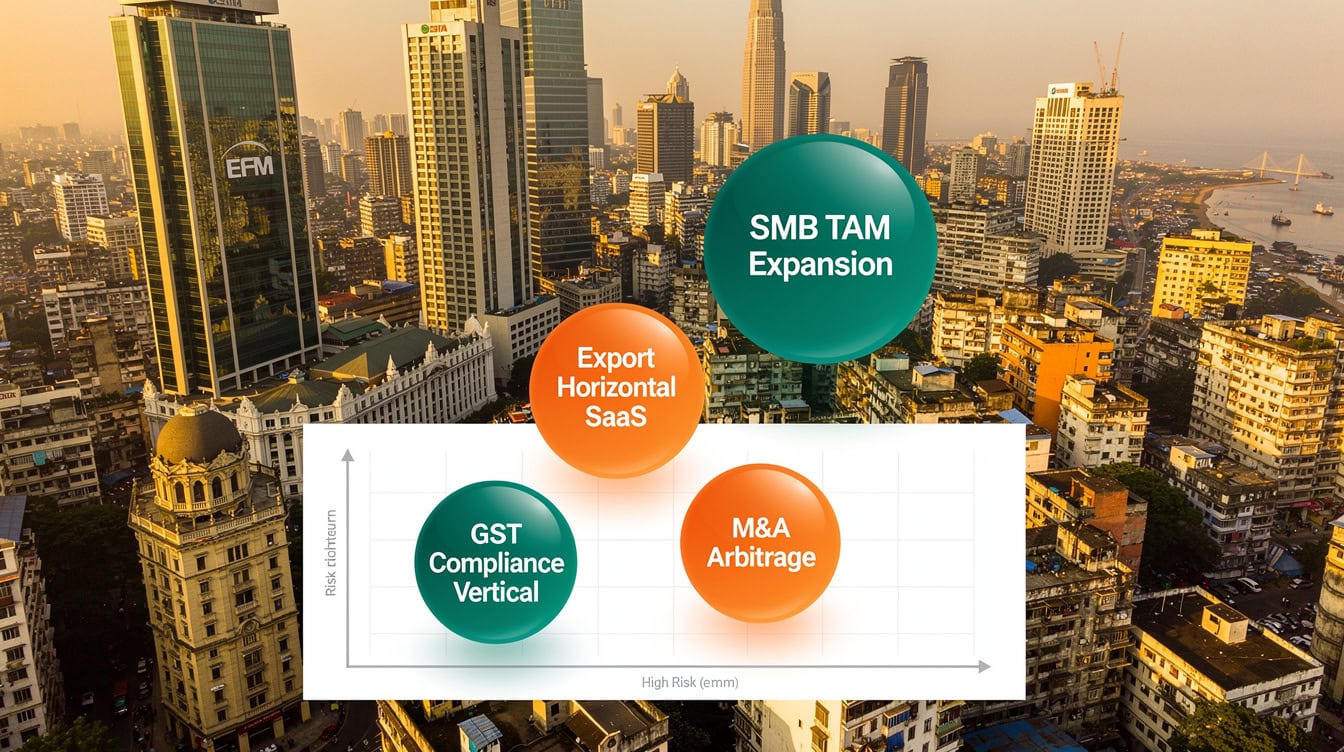
The export horizontal SaaS theme offers the best risk-adjusted return profile for 2026-2031, combining proven product-market fit with structural margin advantages and a credible M&A exit pathway.
Common Mistakes in India SaaS Financial Modeling
Five modeling errors consistently distort India SaaS valuations and investment decisions.
1. Applying US churn assumptions to Indian SMB cohorts. US SaaS benchmarks assume 5-10% annual churn for SMB. Indian SMB SaaS churn runs 15-25%. Using US benchmarks overstates LTV by 2-3x and makes unprofitable unit economics appear attractive. Fix: build India-specific churn curves using local comparable company data.
2. Ignoring the ACV ceiling in domestic markets. Many models assume Indian SMB ACVs will converge toward US levels over time. Purchasing power parity limits this convergence: Indian SMB software budgets are structurally lower, and price increases above $1,000 ACV face significant resistance. Fix: model ACV growth at 5-8% annually, not 15-20%.
3. Conflating domestic and export revenue in a single model. The two segments have different gross margins, churn rates, CAC, and growth trajectories. A blended model obscures the true economics of each. Fix: build separate P&L and cohort models for each segment, then consolidate.
4. Underestimating GST compliance costs. SaaS companies selling to unregistered Indian businesses must collect and remit 18% GST without the ability to pass it through cleanly. This creates a 3-5% effective margin drag that many early-stage models omit. Fix: model GST as a line-item cost for B2C and unregistered B2B revenue streams. When building these models in Excel, note that Excel’s IF function supports up to 64 nested levels, which is more than sufficient for even the most complex GST tiering logic you are likely to need.
5. Overstating the speed of SMB TAM penetration. The 63 million MSME figure is frequently cited as the TAM, but the addressable subset with internet access, a bank account, and willingness to pay for software is closer to 5-10 million businesses today. Fix: build a bottoms-up TAM model using internet penetration, digital payment adoption, and historical SaaS conversion rates as filters. Excel’s XLOOKUP function, which replaced VLOOKUP and can search arrays of up to 1,048,576 rows, is particularly useful for mapping large MSME classification datasets when building these bottoms-up models.
The Monthly Recurring Revenue SaaS Financial Model and the SaaS Financial Model Bundle both include segment-level modeling frameworks that address these common errors.
Frequently Asked Questions
What is the projected size of India’s SaaS market by 2031?
India’s SaaS market is projected to reach approximately $50 billion by 2031, growing from an estimated $18-20 billion in 2026 at a CAGR of 20-22%. This projection reflects continued growth in both the domestic SMB segment (estimated $15 billion by 2031) and the export-oriented horizontal SaaS segment (estimated $35 billion by 2031). The export segment is growing faster because Indian companies have demonstrated product-market fit with Western buyers and can scale revenue without proportional headcount increases, given the talent cost advantage. Investors should note that these projections assume continued global SaaS adoption and no major regulatory disruption to cross-border data flows.
How do LTV/CAC ratios compare between Indian SMB SaaS and export SaaS companies?
Indian SMB SaaS companies typically achieve LTV/CAC ratios of 6-10x, with CAC of $80-$250 and LTV of $800-$2,000 based on ACVs of $200-$800 and 60% gross margins. Export-focused companies achieve LTV/CAC ratios of 12-18x, with CAC of $800-$4,000 and LTV of $15,000-$50,000 based on ACVs of $3,000-$15,000 and 75% gross margins. The SaaS Rule of 40 (growth rate plus profit margin should exceed 40%) is a useful benchmark: leading Indian export SaaS companies like Freshworks and Zoho meet or exceed this threshold, while many domestic SMB players fall short due to high churn compressing effective growth.
What GST rate applies to SaaS services in India, and how does it affect pricing?
SaaS services in India attract an 18% GST rate under the Information Technology Software Services category. For B2B sales where the buyer is a registered GST entity, the buyer claims input tax credit, making the GST cost-neutral. For B2C sales or sales to unregistered small businesses, the 18% GST is a real cost that either compresses the vendor’s effective margin or increases the buyer’s total cost. Most Indian SaaS companies targeting the SMB segment price exclusive of GST and add it at checkout, but this creates friction in the sales process. Companies with more than 50% of revenue from unregistered buyers should model a 3-5% effective margin drag from GST administration and non-recoverable tax costs.
What valuation multiples do Indian SaaS companies trade at compared to US peers?
Indian SaaS companies listed on US exchanges trade at 4-8x forward revenue multiples, compared to 8-15x for US SaaS companies with comparable growth profiles. The discount reflects emerging market risk premium, lower absolute scale, and thinner institutional coverage. Private market multiples for Indian SaaS unicorns compressed from 20-30x ARR at the 2021 peak to 8-15x ARR in 2024-2025. Companies with net revenue retention (NRR) above 110% and gross margins above 70% command the upper end of the private market range. For acquirers, the 30-40% public market discount to US peers creates a valuation arbitrage: buying at 6x and re-rating to 10-12x post-integration is a credible value creation thesis for strategic buyers with existing SaaS platforms.
What are the main risks in the Indian SMB SaaS segment that financial models must capture?
Four risks dominate the Indian SMB SaaS risk profile. First, structural churn: annual churn of 15-25% means the average customer cohort loses 50% of its value within 3-4 years, requiring continuous new customer acquisition just to maintain revenue. Second, ACV compression: competitive pressure from free tools (Google Workspace free tier, WhatsApp Business) limits pricing power. Third, MSME failure rates: a significant portion of Indian MSMEs fail or become dormant within 3 years, creating involuntary churn that no retention program can address. Fourth, distribution costs: the inside sales and reseller models required to reach Indian SMBs are expensive relative to the ACV, keeping CAC payback periods above 18 months for most players. Financial models should stress-test all four factors with scenario analysis.
Which Indian SaaS companies are the best benchmarks for financial modeling?
For export-focused horizontal SaaS, Freshworks (NASDAQ: FRSH) is the best public market benchmark: $685 million in FY2024 revenue, 72% gross margins, and detailed quarterly disclosures make it the most transparent Indian SaaS comparable. Zoho provides a private market benchmark for capital-efficient growth, with estimated $1 billion+ revenue and 25%+ operating margins. For domestic SMB SaaS, Tally Solutions (accounting software, 3 million+ business users) and Vyapar (1 million+ paid users) are the most relevant benchmarks, though both are private with limited public financial disclosure. Chargebee ($150M+ ARR, $3.5B valuation) and Postman ($100M+ ARR, $5.6B valuation) benchmark the export SaaS unicorn tier.
How does India’s Digital Personal Data Protection Act 2023 affect SaaS business models?
The Digital Personal Data Protection Act 2023 (DPDPA) introduces data localization requirements for certain categories of personal data processed in India. The specific categories subject to mandatory local storage are being defined through subordinate rules, but the direction is clear: SaaS companies processing Indian consumer data will need India-based cloud infrastructure for at least some data categories. This increases hosting costs by an estimated 15-25% compared to a pure global cloud architecture, because Indian AWS, Azure, and GCP regions carry higher per-unit costs than US or European regions. For export-focused SaaS companies processing only non-Indian user data, the DPDPA impact is minimal. For domestic SMB SaaS companies, the compliance investment is real and should be modeled as a 2-4% revenue cost for companies above the DPDPA applicability threshold.
Conclusion
India’s SaaS market offers two distinct investment opportunities through 2031: a domestic SMB segment with massive TAM but challenging unit economics, and a horizontal export segment with proven global product-market fit and US-comparable margins. The financial case for the export segment is stronger on a per-dollar-invested basis, but the SMB segment offers asymmetric upside if digital adoption accelerates faster than current penetration rates suggest. Both segments require India-specific financial models that account for local churn rates, GST treatment, ACV ceilings, and the dual holding company structures most companies use.
I recommend downloading the SaaS Financial Model Bundle from EFM to build detailed projections for Indian SaaS investments, including segment-level cohort analysis, churn scenario modeling, and valuation multiple sensitivity tables calibrated to the benchmarks discussed in this article.
























































