
0 ITEMS

Excel Rental Property Calculator: 6 Key Metrics Built
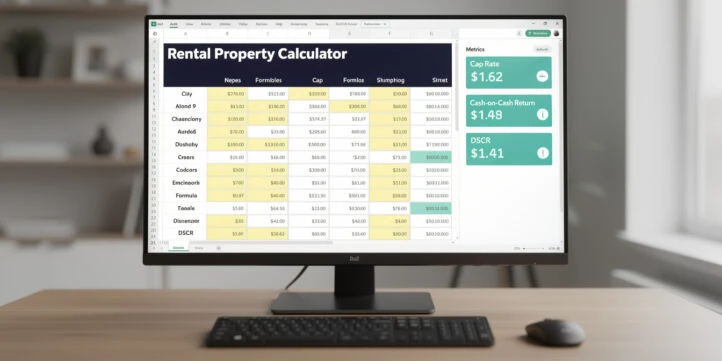
An Excel rental property calculator turns a raw deal into a decision in minutes, but only if you build it with the right formulas and structure from the start.
Key Takeaways
- A complete Excel rental property calculator needs at least 6 sections: property details, acquisition costs, financing, income, operating expenses, and a metrics summary.
- The PMT function calculates your exact monthly mortgage payment:
=PMT(rate/12, term_months, -loan_amount)gives a dollar figure in one cell. - Cap rate (net operating income divided by property value) typically ranges from 4% to 10% depending on market and asset class, according to the National Council of Real Estate Investment Fiduciaries.
- A debt service coverage ratio (DSCR) below 1.0 means the property cannot cover its own mortgage from rental income alone.
- Residential rental properties depreciate over 27.5 years under IRS rules, which creates a non-cash tax deduction you can model directly in Excel.
- Sensitivity analysis using Excel’s Data Table feature lets you test 25+ rent and vacancy combinations in a single two-variable table without writing extra formulas.
- Pre-built templates from eFinancialModels include institutional-grade waterfall return structures that would take 20+ hours to build from scratch.
Essential Components of a Rental Property Calculator Spreadsheet
Every reliable Excel rental property calculator shares the same six-section architecture: inputs, acquisition, financing, income, expenses, and a metrics dashboard. Separating inputs from calculations prevents the most common modeling errors and makes the file reusable across dozens of deals.
Here are the six tabs or sections every calculator needs:
- Property Details: address, property type, purchase price, and closing cost percentage.
- Acquisition Costs: down payment, closing costs, and initial repair budget.
- Financing Terms: loan amount, interest rate, amortization period, and loan type.
- Income Assumptions: gross monthly rent, other income (laundry, parking), and vacancy rate.
- Operating Expenses: property management, insurance, taxes, maintenance, and capital expenditure reserve.
- Metrics Summary: cash flow, cap rate, cash-on-cash return, DSCR, IRR, and NPV.
Keep all user-editable inputs in yellow-shaded cells in a dedicated Input section. Lock every formula cell. This structure, recommended in financial modeling best practices published by the CFA Institute, prevents accidental overwrites and makes auditing straightforward.
Building Your Basic Excel Rental Property Calculator: Core Formulas
The foundation of any Excel rental property calculator is four formulas that feed every metric downstream. Get these right and the rest of the model builds itself.
Monthly Mortgage Payment: PMT Function
The PMT function (short for Payment) calculates the fixed monthly payment on a fully amortizing loan. Its syntax is:
=PMT(rate, nper, pv)rate= annual interest rate divided by 12 (monthly rate)nper= total number of monthly payments (years × 12)pv= present value, entered as a negative number (the loan amount you receive)
Example: A $160,000 loan at 7% annual interest over 30 years:
=PMT(7%/12, 360, -160000)Result: $1,064.48 per month
Excel’s PMT function is part of a financial functions library that includes over 50 built-in financial formulas. As Microsoft’s PMT function documentation notes, Excel supports this function natively in all versions from Excel 2007 onward.
Net Operating Income (NOI)
NOI (net operating income) is gross rental income minus all operating expenses, before mortgage payments. In Excel:
=B5*(1-B6) - SUM(C10:C16)Where B5 = annual gross rent, B6 = vacancy rate (e.g., 0.07 for 7%), and C10:C16 = your expense range.
Cap Rate
Cap rate (capitalization rate) expresses NOI as a percentage of property value. It lets you compare properties regardless of financing:
=NOI_cell / Purchase_Price_cellFormat the result as a percentage. A cap rate between 5% and 8% is typical for residential rentals in most U.S. markets, according to the National Council of Real Estate Investment Fiduciaries.
Cash-on-Cash Return
Cash-on-cash return measures annual pre-tax cash flow as a percentage of total cash invested (down payment plus closing costs plus repairs):
=Annual_Cash_Flow_cell / Total_Cash_Invested_cellA result above 8% is generally considered strong for a single-family rental, though this benchmark varies by market.
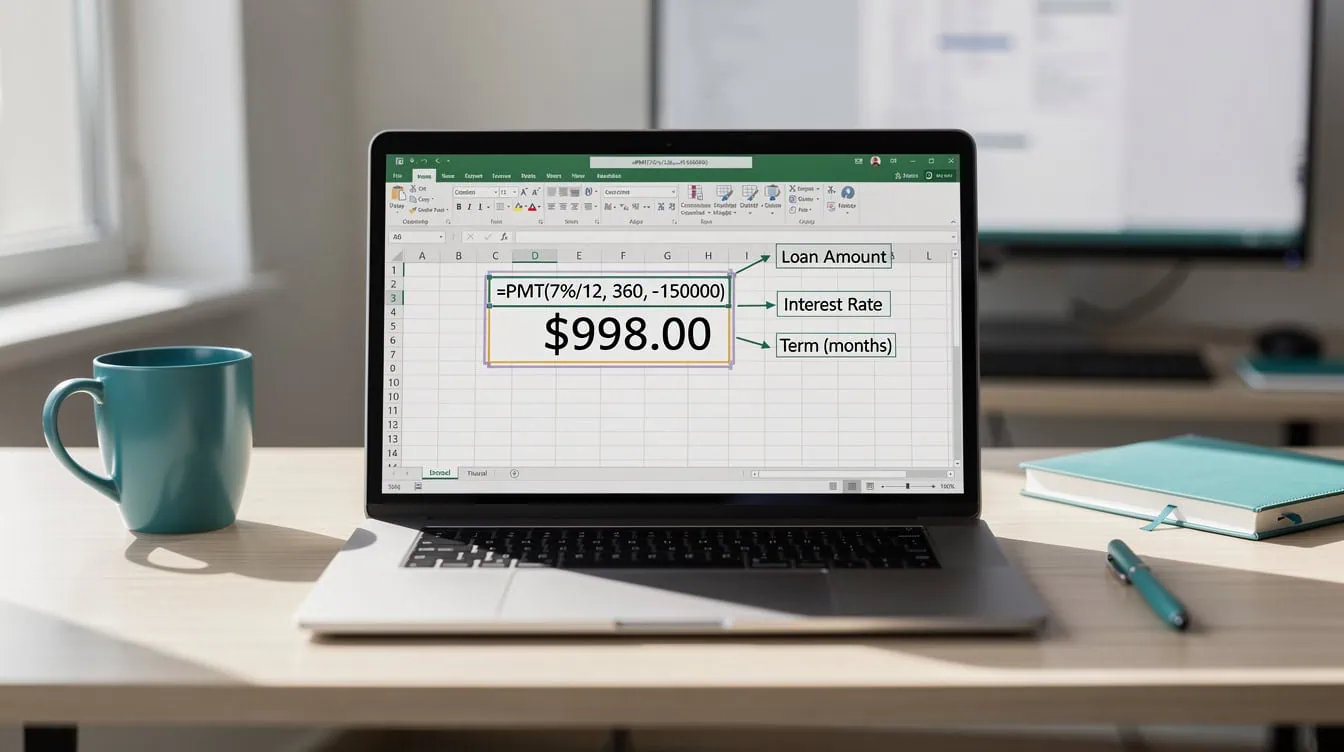
The PMT function returns the exact monthly mortgage payment in a single cell, feeding every downstream cash flow calculation automatically.
Worked Example: Analyzing a $200,000 Rental Property
Here’s the math for a real deal so you can see every formula in context.
Inputs:
- Purchase price: $200,000
- Down payment: 25% = $50,000
- Loan amount: $150,000 at 7% for 30 years
- Gross monthly rent: $1,800
- Vacancy rate: 7%
- Annual operating expenses: $6,000 (taxes $2,400, insurance $1,200, management $1,440, maintenance $960)
Step 1: Monthly mortgage payment=PMT(7%/12, 360, -150000) = $998.00/month = $11,976/year
Step 2: Effective gross income
$1,800 × 12 × (1 – 0.07) = $20,088/year
Step 3: NOI
$20,088 – $6,000 = $14,088/year
Step 4: Cap rate
$14,088 / $200,000 = 7.04%
Step 5: Annual cash flow
$14,088 – $11,976 = $2,112/year
Step 6: Cash-on-cash return
$2,112 / $50,000 (down payment only, simplified) = 4.22%
Step 7: DSCR
DSCR (debt service coverage ratio) = NOI / Annual Debt Service = $14,088 / $11,976 = 1.18
A DSCR of 1.18 means the property generates 18% more income than needed to cover the mortgage. Most lenders require a minimum DSCR of 1.20 to 1.25 for investment property loans, according to the Federal Reserve’s guidance on commercial real estate underwriting standards.
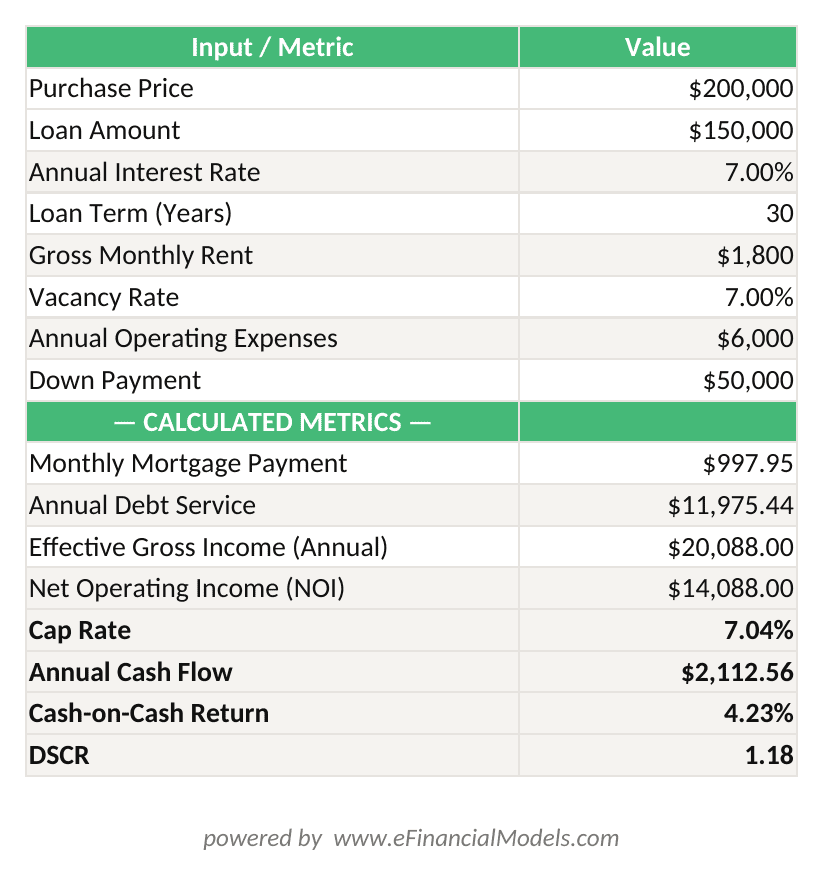
All six key metrics calculated from 8 inputs: purchase price $200,000, loan $150,000 at 7% over 30 years, rent $1,800/month, vacancy 7%, expenses $6,000/year.
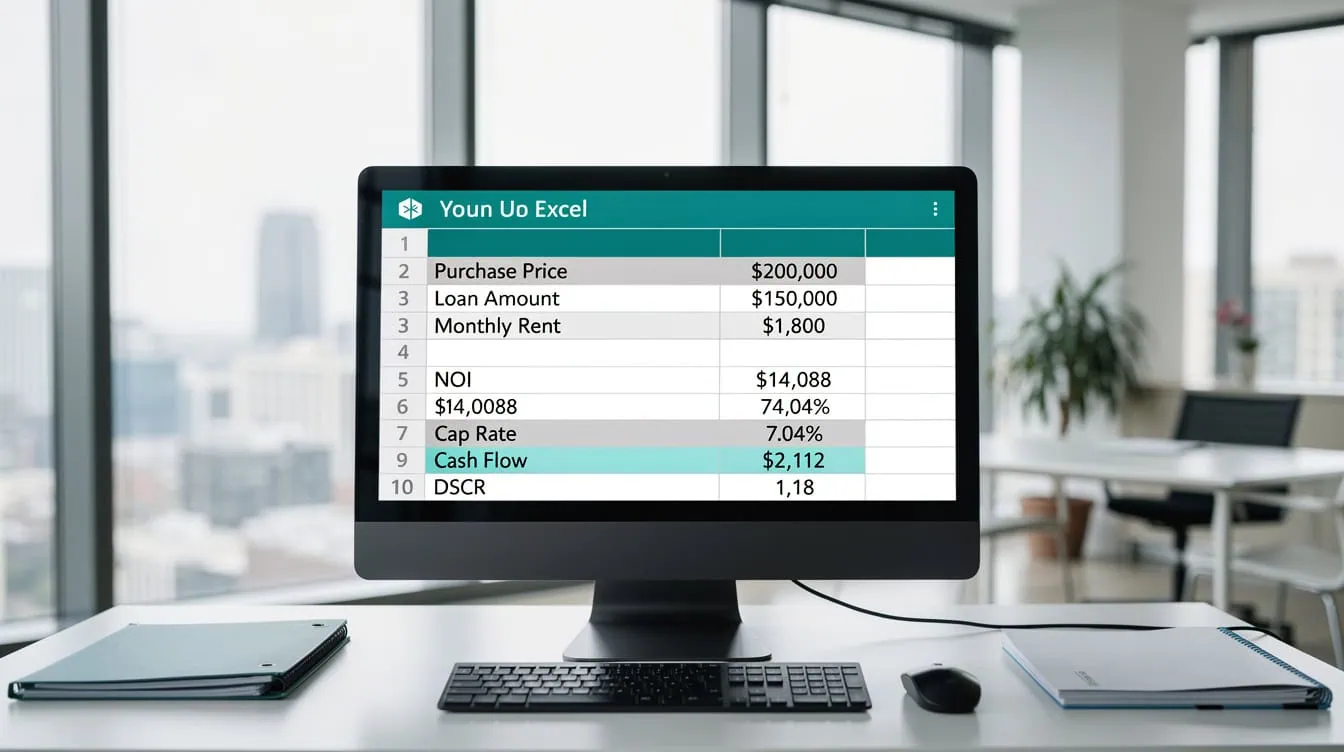
A DSCR of 1.18 on this $200,000 property sits just below the 1.20 threshold most lenders require, signaling a need to renegotiate price or increase the down payment.
Intermediate Features: Multi-Year Projections and Escalation Factors
A single-year snapshot misses how compounding rent growth and expense inflation reshape returns over time. Build a 10-year projection table to see the full picture.
Set up a row for each year (rows 20 to 29) with these column formulas:
- Gross Rent:
=B20*(1+$B$3)where B3 holds your annual rent growth assumption (e.g., 3%) - Vacancy Loss:
=C20*$B$4where B4 = vacancy rate - Operating Expenses:
=E20*(1+$B$5)where B5 = expense inflation rate (e.g., 2.5%) - NOI:
=D20-F20 - Debt Service: Fixed (PMT result does not change for a fixed-rate loan)
- Cash Flow:
=G20-H20
U.S. multifamily rents grew at an average of 3.1% annually over the prior decade, according to the Urban Land Institute’s 2023 Emerging Trends in Real Estate report, making a 3% escalation assumption reasonable for conservative underwriting.
Once your 10-year cash flow column is complete, calculate IRR (internal rate of return, the annualized return that makes NPV equal zero) with:
=IRR(B19:B29)Where B19 = your initial equity outlay as a negative number and B20:B29 = annual cash flows. Include a projected sale price in year 10 to capture appreciation. Excel’s IRR function can evaluate a series of up to 29 cash flow periods, as documented in Microsoft’s IRR function reference. This is more than sufficient for a standard 10- or 20-year rental property hold analysis.
Advanced Spreadsheet Techniques: Sensitivity Analysis and Scenario Planning
Sensitivity analysis tests how your key output (cash-on-cash return or IRR) changes when two input variables shift simultaneously. Excel’s Data Table feature (found under Data > What-If Analysis) automates this without any extra formulas.
To build a two-variable sensitivity table for cash-on-cash return vs. rent and vacancy:
- Place your cash-on-cash return formula in a corner cell (e.g., G2).
- List rent values across row 2 (e.g., $1,600, $1,700, $1,800, $1,900, $2,000).
- List vacancy rates down column G (e.g., 5%, 7%, 10%, 12%, 15%).
- Select the full table range, go to Data > What-If Analysis > Data Table.
- Set Row Input Cell = your rent cell, Column Input Cell = your vacancy cell.
- Click OK. Excel populates all 25 combinations instantly.
Color-code results with conditional formatting: red for cash-on-cash below 4%, yellow for 4-7%, green for 7%+. This gives you a heat map of deal viability at a glance.
Scenario Comparison Table
| Scenario | Rent | Vacancy | NOI | Cash Flow | CoC Return |
|---|---|---|---|---|---|
| Optimistic | $2,000 | 5% | $16,800 | $4,824 | 9.6% |
| Base Case | $1,800 | 7% | $14,088 | $2,112 | 4.2% |
| Pessimistic | $1,600 | 12% | $10,848 | -$1,128 | -2.3% |
The pessimistic scenario shows negative cash flow, which means you’d need reserves to cover the shortfall. Knowing this before you close is the entire point of building the model.
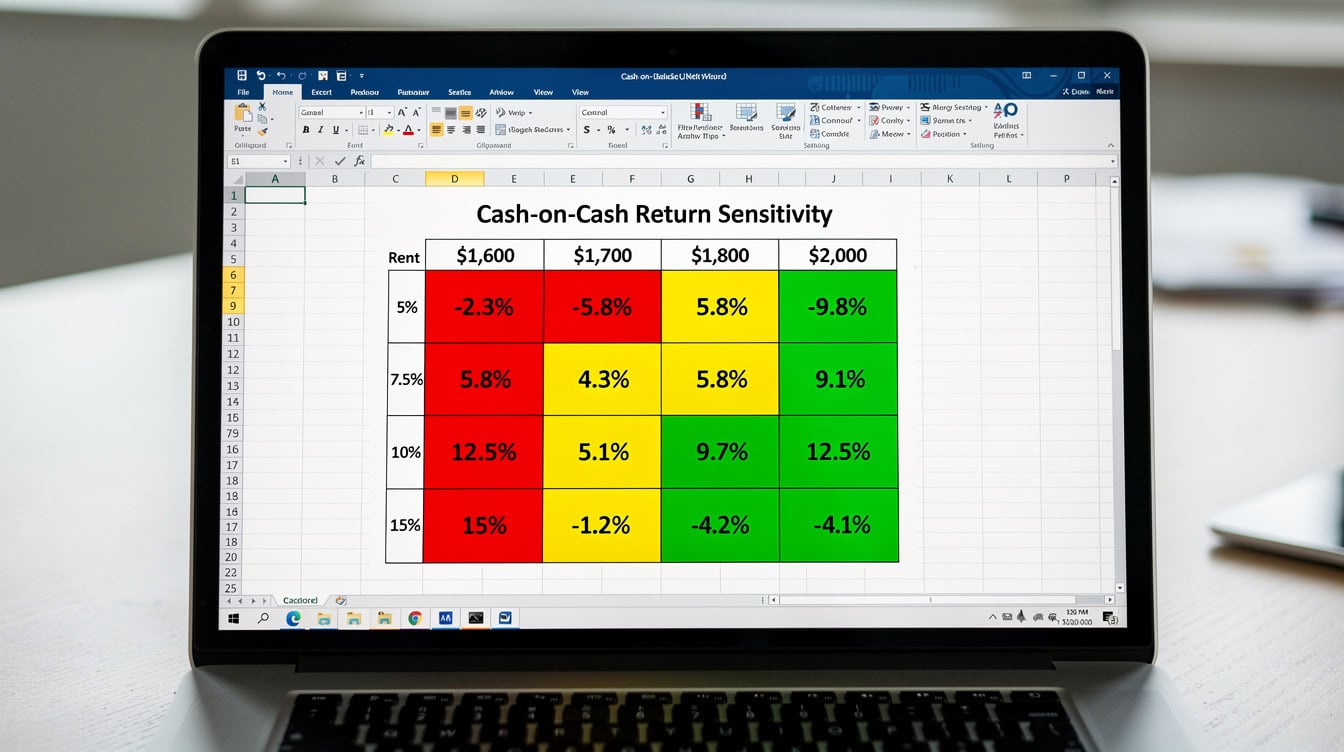
Color-coded sensitivity tables reveal at a glance which rent and vacancy combinations produce viable returns, turning a 25-scenario analysis into a one-second decision.
Automating Tax Calculations and Depreciation Schedules
Depreciation is a non-cash deduction that reduces your taxable income without reducing your actual cash flow. The IRS requires residential rental property to be depreciated over 27.5 years using the straight-line method (IRS Publication 527). Commercial rental property depreciates over 39 years.
For a $200,000 property where the land value is $30,000 (land is not depreciable):
- Depreciable basis = $200,000 – $30,000 = $170,000
- Annual depreciation = $170,000 / 27.5 = $6,182/year
In Excel, enter this formula in your tax section:
=(Purchase_Price - Land_Value) / 27.5To calculate after-tax cash flow, subtract the tax benefit from your tax liability:
Taxable Income = NOI - Depreciation - Mortgage Interest
Tax Liability = Taxable Income * Marginal_Tax_Rate
After-Tax Cash Flow = Pre-Tax Cash Flow - Tax Liability
Mortgage interest in year N comes from your amortization schedule. Use Excel’s IPMT function to extract it. Excel’s IPMT function returns the interest payment for a given period of an investment and accepts 5 to 6 arguments, per Microsoft’s IPMT function reference. This makes it straightforward to isolate the interest portion of any monthly payment:
=IPMT(7%/12, payment_number, 360, -150000)Sum 12 monthly IPMT values to get annual interest for each projection year.
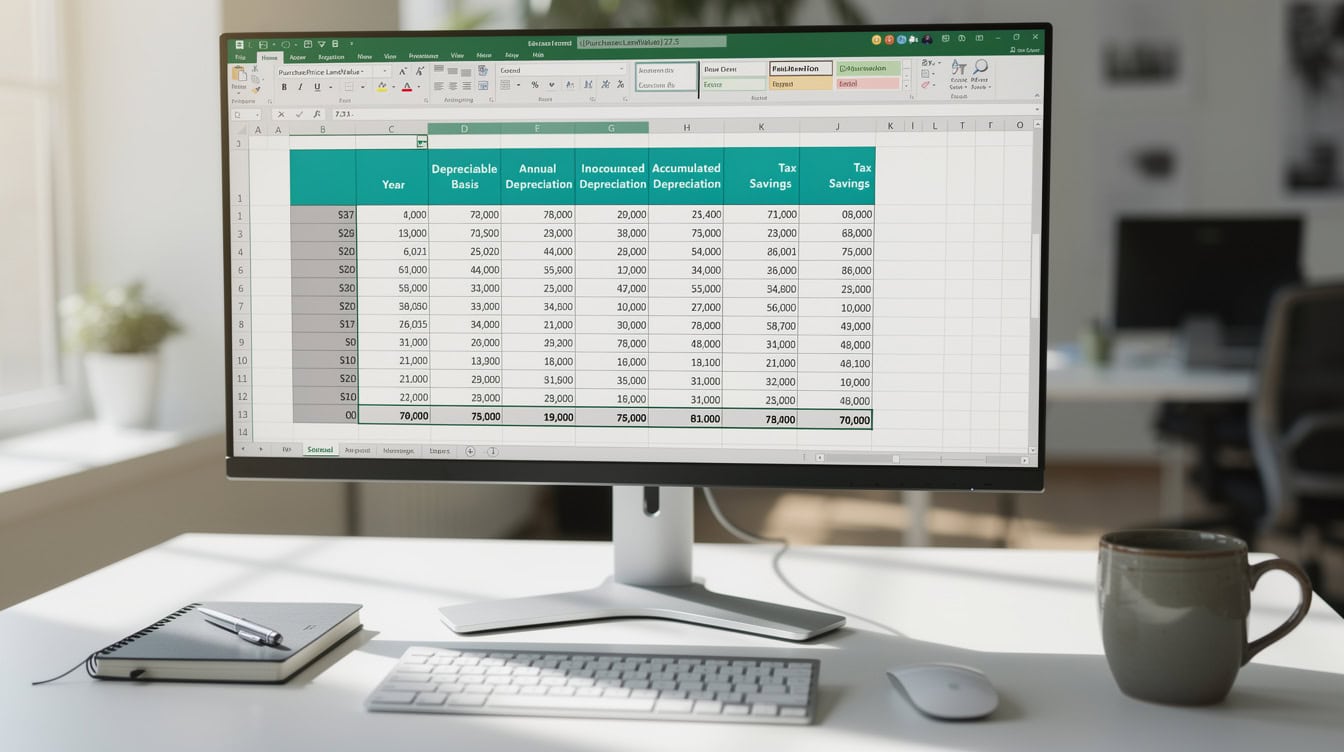
At a 24% marginal tax rate, the $6,182 annual depreciation deduction on a $170,000 depreciable basis saves $1,484 in taxes each year without reducing actual cash flow.
Common Excel Errors in Rental Property Analysis and How to Fix Them
Five mistakes appear in nearly every investor-built rental property spreadsheet. Each one distorts your numbers enough to turn a bad deal into a seemingly good one.
1. Hardcoding values instead of using cell references.
Typing =1800*12*0.93 directly into a formula means you must hunt down every instance when assumptions change. Fix: put every assumption in a dedicated input cell and reference it everywhere with $B$5 absolute references.
2. Ignoring vacancy and credit loss.
Using 100% occupancy inflates income by 5-10% in most markets. The U.S. Census Bureau’s Rental Housing Finance Survey reports a national average vacancy rate of approximately 6-7% for single-family rentals. Always apply a vacancy factor.
3. Underestimating operating expenses.
Investors routinely budget 25-30% of gross rent for expenses, but the actual figure for older properties often reaches 40-50% when capital expenditure reserves are included. Use the 50% rule as a quick sanity check: if expenses exceed half of gross rent, the deal needs scrutiny.
4. Forgetting capital expenditure reserves.
Roof, HVAC, and appliance replacements are not annual expenses but they are real costs. Budget 5-10% of gross rent annually into a CapEx reserve line item.
5. Circular references in cash flow formulas.
If your interest expense cell references a cell that references it back, Excel will either error or iterate incorrectly. Fix: build your amortization schedule in a separate tab and pull values into the main model with direct cell references.

Ignoring vacancy alone inflates projected income by 6-7%, enough to make a marginal deal look profitable on paper.
From Template to Custom Model: Making Your Calculator Reusable
A reusable Excel rental property calculator follows three design rules: all inputs on one sheet, all calculations on separate sheets, and all outputs on a summary dashboard. This input-calculation-output (ICO) structure is the standard recommended by financial modeling practitioners.
To make your model work across multiple properties without rebuilding it:
- Use named ranges (Formulas > Name Manager) for key inputs like
PurchasePrice,LoanRate, andVacancyRate. Named ranges make formulas readable and reduce reference errors. - Add a property selector dropdown (Data > Data Validation > List) that switches between saved property scenarios using INDEX/MATCH.
- Protect formula sheets with a password (Review > Protect Sheet) so collaborators can only edit yellow input cells.
For investors analyzing more than 3 properties simultaneously, a portfolio-level investment model that consolidates individual property outputs into a single dashboard saves significant time. You can also use the NPV, IRR, and Payback Calculator to cross-check your IRR calculations independently.

The ICO structure lets you analyze a new property by changing only the yellow input cells, with every formula and output updating automatically.
Frequently Asked Questions
What Excel formula calculates monthly mortgage payments for a rental property?
The PMT function handles this directly. The syntax is =PMT(annual_rate/12, years*12, -loan_amount). For a $150,000 loan at 7% over 30 years, you’d enter =PMT(7%/12, 360, -150000), which returns $998.00 per month. The negative sign on the loan amount is required because Excel treats the loan as a cash inflow to you; the payment is an outflow. Always divide the annual rate by 12 to convert it to a monthly rate, and multiply years by 12 to get total payment periods. Skipping either step produces a wildly incorrect result.
What is a good cap rate for a rental property, and how do I calculate it in Excel?
Cap rate equals NOI divided by property value, entered in Excel as =NOI_cell/PurchasePrice_cell. A cap rate between 5% and 8% is typical for residential rentals in most U.S. markets, while commercial properties in secondary markets can reach 8-10%. Lower cap rates (3-5%) appear in high-demand urban markets like New York or San Francisco where appreciation expectations are higher. The National Council of Real Estate Investment Fiduciaries tracks cap rates by property type and geography quarterly, making it a reliable benchmark source for your spreadsheet assumptions.
How do I model vacancy rate in an Excel rental property calculator?
Apply vacancy as a percentage reduction to gross rent: =GrossAnnualRent * (1 - VacancyRate). If your gross rent is $21,600 per year and your vacancy rate is 7%, effective gross income is $21,600 × 0.93 = $20,088. The U.S. Census Bureau’s American Housing Survey reports national single-family rental vacancy rates averaging 6-7%, so a 7% assumption is conservative and defensible. For markets with tight supply, you might use 5%. For older properties or weaker markets, use 10-12%. Always run your sensitivity table across at least three vacancy scenarios before making a purchase decision.
What is DSCR and how do I calculate it in my spreadsheet?
DSCR stands for debt service coverage ratio. It measures how many times your NOI covers your annual mortgage payment. The formula is =NOI / AnnualDebtService. A DSCR of 1.0 means the property exactly breaks even on debt coverage. Most conventional lenders require a minimum DSCR of 1.20 to 1.25 for investment property loans, meaning NOI must exceed debt service by at least 20-25%. In the worked example above, NOI of $14,088 divided by debt service of $11,976 gives a DSCR of 1.18, which is slightly below the typical lender threshold and would likely require a larger down payment or a lower purchase price to qualify for financing.
How does depreciation reduce taxes in a rental property model?
Depreciation is a non-cash IRS deduction that reduces your taxable rental income without reducing your actual cash flow. For residential rental property, the IRS requires straight-line depreciation over 27.5 years (IRS Publication 527). If your depreciable basis is $170,000, your annual deduction is $170,000 / 27.5 = $6,182. At a 24% marginal tax rate, that deduction saves $6,182 × 0.24 = $1,484 in taxes each year. In Excel, model this as a separate line in your tax section: =(PurchasePrice - LandValue) / 27.5. Subtract this from NOI before applying your tax rate to get taxable income, then subtract the resulting tax from pre-tax cash flow to get after-tax cash flow.
Can I use Excel’s IRR function for rental property analysis?
Yes. IRR (internal rate of return) is the annualized return that makes the net present value of all cash flows equal zero. It accounts for the time value of money, making it more accurate than simple cash-on-cash return for multi-year holds. In Excel, enter your initial equity investment as a negative number in cell B1, then list annual cash flows in B2 through B11 for a 10-year hold. Include the projected net sale proceeds in year 10. Then enter =IRR(B1:B11). A result above 12-15% is generally considered strong for a leveraged rental property, though your target IRR should reflect your cost of capital and risk tolerance. The Investment Return Monte Carlo Simulation template extends this analysis with probabilistic scenario modeling.
What operating expense categories should every rental property calculator include?
A comprehensive rental property calculator should include at least 8 expense categories: property taxes, insurance, property management fees (typically 8-12% of collected rent), routine maintenance, capital expenditure reserve (5-10% of gross rent), landscaping and snow removal, utilities paid by the landlord, and accounting or legal fees. Many first-time investors omit CapEx reserves entirely, which understates true expenses by $1,500 to $3,000 per year on a typical single-family rental. The 50% rule provides a quick sanity check: if your total operating expenses (excluding mortgage) exceed 50% of gross rent, scrutinize each line item carefully before proceeding.

A complete Excel rental property calculator gives investors the same analytical depth as institutional underwriting tools, without the software subscription cost.
Conclusion
Building an Excel rental property calculator from scratch gives you complete control over every assumption, but it requires getting the formula architecture right before you analyze a single deal. Start with the six-section structure, implement PMT for mortgage payments, build your NOI and cap rate formulas, then layer in multi-year projections and sensitivity tables as your confidence grows.
I recommend downloading the NPV, IRR, and Payback Calculator from eFinancialModels to cross-check your IRR calculations, or the full real estate investment model if you want a professionally structured template with waterfall returns, depreciation schedules, and sensitivity dashboards already built in. Either option saves you 10 to 20 hours of formula work and eliminates the structural errors that distort deal analysis.
























































