
0 ITEMS

Upstream Oil & Gas Project Finance Model Excel | 20-Year Well Forecast, DSCR, NPV10 & IRR
Evaluate upstream oil and gas project economics through 20 annual forecast years and 100 pre-linked well slots (15 illustrative examples). Includes Arps decline curves, reserve tracking, three linked financial statements, debt service, DSCR, 31-point oil-price sensitivity, three scenarios, eight Excel charts and a 25-page guide.
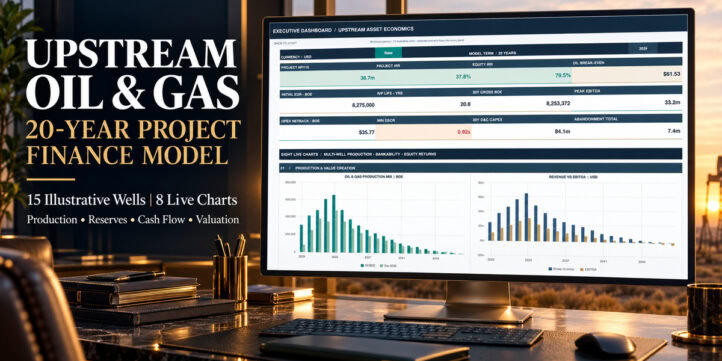

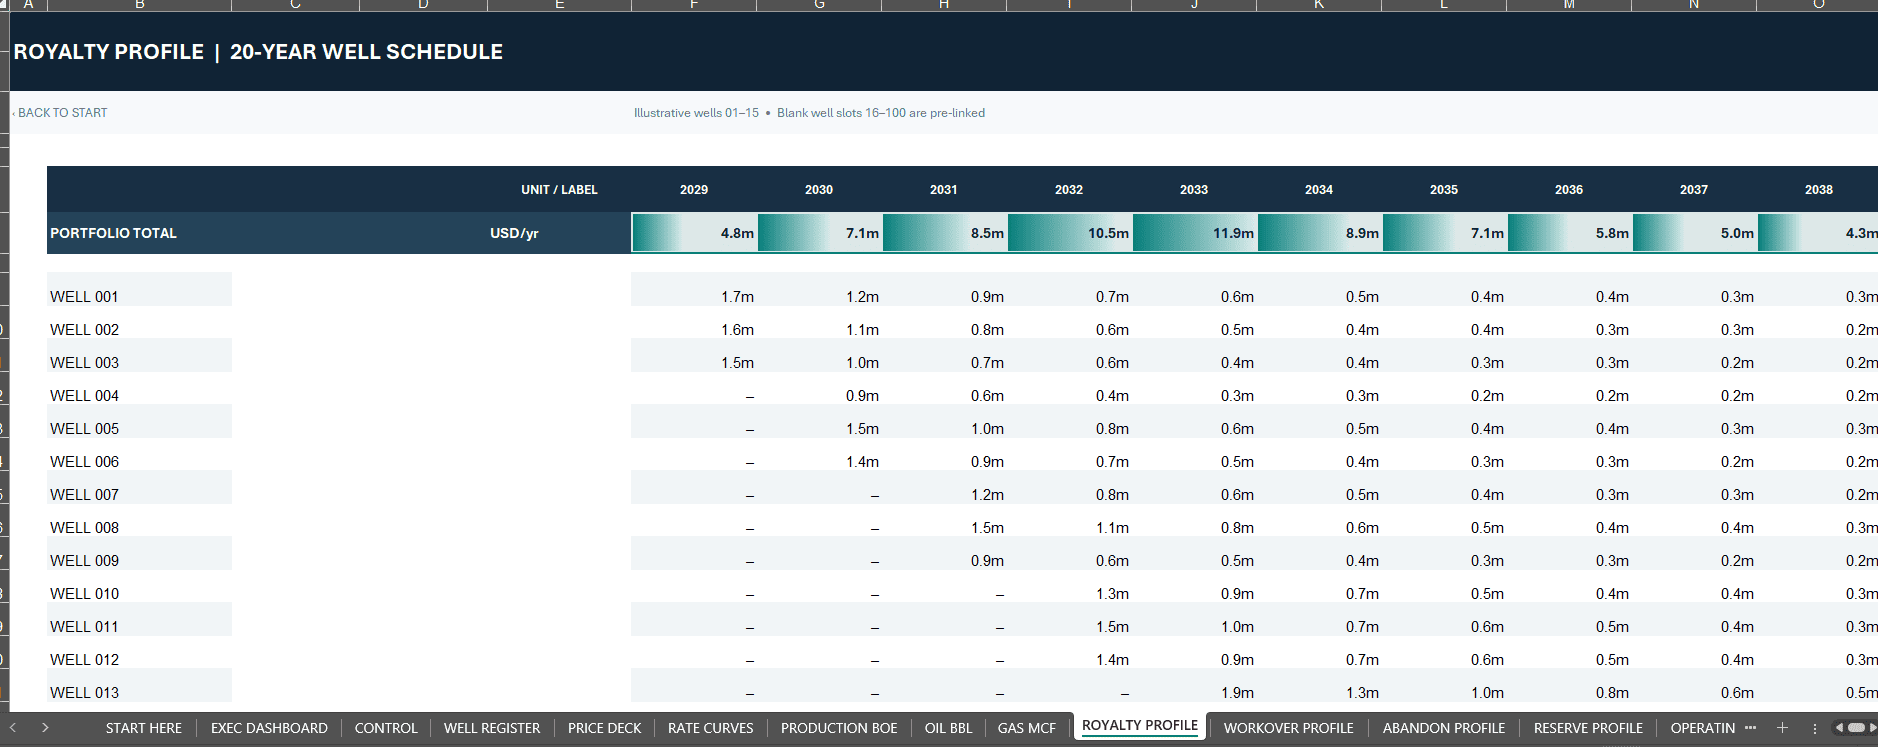
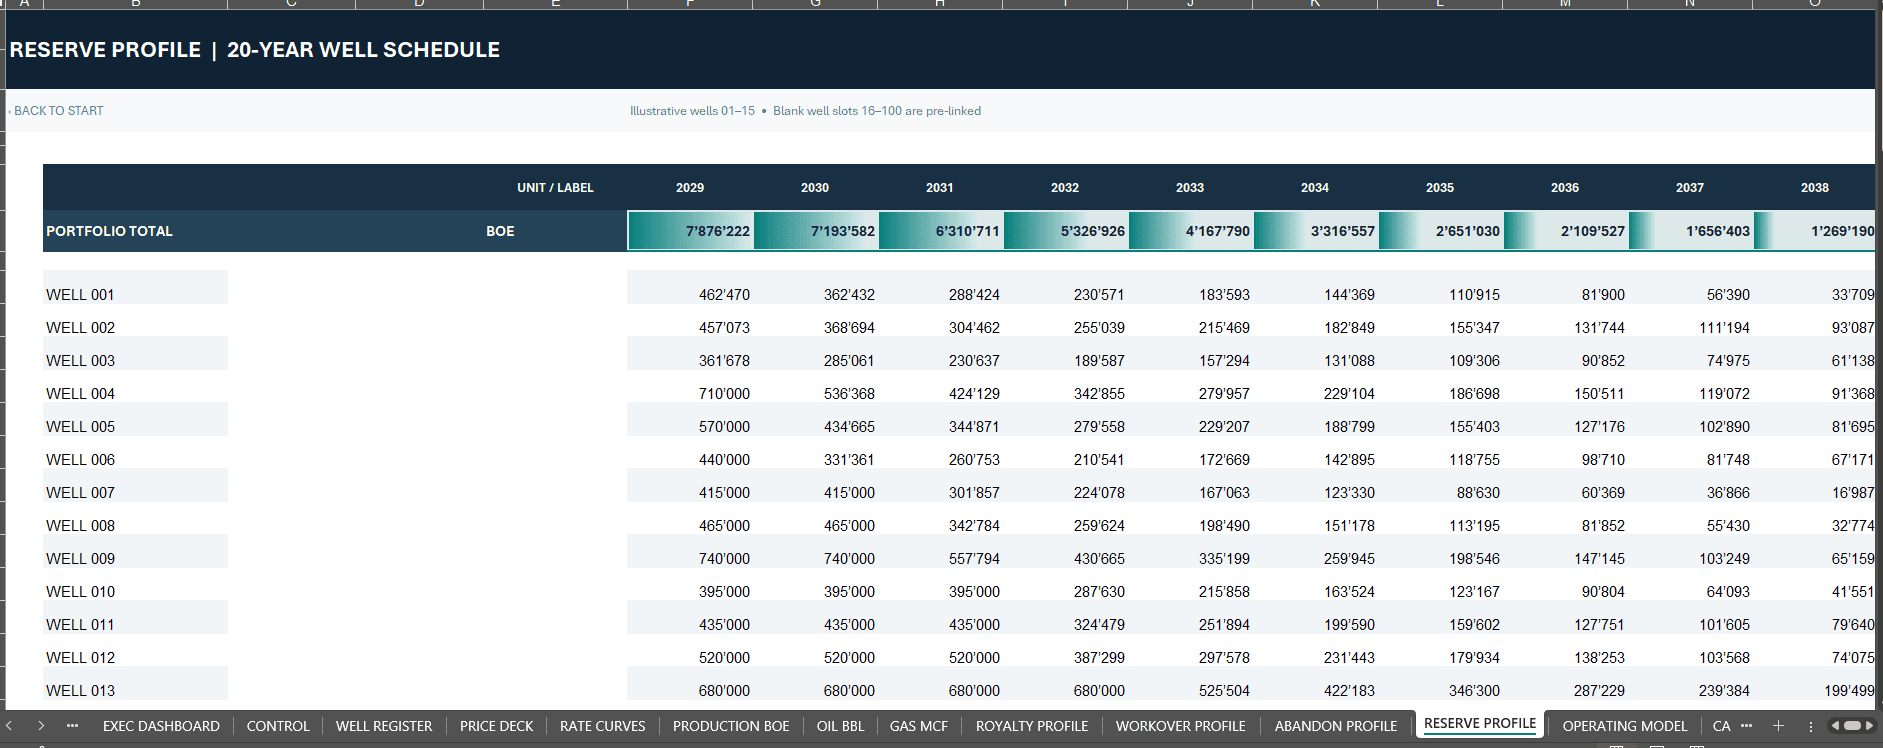
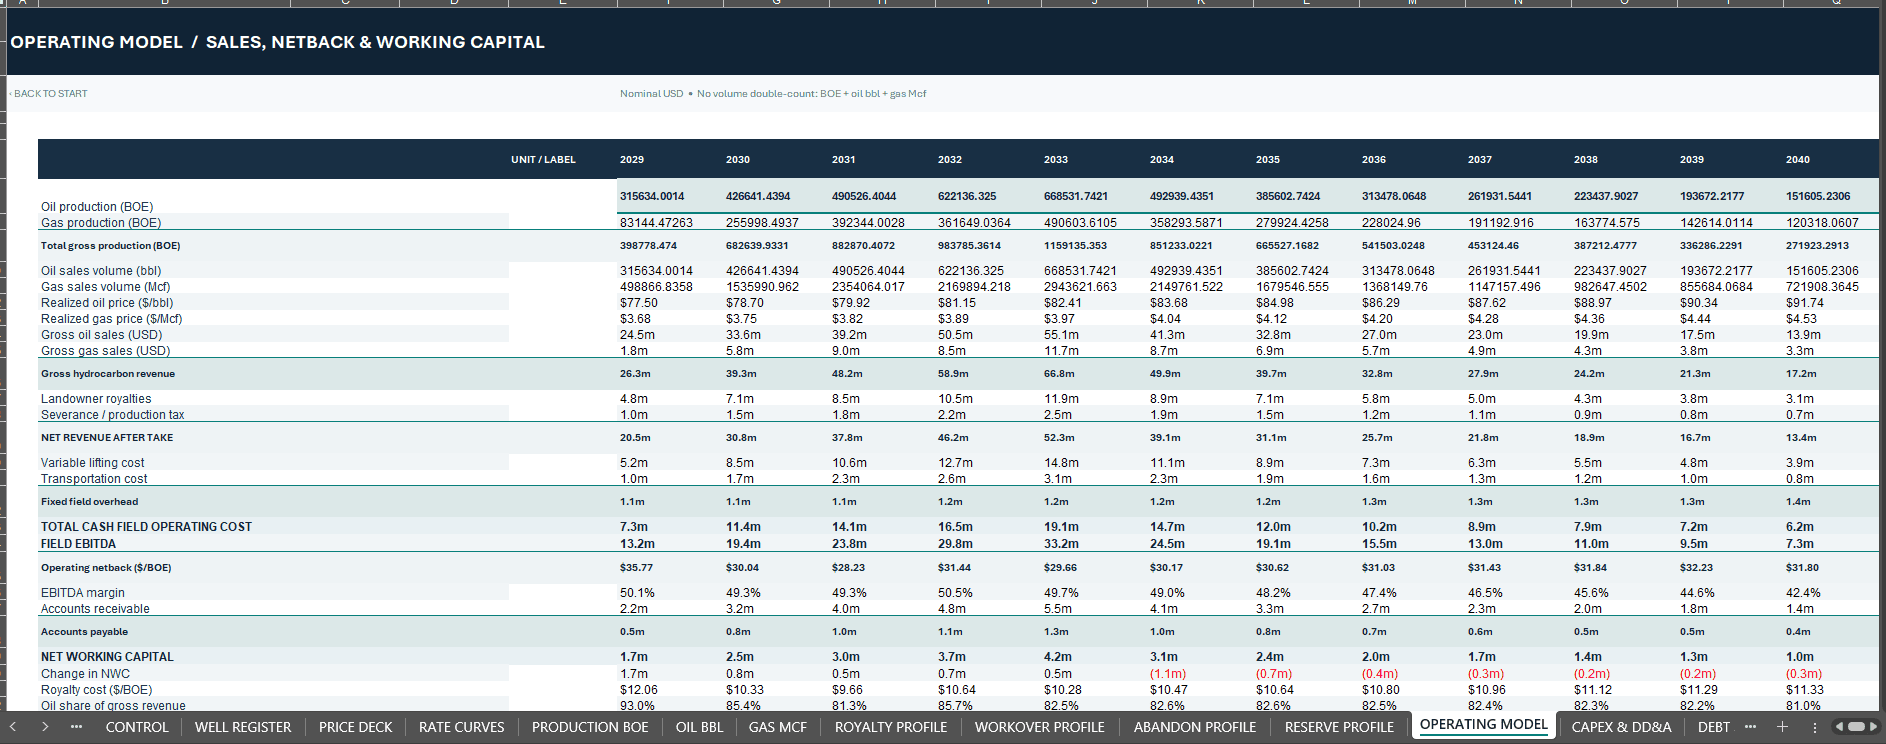
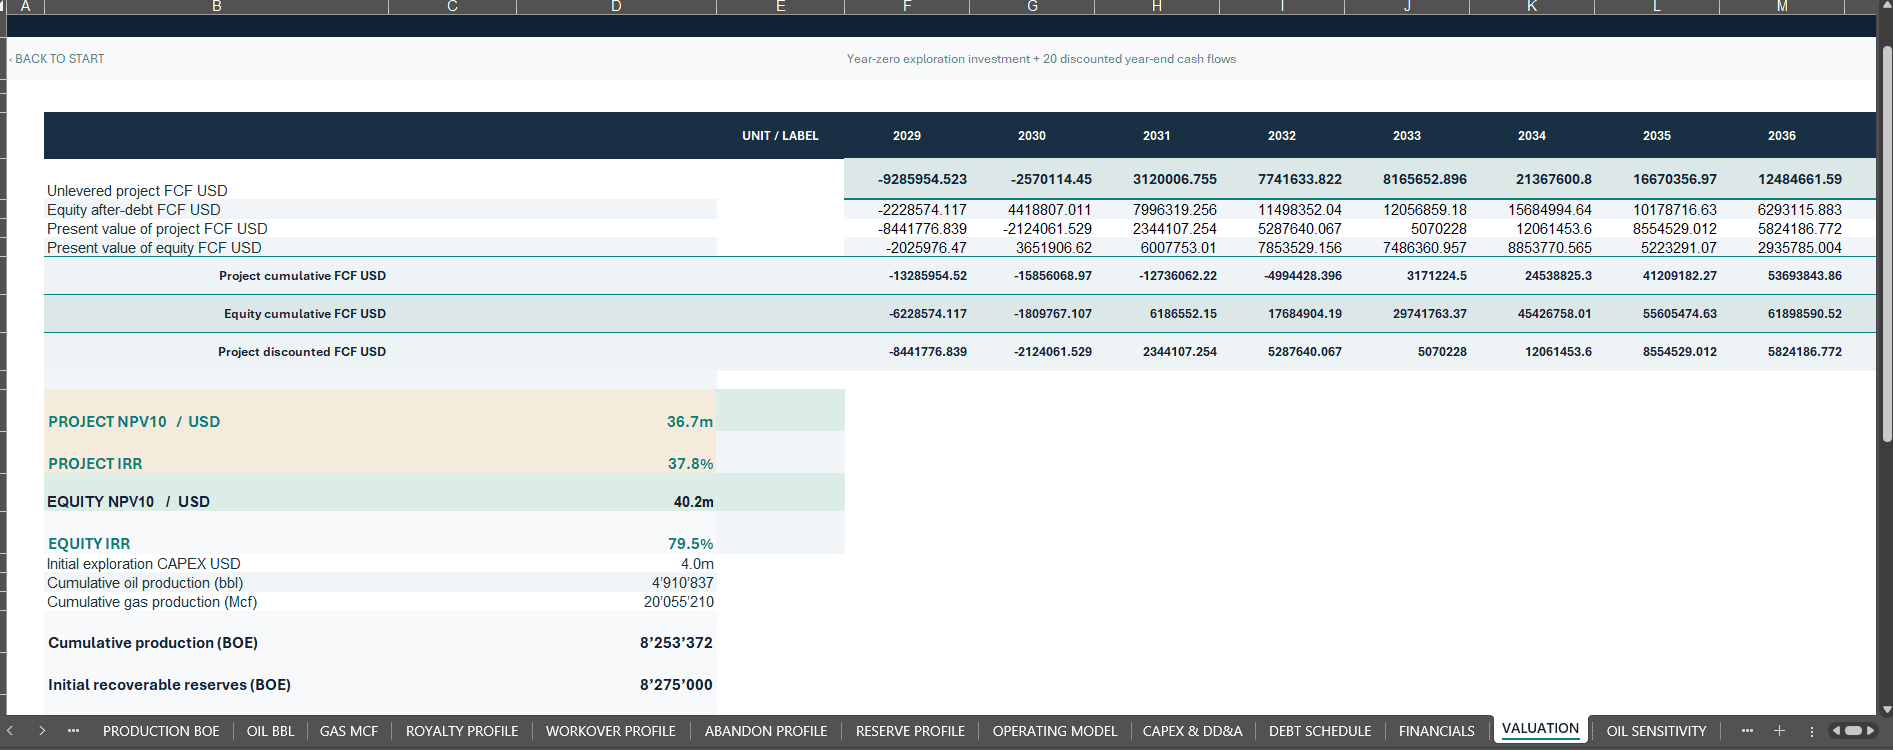
UPSTREAM OIL & GAS | 20-YEAR PROJECT FINANCE MODEL
Well-Level Production, Reserves, Financing & Investor Returns in One Excel System
Connect drilling decisions, production decline, commodity sales, royalties, development spending, debt and abandonment to a transparent 20-year project financial forecast.
This independent, editable Excel model is designed for upstream investment analysts, exploration and production teams, petroleum consultants, project-finance advisers and professionals evaluating illustrative multi-well development cases.
The supplied demonstration spans 2029–2048, with a separate year-zero investment. All well data, prices and projected outcomes are fictional and must be replaced with validated project assumptions.
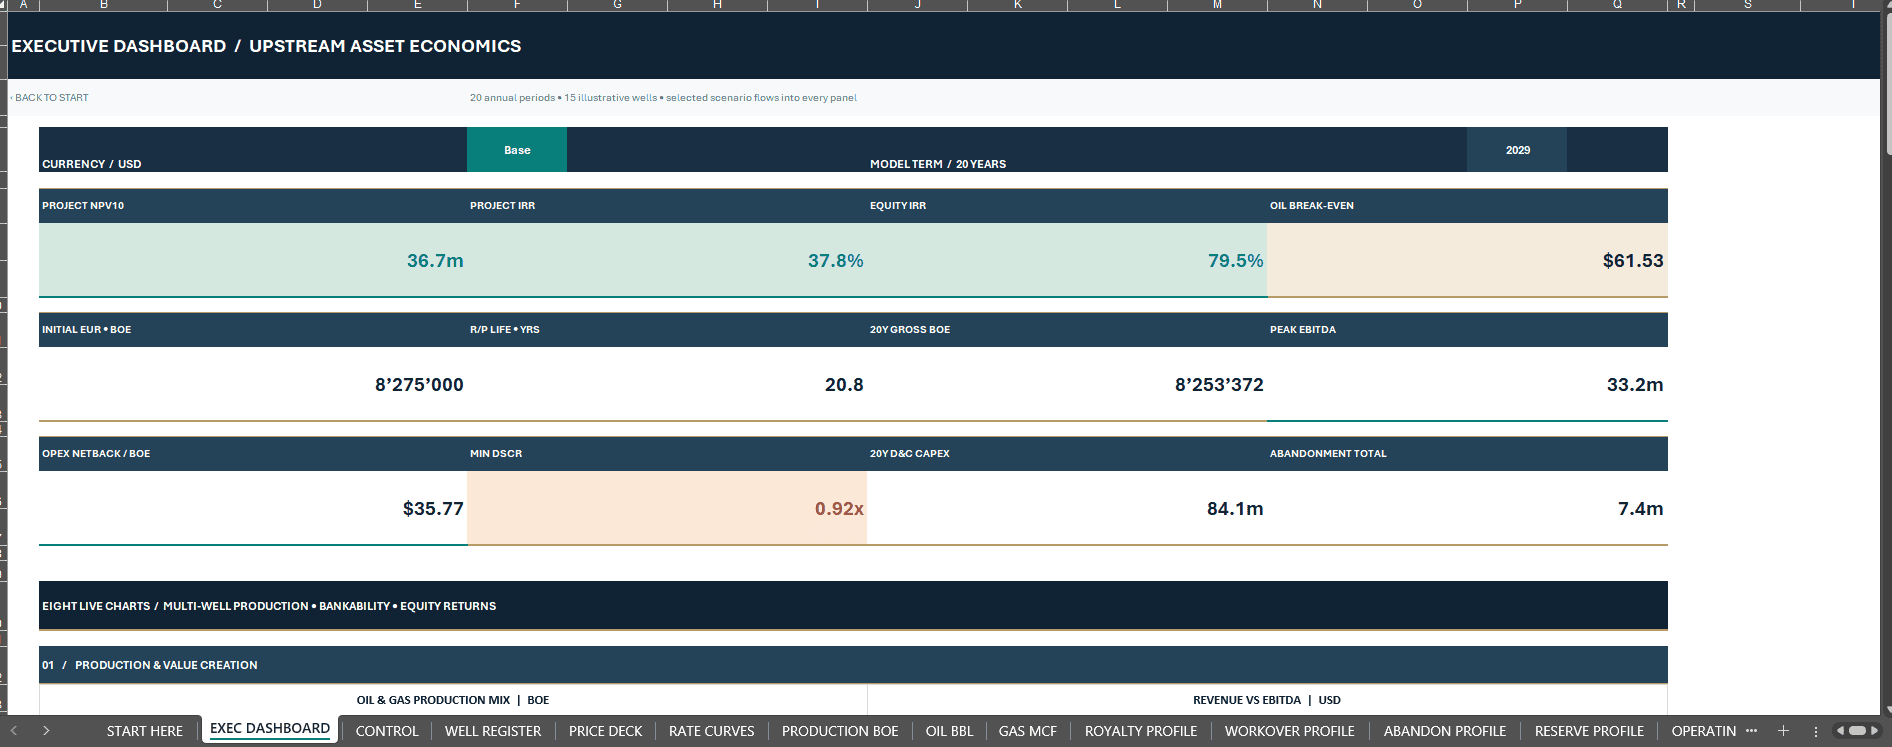
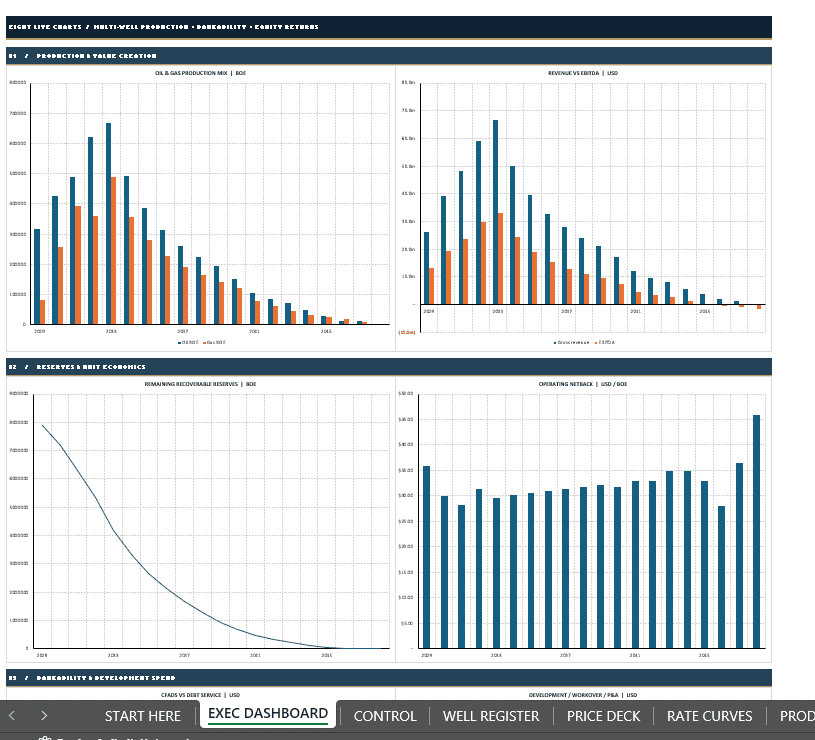
📊 EXECUTIVE DASHBOARD | 12 KPIs & 8 NATIVE CHARTS
Review Project NPV10, Project IRR, Equity IRR, oil-price break-even, initial recoverable reserves, reserves-to-production life, cumulative production, peak EBITDA, operating netback per BOE, minimum DSCR, development CAPEX and abandonment expenditure.
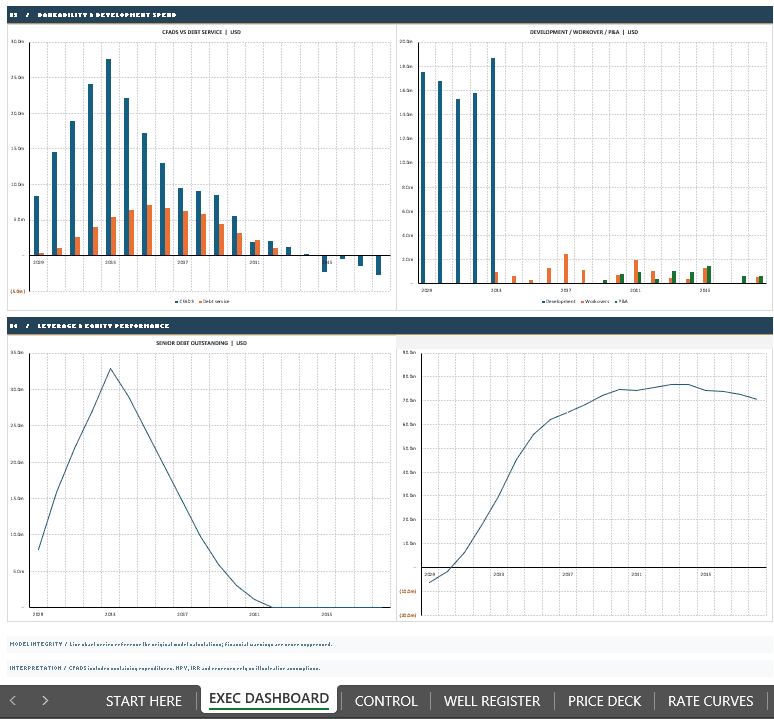
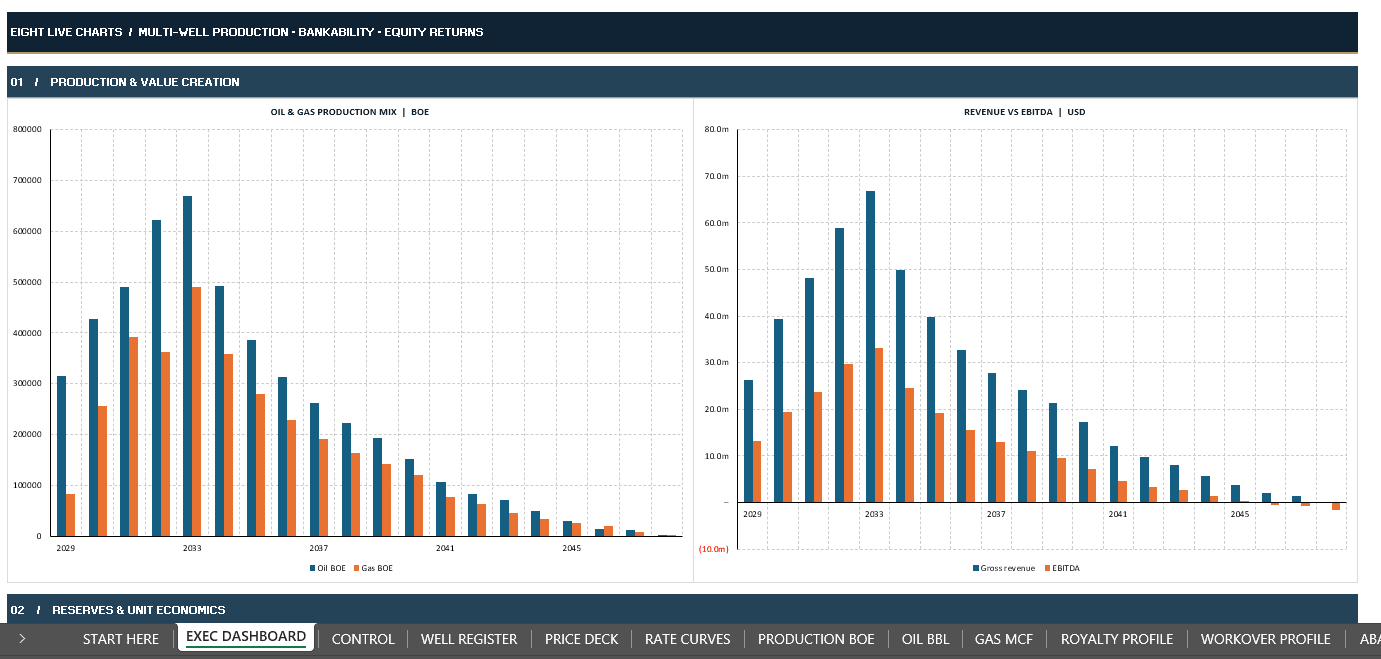
Eight native, linked Excel charts display:
- Oil & Gas Production Mix
- Revenue vs EBITDA
- Remaining Recoverable Reserves
- Operating Netback per BOE
- CFADS vs Debt Service
- Development, Workover & Abandonment CAPEX
- Senior Debt Outstanding
- Cumulative Equity Cash Flow
The charts are genuine spreadsheet objects linked to model data rather than static marketing graphics.
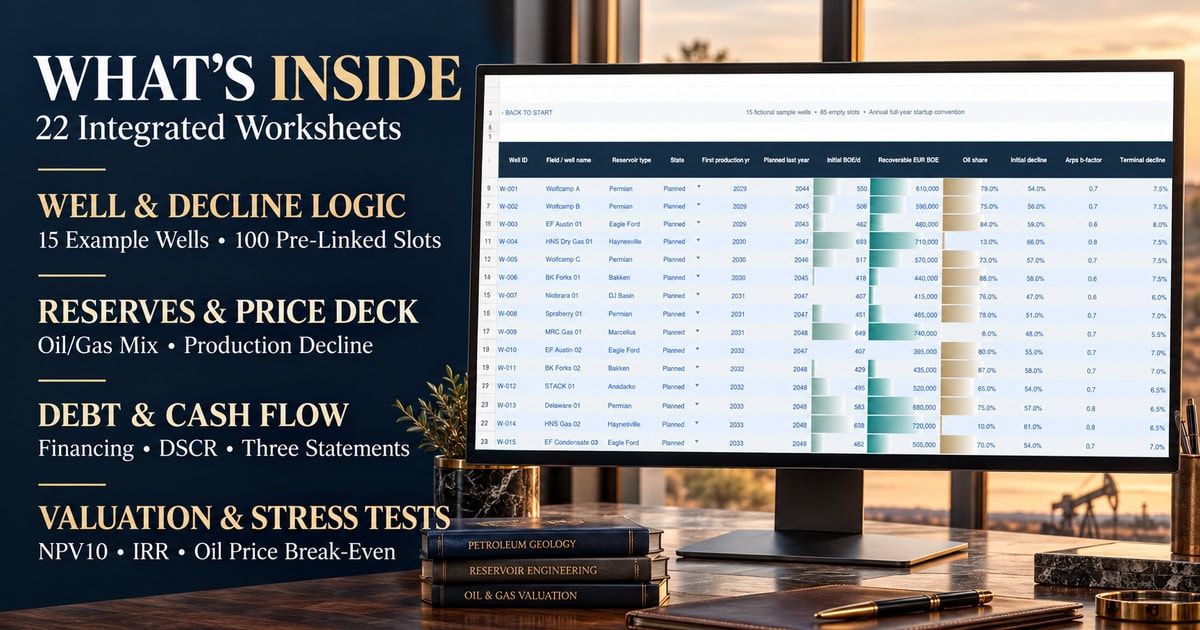
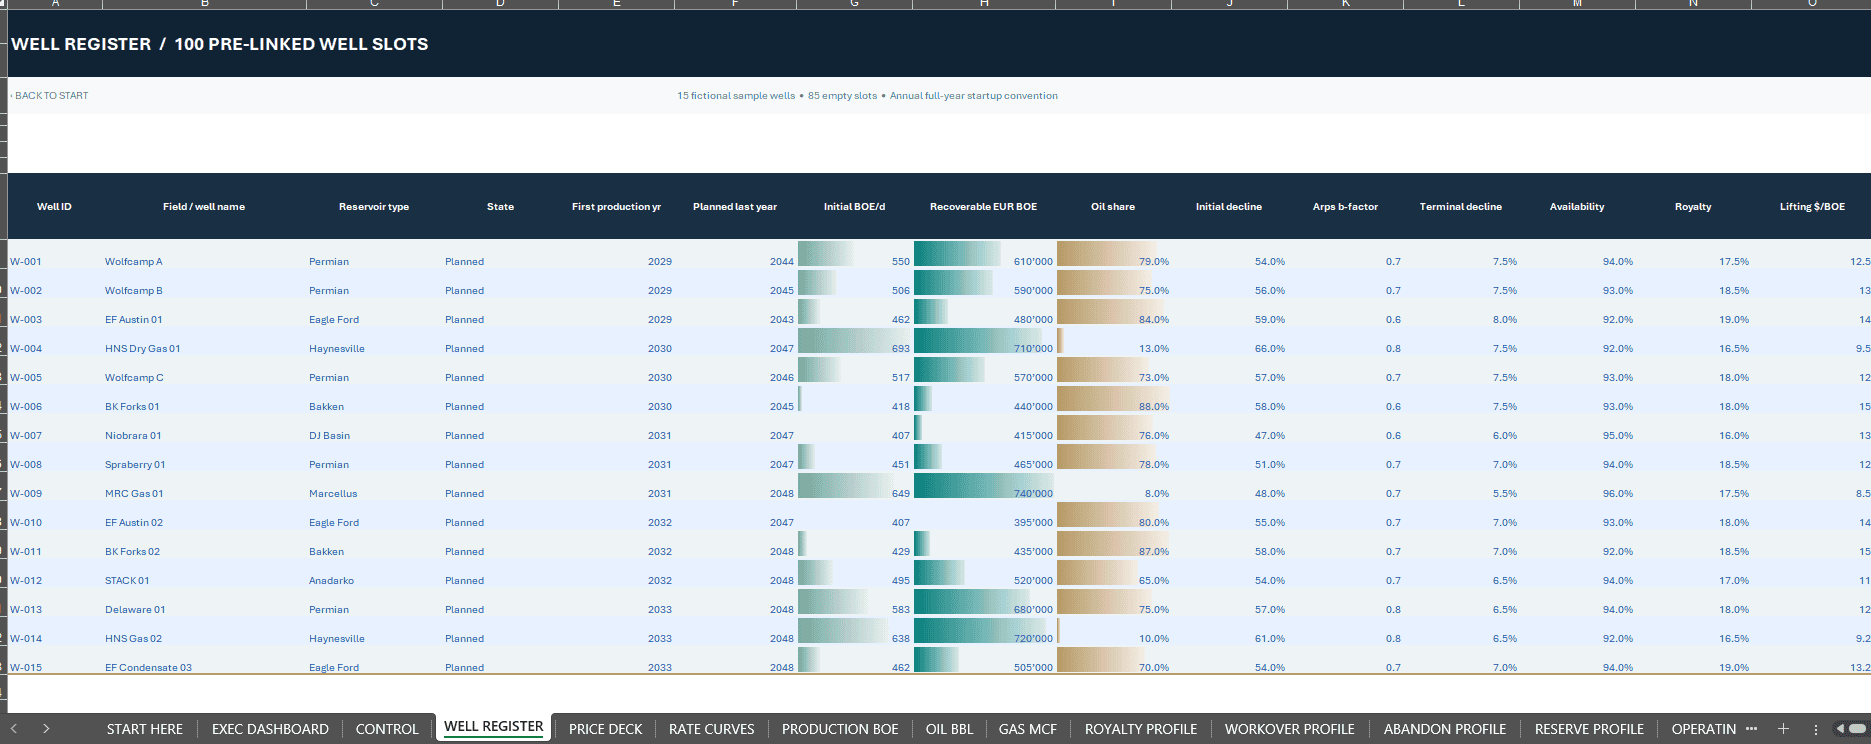
⚙️ WELL REGISTER | 100 PRE-LINKED POSITIONS
Start with 15 fictional example wells and 85 further prepared well positions.
Customize first and final production years, initial BOE/day, estimated ultimate recovery (EUR), oil share, initial decline, Arps b-factor, terminal exponential decline, producing availability, royalties, lifting costs, drilling CAPEX, workovers and plugging/abandonment costs.
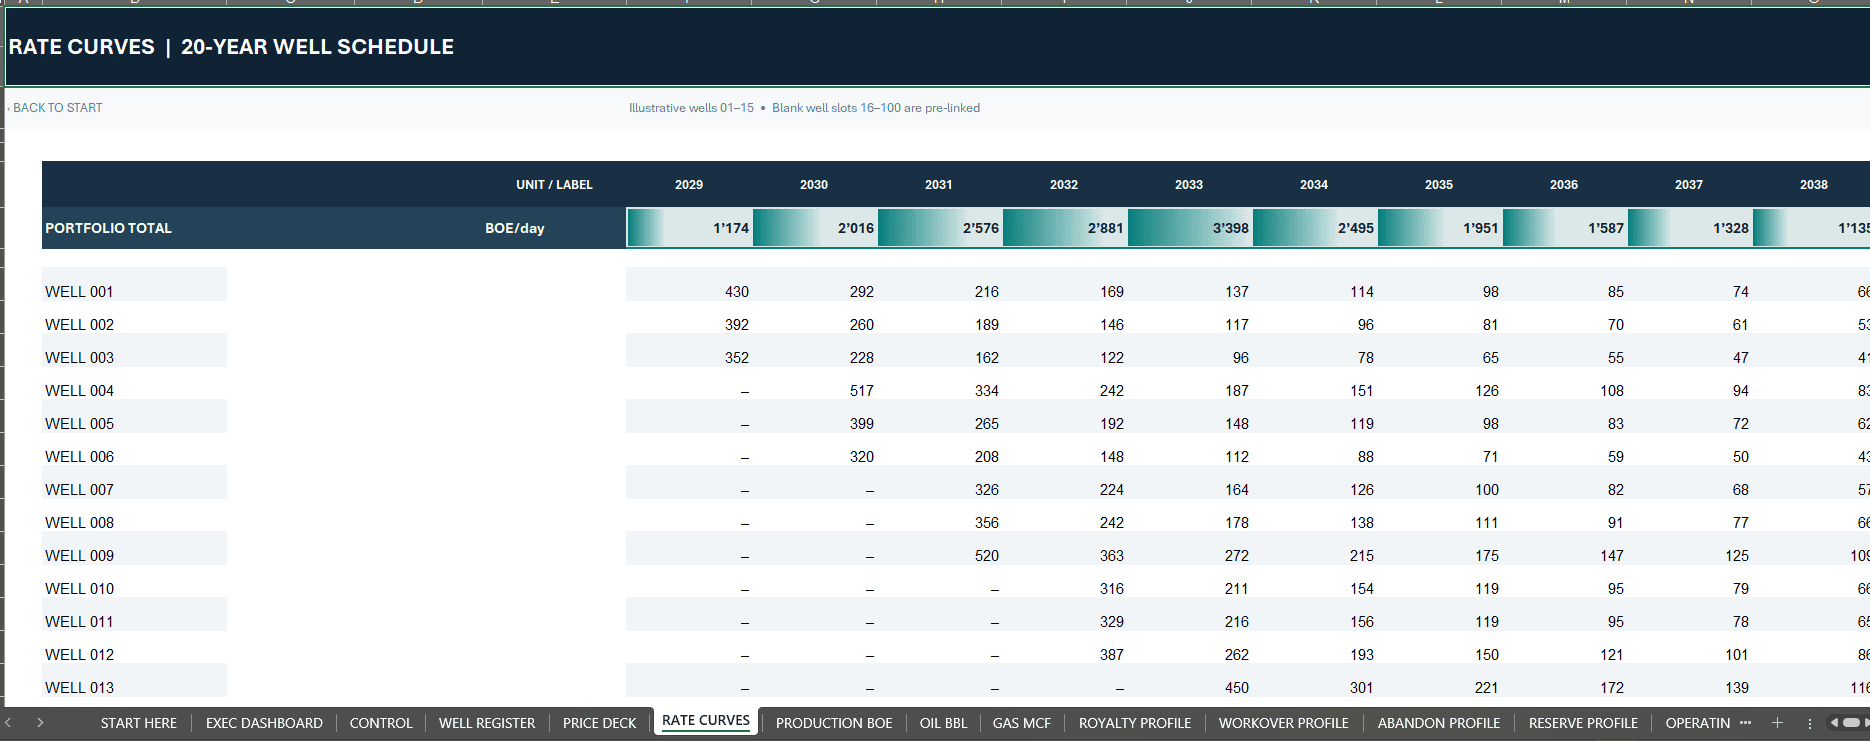
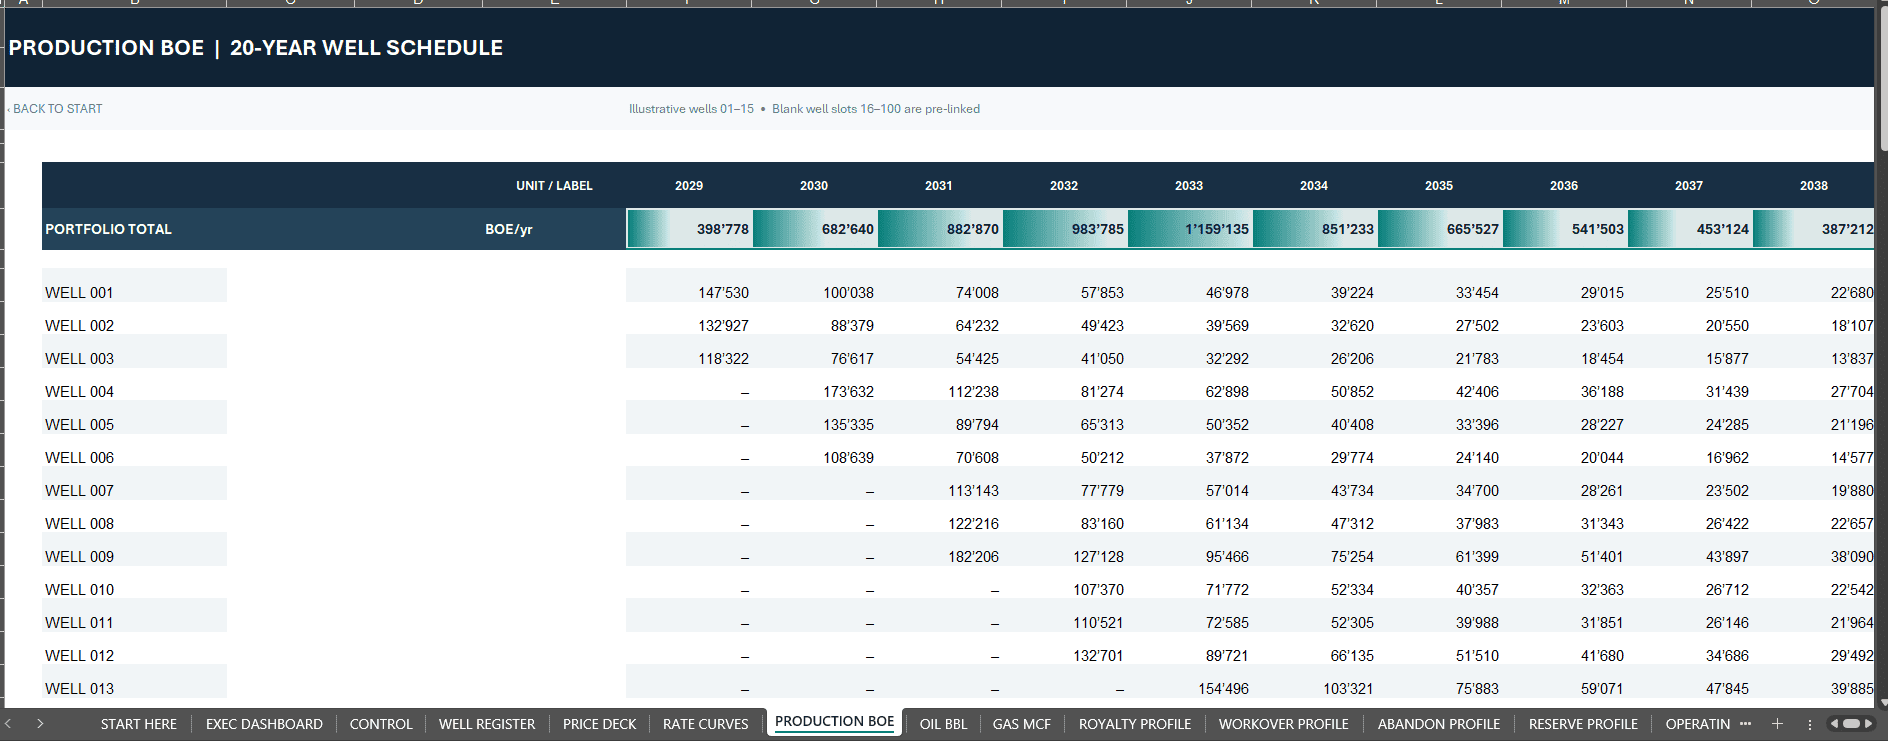
The annual production engine applies well startup and stop dates, operating days, availability, scenario volume adjustments and EUR limits.
Empty well slots do not create production automatically.
The well status field is descriptive and is not an automatic production on/off switch.
◈ PRODUCTION, RESERVES & UNIT ECONOMICS
Analyze oil barrels and associated gas Mcf separately using a configurable BOE conversion.
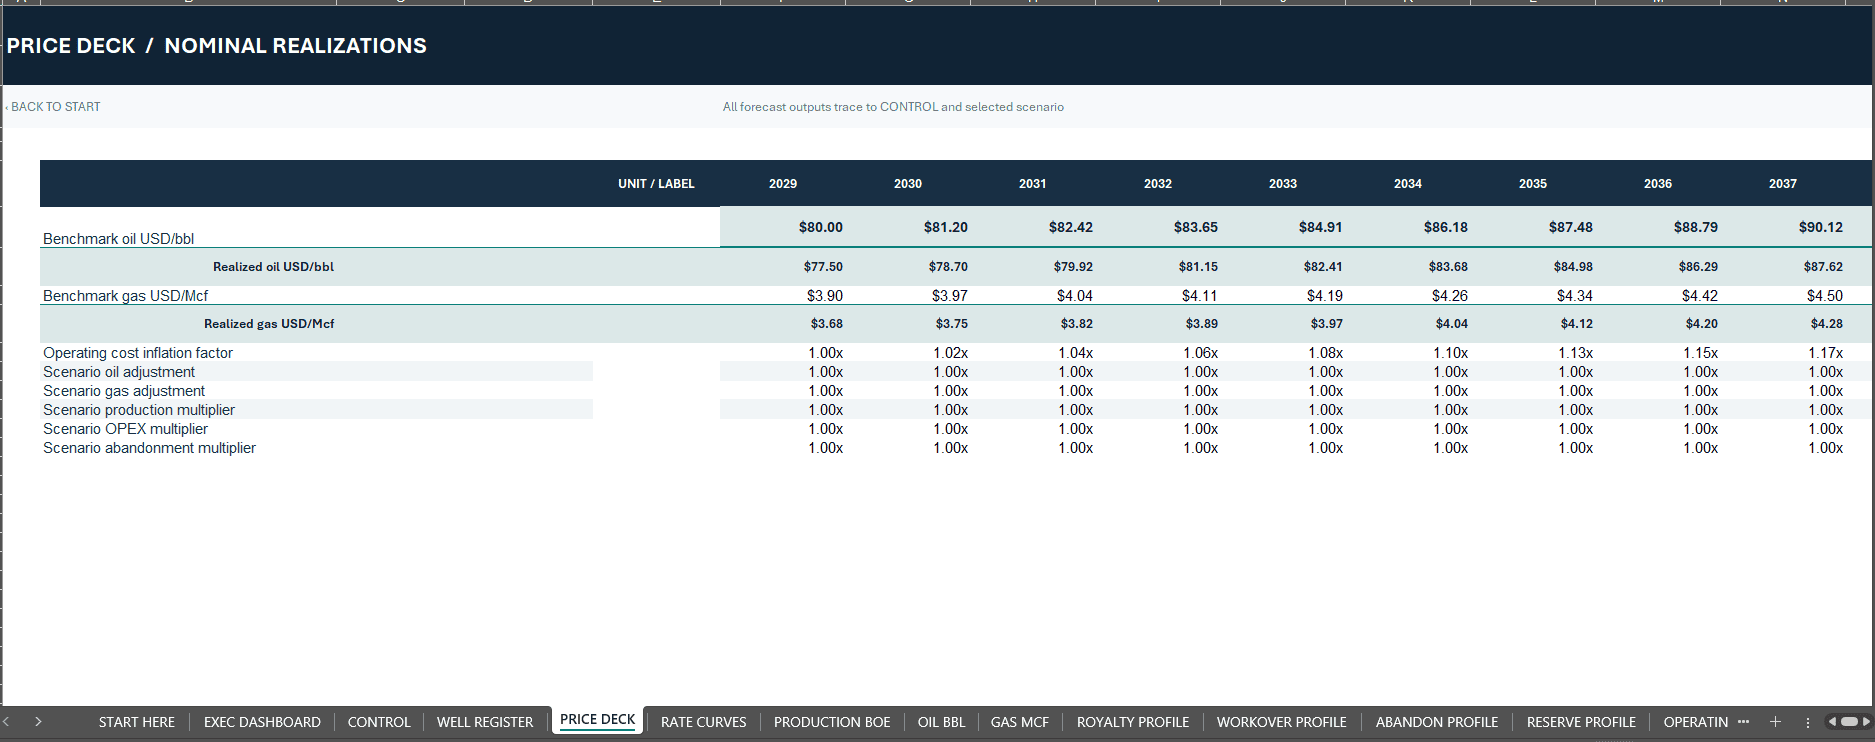
The price deck incorporates starting oil and gas prices, annual escalation, realized-price differentials and scenario factors.
The operating model accounts for royalties, severance or production taxes, lifting, transportation and overhead to calculate field EBITDA and operating netback per BOE.
The reserves schedule reconciles recoverable resources, modeled production and end-of-life write-offs.
This is a financial planning representation of reserves, not a certified petroleum engineering reserve assessment.
🏗 DEVELOPMENT CAPEX, WORKOVERS & ABANDONMENT
Link drilling and completion expenditure, facilities and tie-in investment, periodic workovers and plugging/abandonment costs to the financial forecast.
The model also calculates pooled units-of-production depreciation and depletion, annual closure cash charges and end-of-forecast asset write-offs.
A comprehensive asset-retirement-obligation accrual, accretion and funding reserve is not included.
🏦 DEBT, CFADS & THREE FINANCIAL STATEMENTS
The financing schedule models annual borrowing vintages linked to eligible development CAPEX, scheduled repayments, interest and a configurable grace period.
Analyze debt service coverage using modeled Cash Flow Available for Debt Service (CFADS) and DSCR.
Linked financial statements connect EBITDA, depletion, tax-loss carryforwards, receivables, payables, capital expenditure, borrowing, equity contributions, shareholder distributions and closing debt.
The model may calculate additional illustrative sponsor-equity contributions to maintain its selected cash policy. Such funding is an assumption and does not represent committed investor capital.
The financing framework does not include a complete lender covenant package, automatic restructuring, cash sweep, reserve-based borrowing-base redetermination or negotiated project-finance waterfall.
📈 PROJECT & EQUITY VALUATION
Review Project NPV, Project IRR, Equity NPV, Equity IRR, cumulative oil and gas production, reserve-life proxy, operating netback, peak EBITDA, total development and abandonment spending, payback and equity multiple.
NPV incorporates the year-zero investment and twenty annual year-end cash flows.
The NPV10 label reflects the default 10% discount rate. Changing the discount rate changes the computed NPV but does not automatically rename the static label.
IRR can produce multiple mathematical solutions when cash flows change sign repeatedly. Terminal abandonment expenditure can make an IRR non-meaningful.
Interpret investment returns alongside NPV, production, year-by-year cash flows and financing exposure.
↗ THREE LIVE SCENARIOS & 31-PRICE SENSITIVITY
Choose Base, Upside or Downside.
Editable scenario factors adjust oil prices, gas prices, production volumes, cash operating costs and abandonment spending.
One scenario is active at a time. The model does not maintain three complete independent financial-statement versions simultaneously.
A separate 31-point oil-price sensitivity evaluates flat realized prices from USD 20 to USD 170 per barrel under the default settings.
The sensitivity estimates project NPV under alternative realized oil prices, including simplified tax-loss and working-capital effects.
Oil-price break-even is an interpolated constant realized-price result, not a forecast of the WTI futures strip or an optimized price-triggered drilling strategy.
✅ MODEL CHECKS & FINANCING WARNINGS
Annual checks cover oil and gas reconciliation, recoverable reserves, debt movements, cash and balance-sheet identities, well timing, drilling limits, abandonment and EBITDA consistency.
Debt-service coverage warnings are evaluated separately from hard accounting and physical reconciliation failures.
In the fictional delivered cases, the minimum DSCR falls below the illustrative 1.15x warning threshold:
Base: 0.92x minimum DSCR, with one warning year.
Upside: 0.46x minimum DSCR, with three warning years.
Downside: -0.51x minimum DSCR, with eight warning years and non-meaningful project and equity IRR outputs.
These warnings indicate financing risk. Positive NPV or IRR is not evidence of guaranteed loan compliance or commercial viability.
📦 WHAT YOU RECEIVE
1 Editable Excel Financial Model (.xlsx) with 22 worksheets:
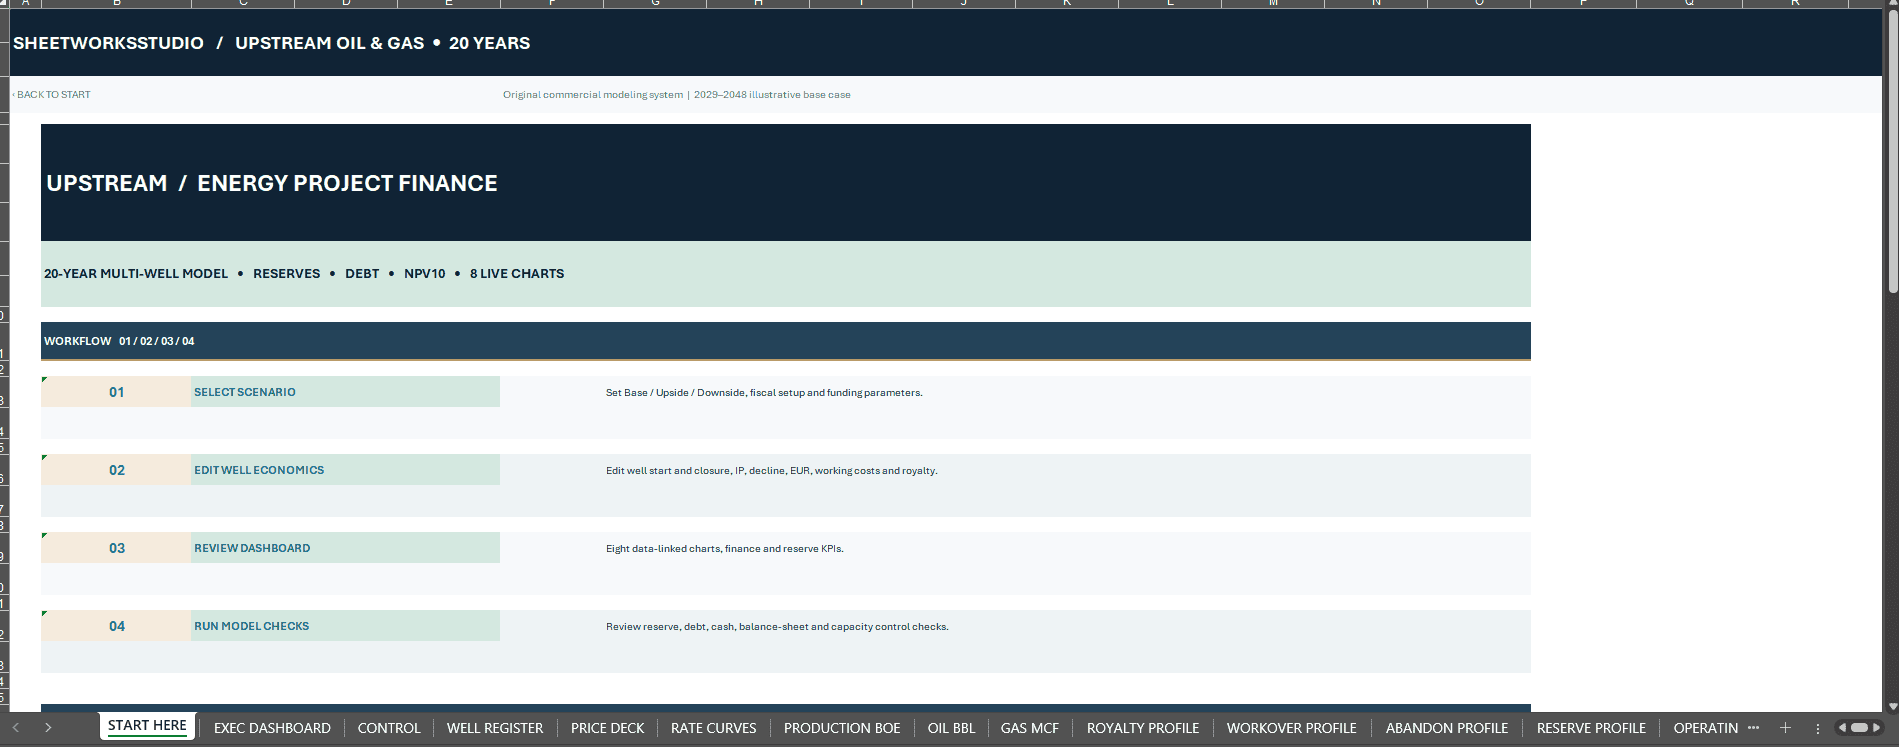
START HERE, EXEC DASHBOARD, CONTROL, WELL REGISTER, PRICE DECK, RATE CURVES, PRODUCTION BOE, OIL BBL, GAS MCF, ROYALTY PROFILE, WORKOVER PROFILE, ABANDON PROFILE, RESERVE PROFILE, OPERATING MODEL, CAPEX & DD&A, DEBT SCHEDULE, FINANCIALS, VALUATION, OIL SENSITIVITY, MODEL CHECKS, USER GUIDE and SOURCES.
1 Professional 25-Page English How-to-Use PDF Guide, covering configuration, decline methodology, reserves, CAPEX, abandonment, financing, financial statements, investment returns, oil sensitivity, dashboard analysis, model checks and troubleshooting.
The guide is also available separately as a complimentary reference document without the editable Excel workbook.
🧭 GETTING STARTED
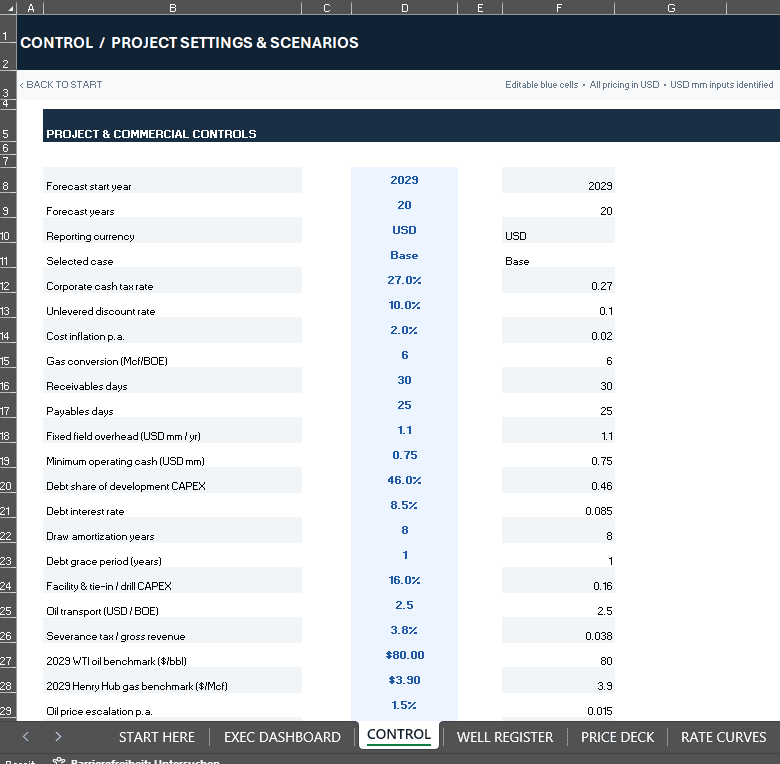
Save a working copy, configure CONTROL and select your scenario.
Replace fictional inputs in WELL REGISTER, review production and reserve limits, update prices and capital assumptions, then inspect FINANCIALS, VALUATION, OIL SENSITIVITY and MODEL CHECKS.
Compare all three scenarios after making material changes.
⚙️ TECHNICAL SCOPE & COMPATIBILITY
Forecast: 20 annual periods, illustrative 2029–2048, plus a separate year-zero investment.
Editable, macro-free Microsoft Excel XLSX, without VBA or live external data connections.
Microsoft Excel Desktop is recommended. A direct Excel Desktop opening, recalculation and save test has not been performed as part of this review. Google Sheets formula and chart compatibility has also not been independently verified.
The currency setting is a reporting label, not automatic foreign-exchange conversion.
The workbook is not a monthly drilling simulator, certified reserves model, hedging system, jurisdiction-specific petroleum tax engine or geological risk simulation.
🛡️ INDEPENDENT & UNOFFICIAL TEMPLATE DISCLAIMER
This is an independent financial-planning template created by SheetworksStudio.
It is not independently audited, reserves-certified, regulator-approved, bank-approved or endorsed by a software provider, financial institution or petroleum engineering authority.
All example wells, prices, production assumptions and projected investment results are fictional.
Actual projects require independent geological, engineering, regulatory, financing, accounting, tax and legal review.
No investment outcome, financing approval or profitability is guaranteed. The template does not provide individualized investment, financial, engineering, accounting, tax or legal advice.
Bring well-level production, reserves, project cash flow and investor returns together in one transparent 20-year Excel model.
Digital product only. No physical item is included.
Similar ProductsOther customers were also interested in...



 eFinancialModels
Electric Vehicle (EV) Charging Station Financial M...
With this comprehensive 5- or 10-year monthly tool, investors can assess the viability of setting up... Read more

Financial Model for Mobile App | Mobile App Busine...
The Mobile App Financial Plan Template in Excel allows you to develop financial projections when lau... Read more

 HenrySheykin
Food Truck Financial Model Excel Template
The Food Truck Financial Model helps entrepreneurs, founders, business owners, consultants, and anal... Read more

Green Hydrogen Production from Wind Energy Financi...
The Green Hydrogen from Wind Financial Model aims to comprehensively forecast a horizon of 40 years ... Read more

Simple Mutual Non-Disclosure Agreement Template
Protect your business secrets with ease using our Simple Mutual Non-Disclosure Agreement Template. S... Read more

Solar Energy Financial Model
The Solar Energy Financial Model Spreadsheet Template in Excel assists you in preparing a sophistica... Read more

 Peter Graf
The Customer-Centric Financial Model for Restauran...
Starting a restaurant without a financial plan is like driving a car blindfolded. You wouldn´t do i... Read more
You must log in to submit a review.