
0 ITEMS

Tire Recycling and Crumb Rubber Plant Financial Model: Tyre Recycling, Whole Tires, TDF or Mulch, Stewardship Incentives or Tipping Fees, Project Finance
Annual Excel model for a tire recycling and crumb rubber plant. Compare whole tire, TDF and mulch feedstock, model tipping fees or stewardship incentives, size debt to a target DSCR and get IRR, NPV and three linked statements.
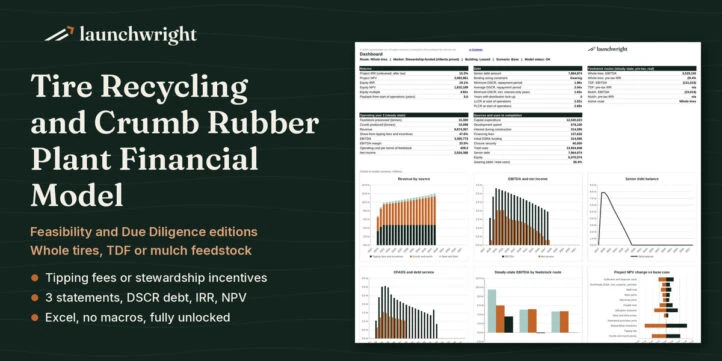
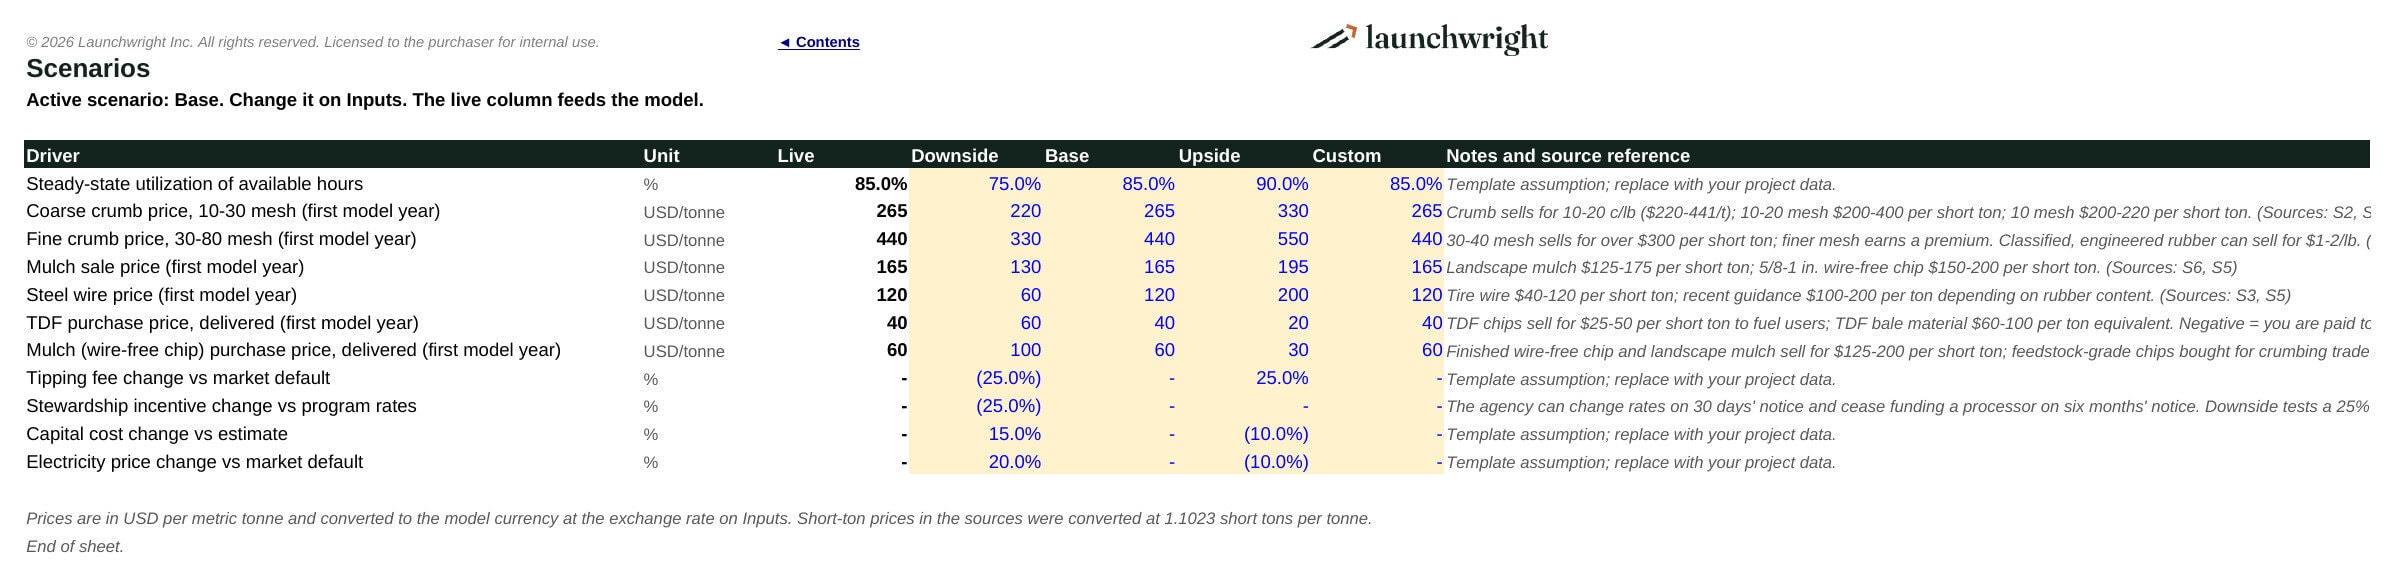
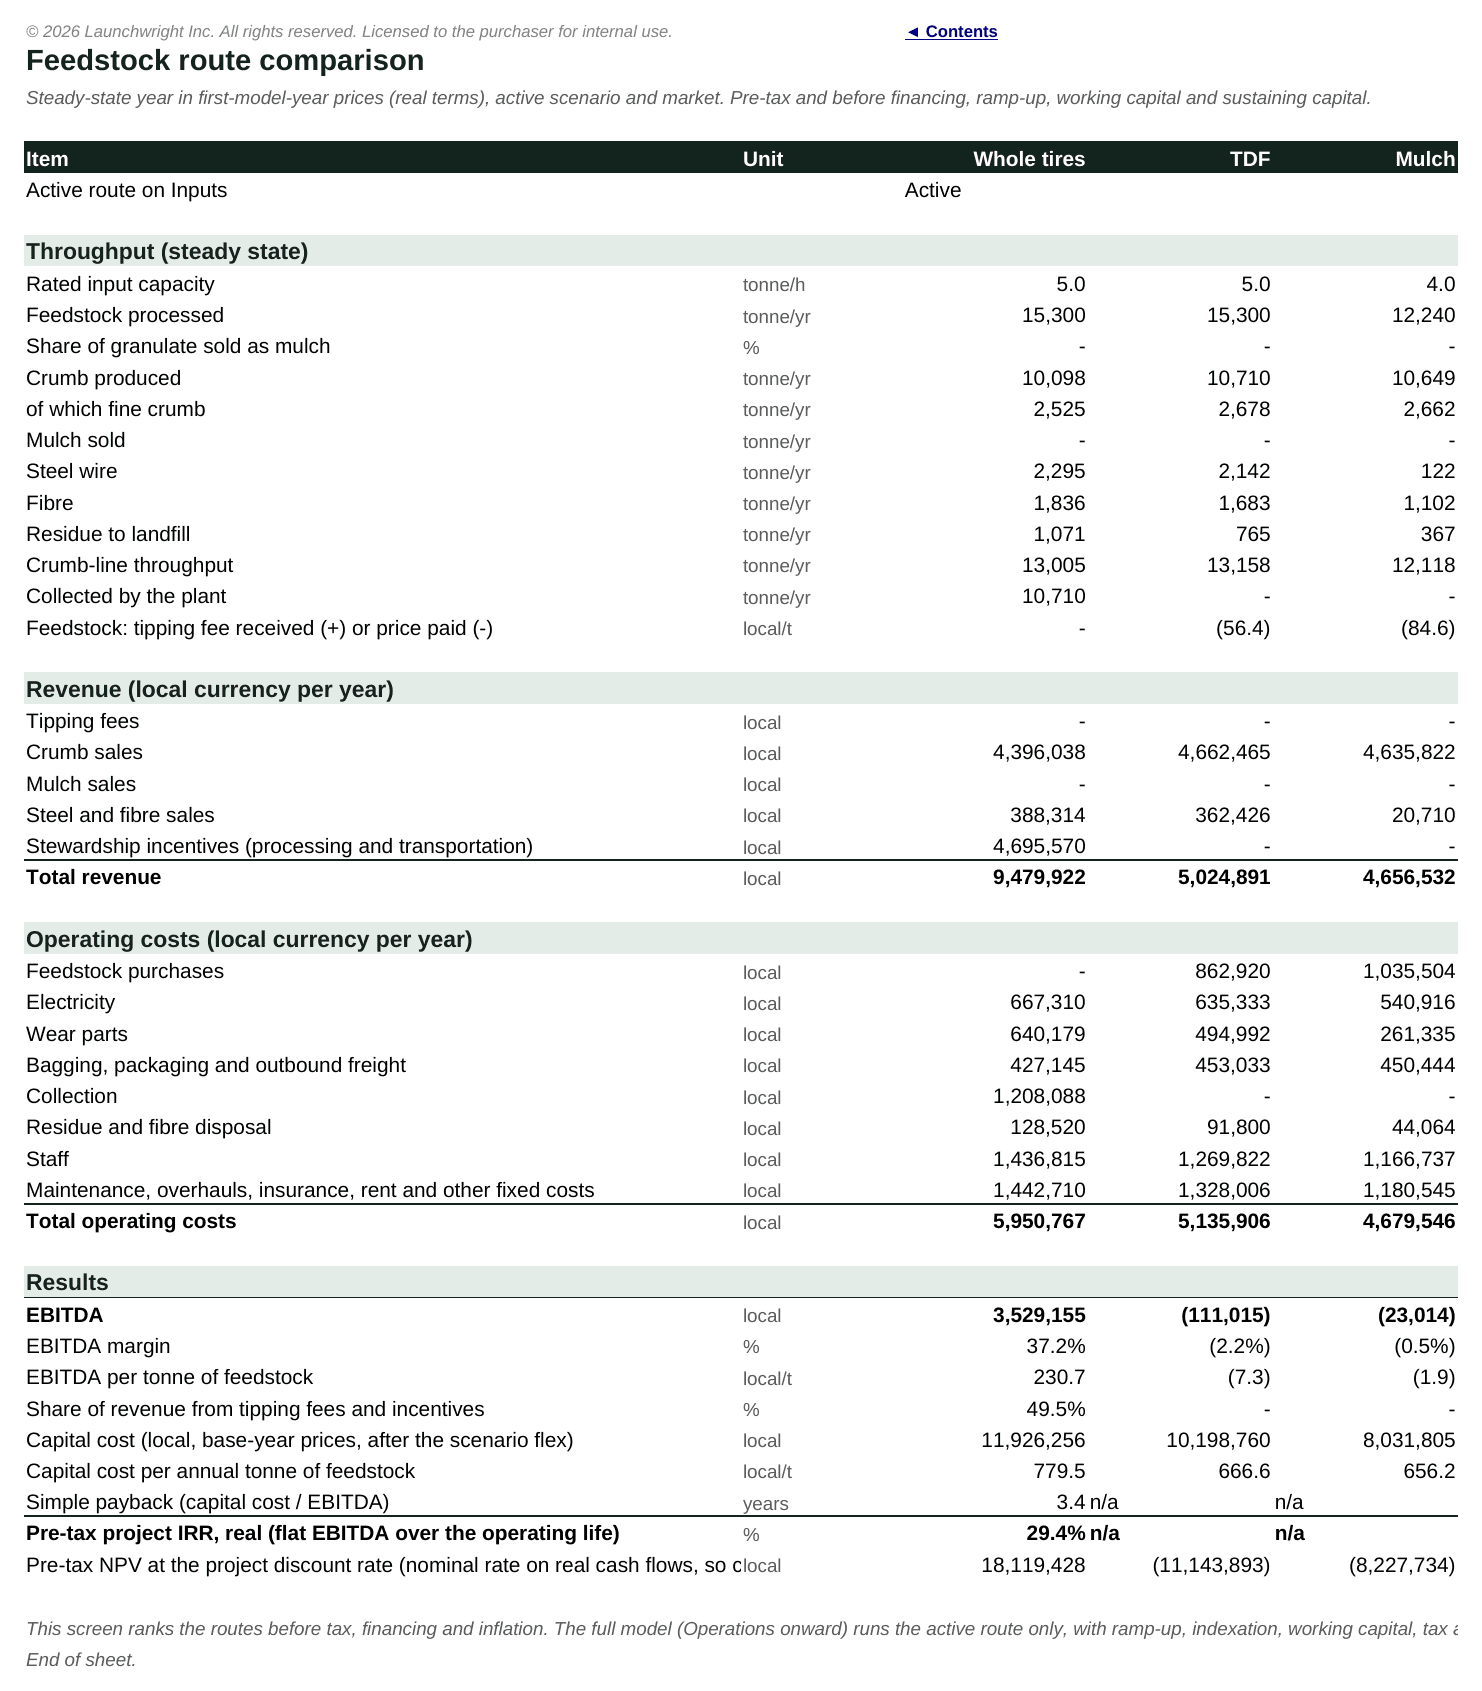
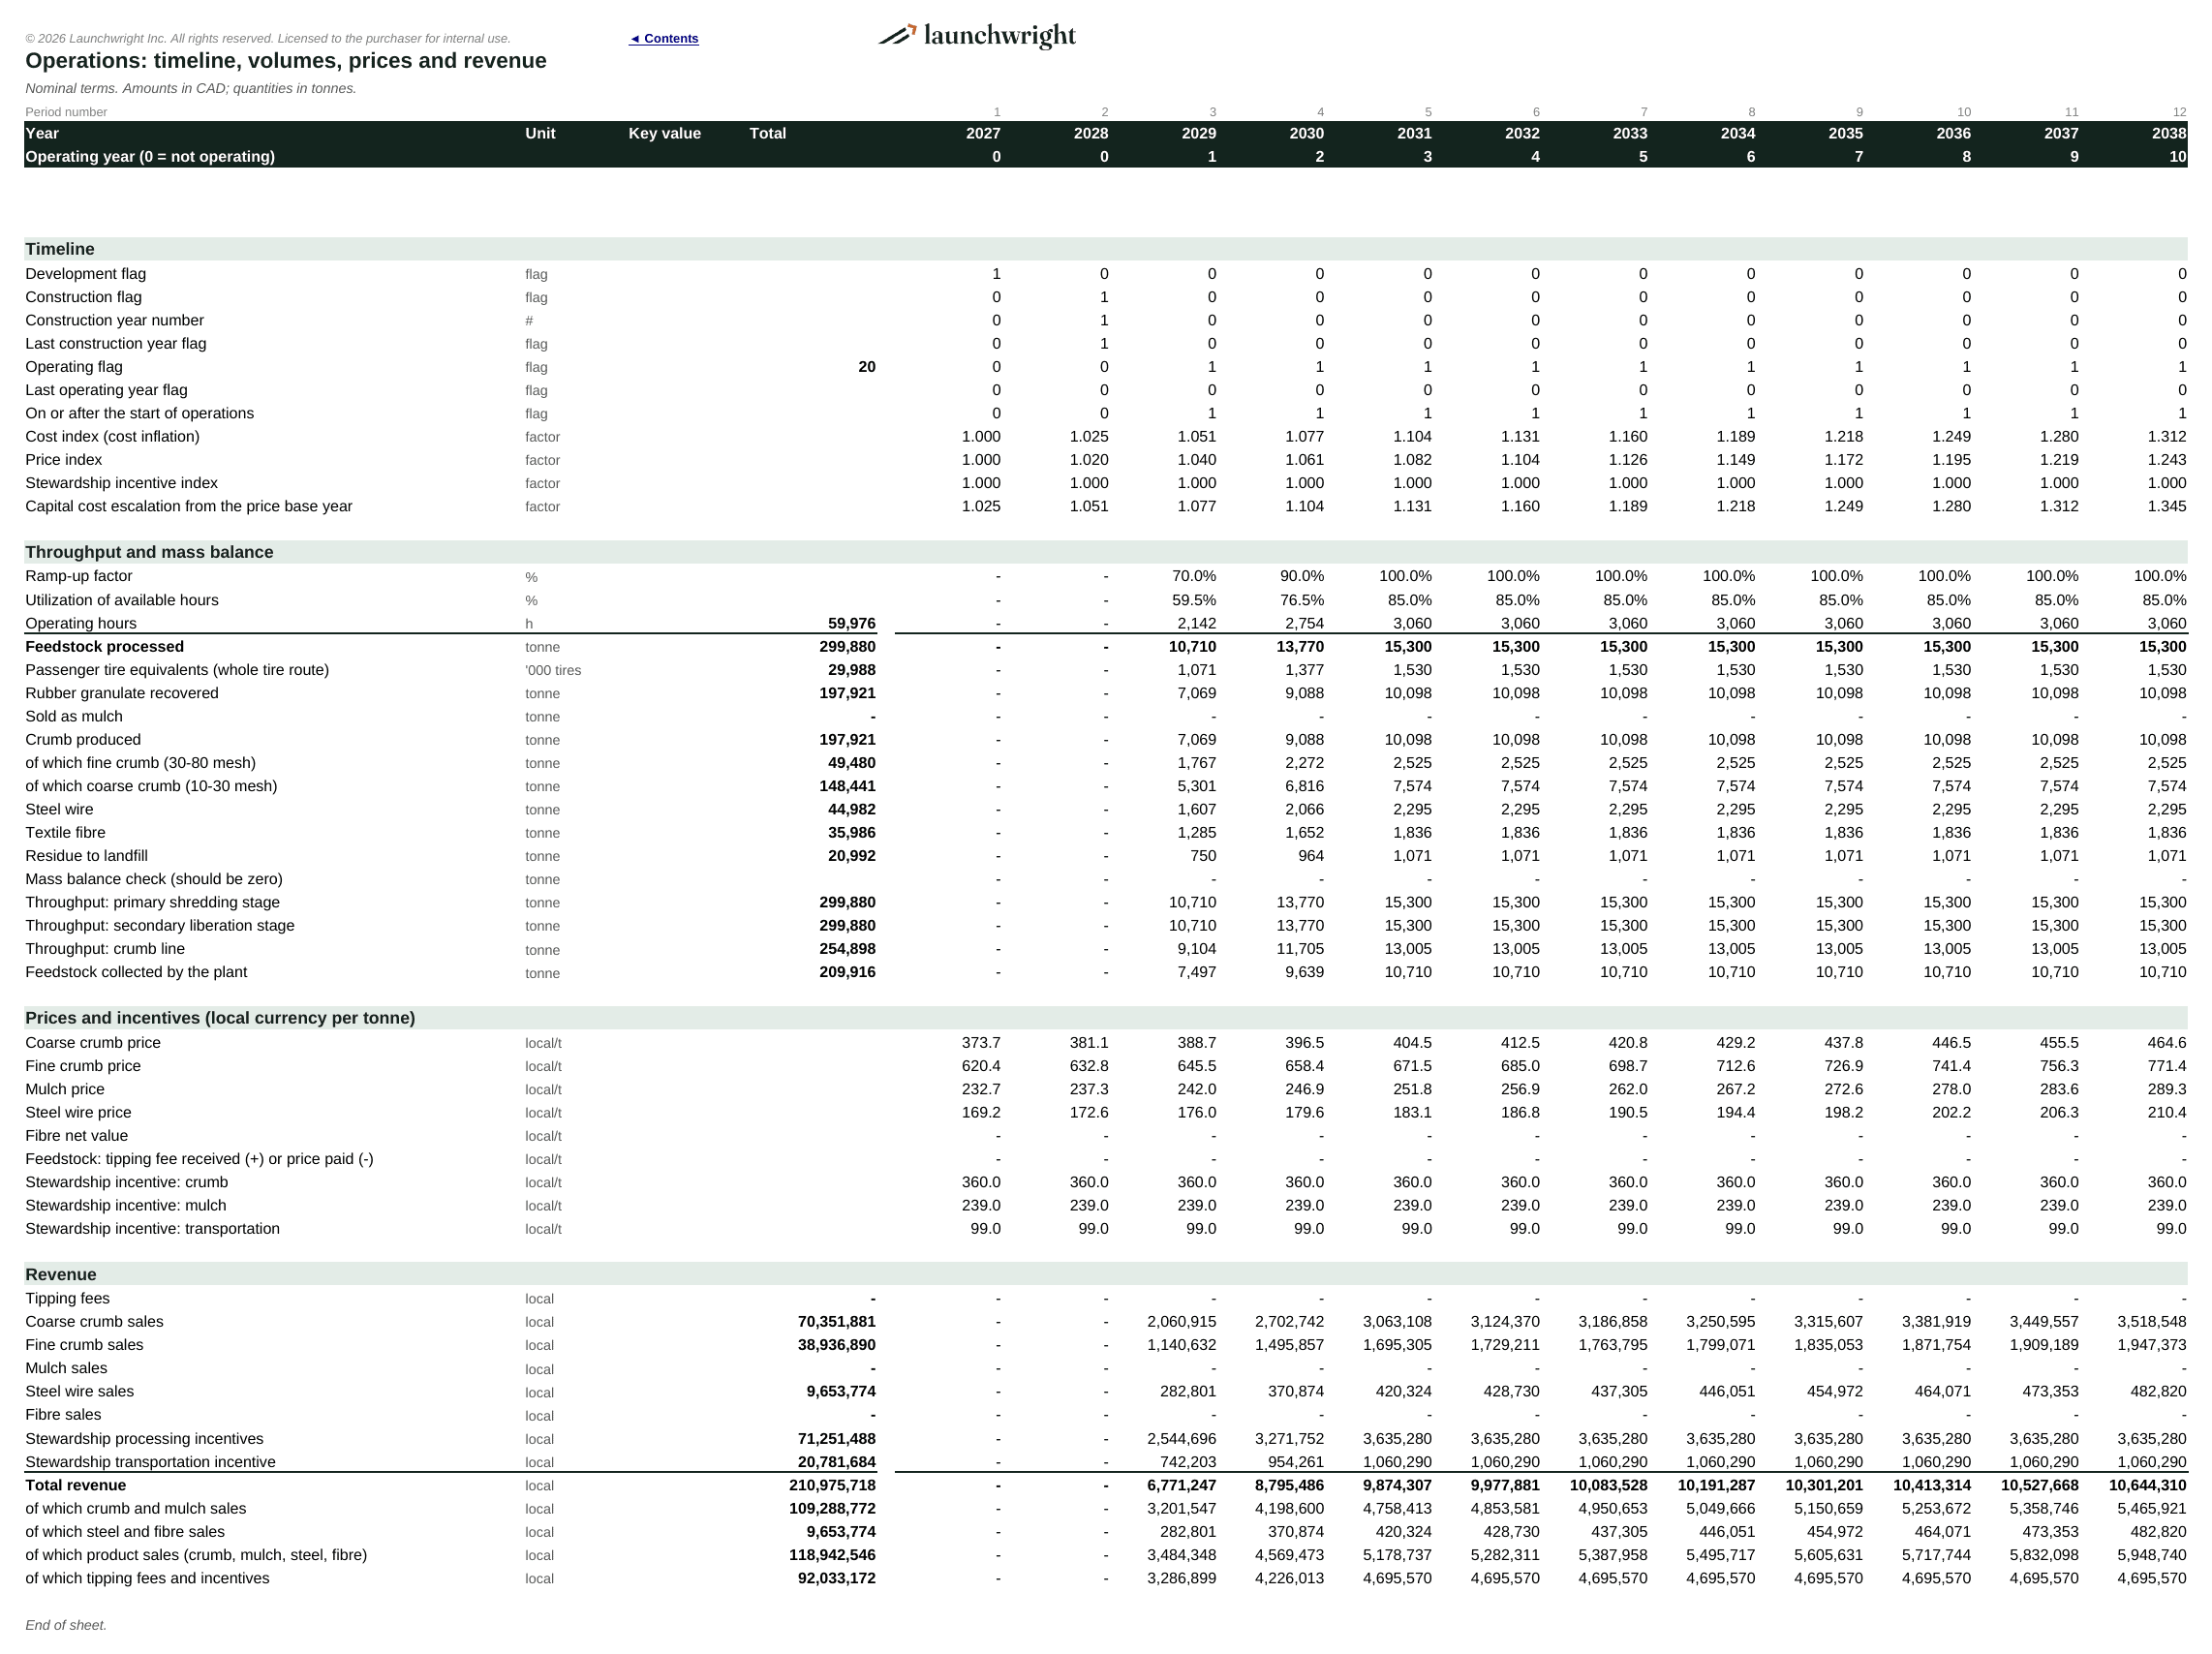
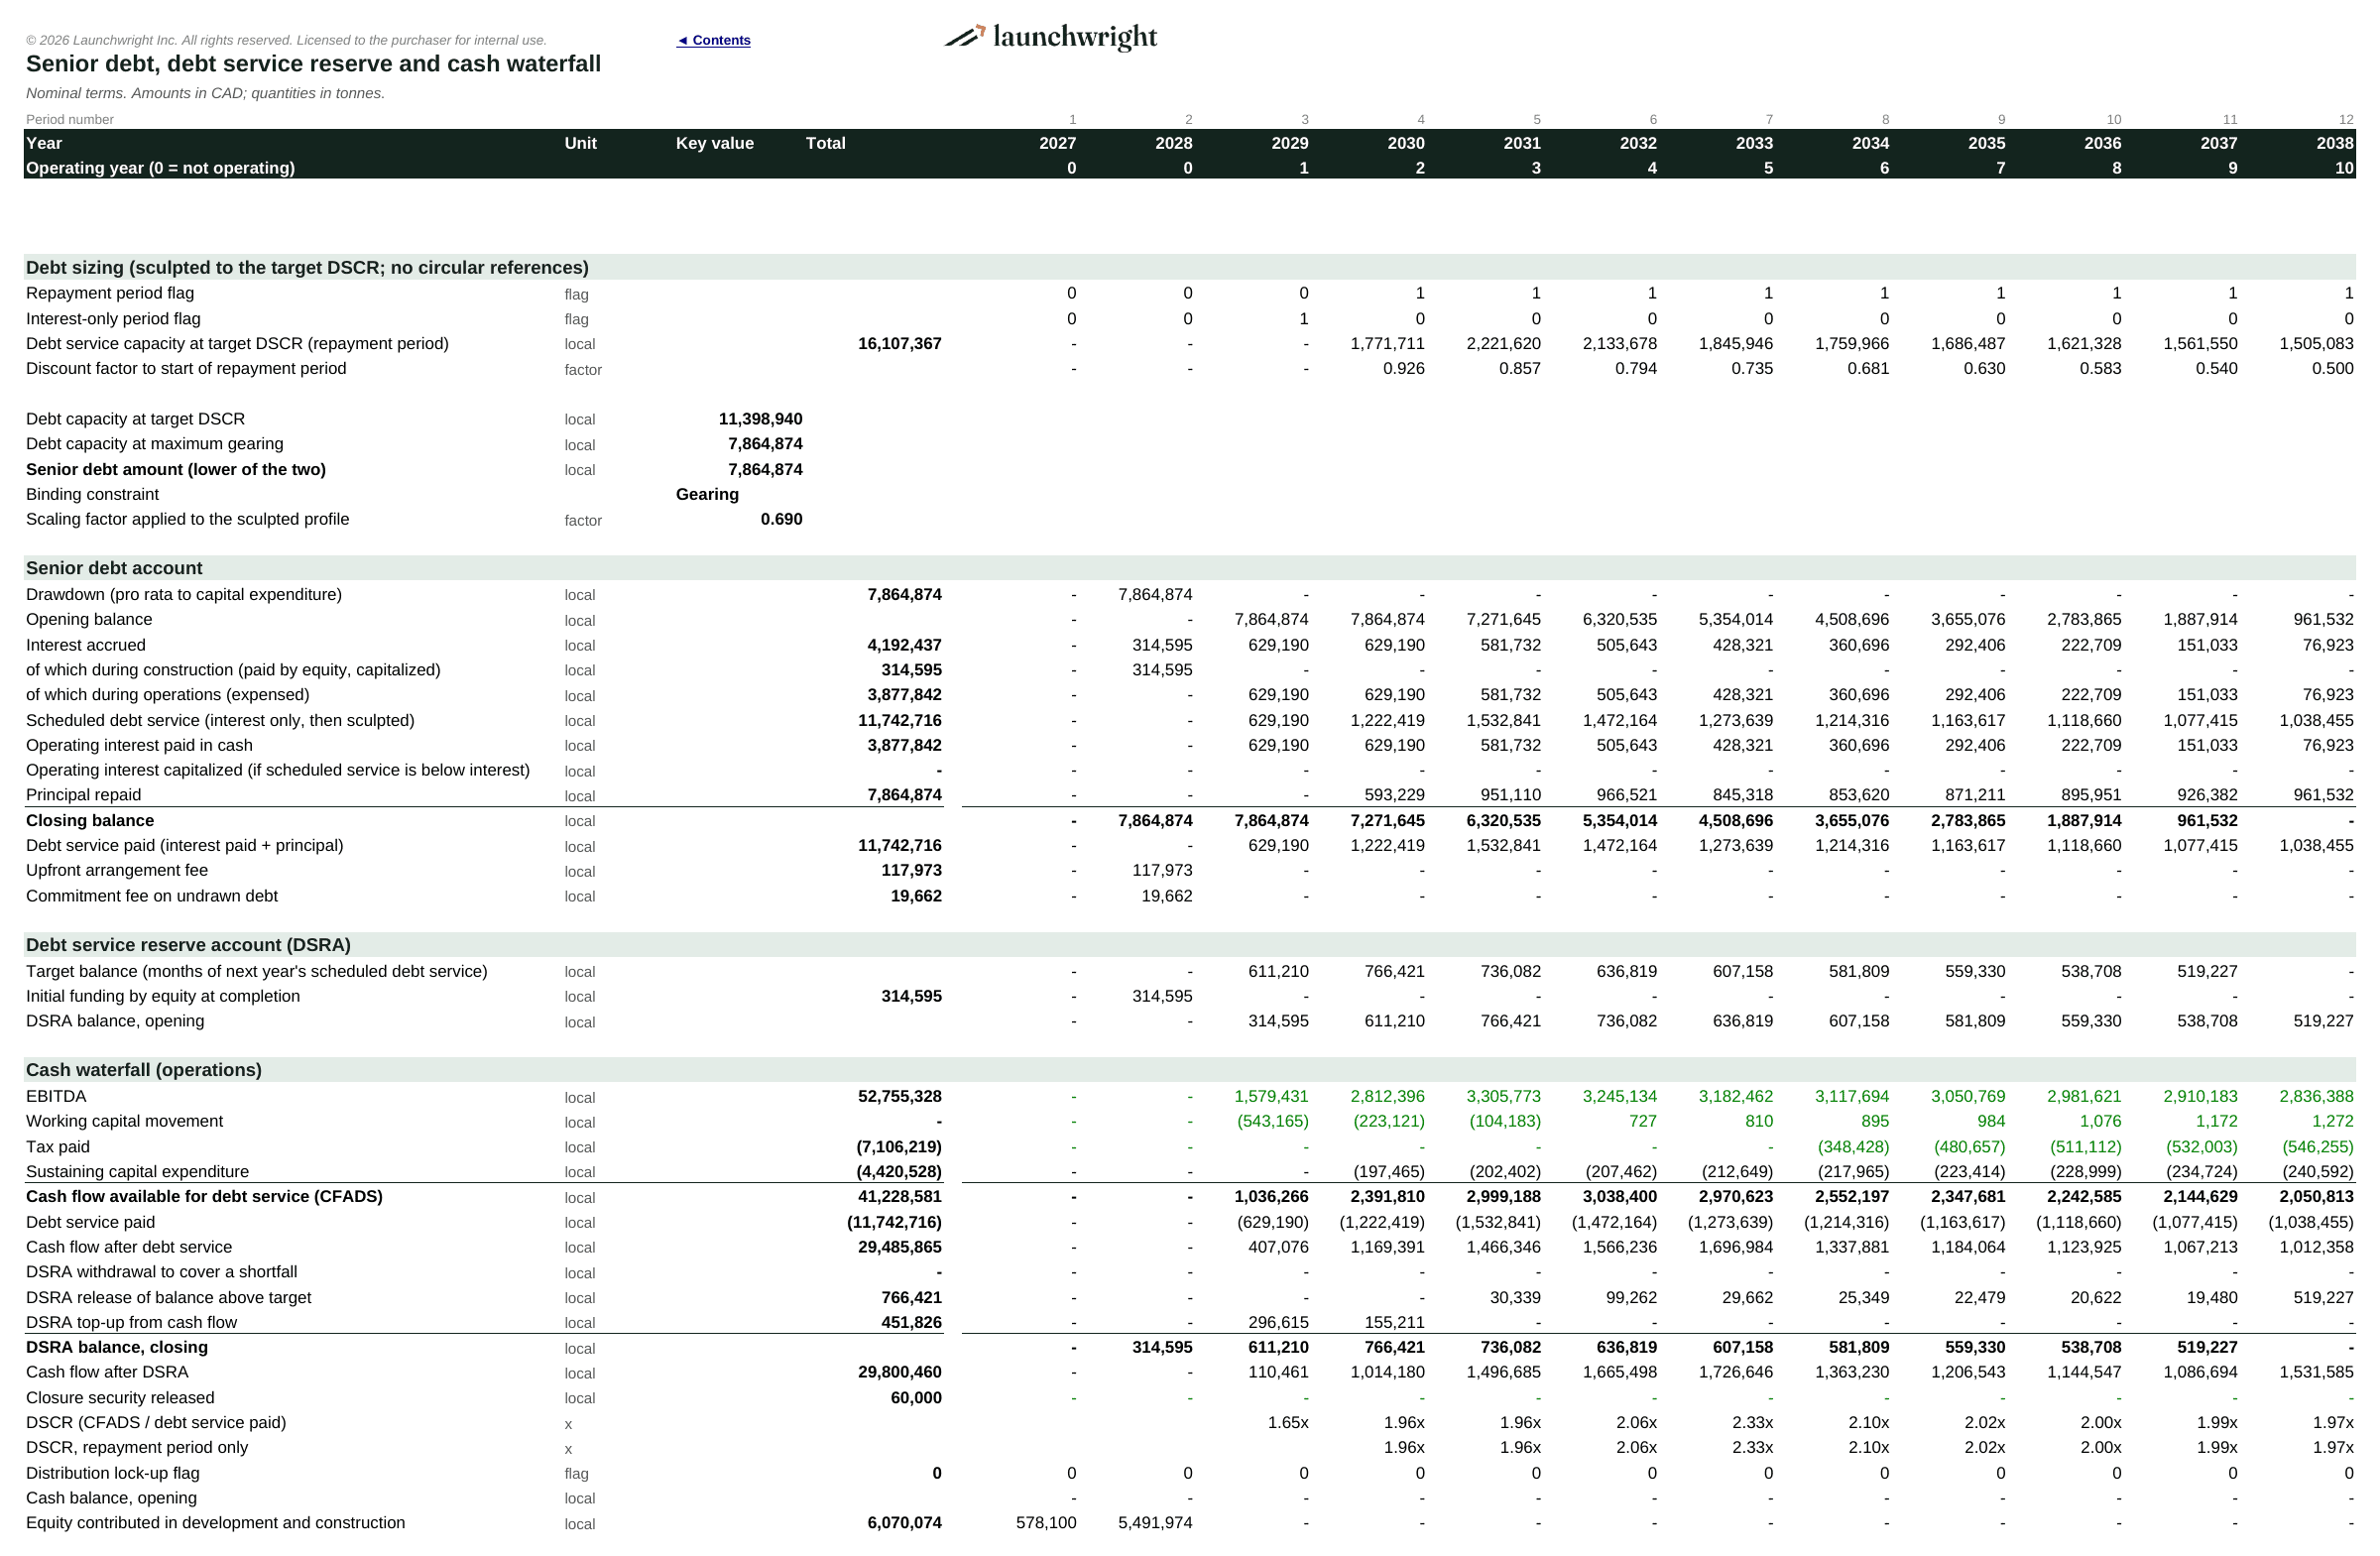
Planning a tire recycling plant that produces crumb rubber, or assessing one for investors or lenders? This Excel model turns your plant assumptions into a full financial case, and it is built around the question that decides most crumb rubber projects: what feedstock you start from and who pays for it.
Why this model
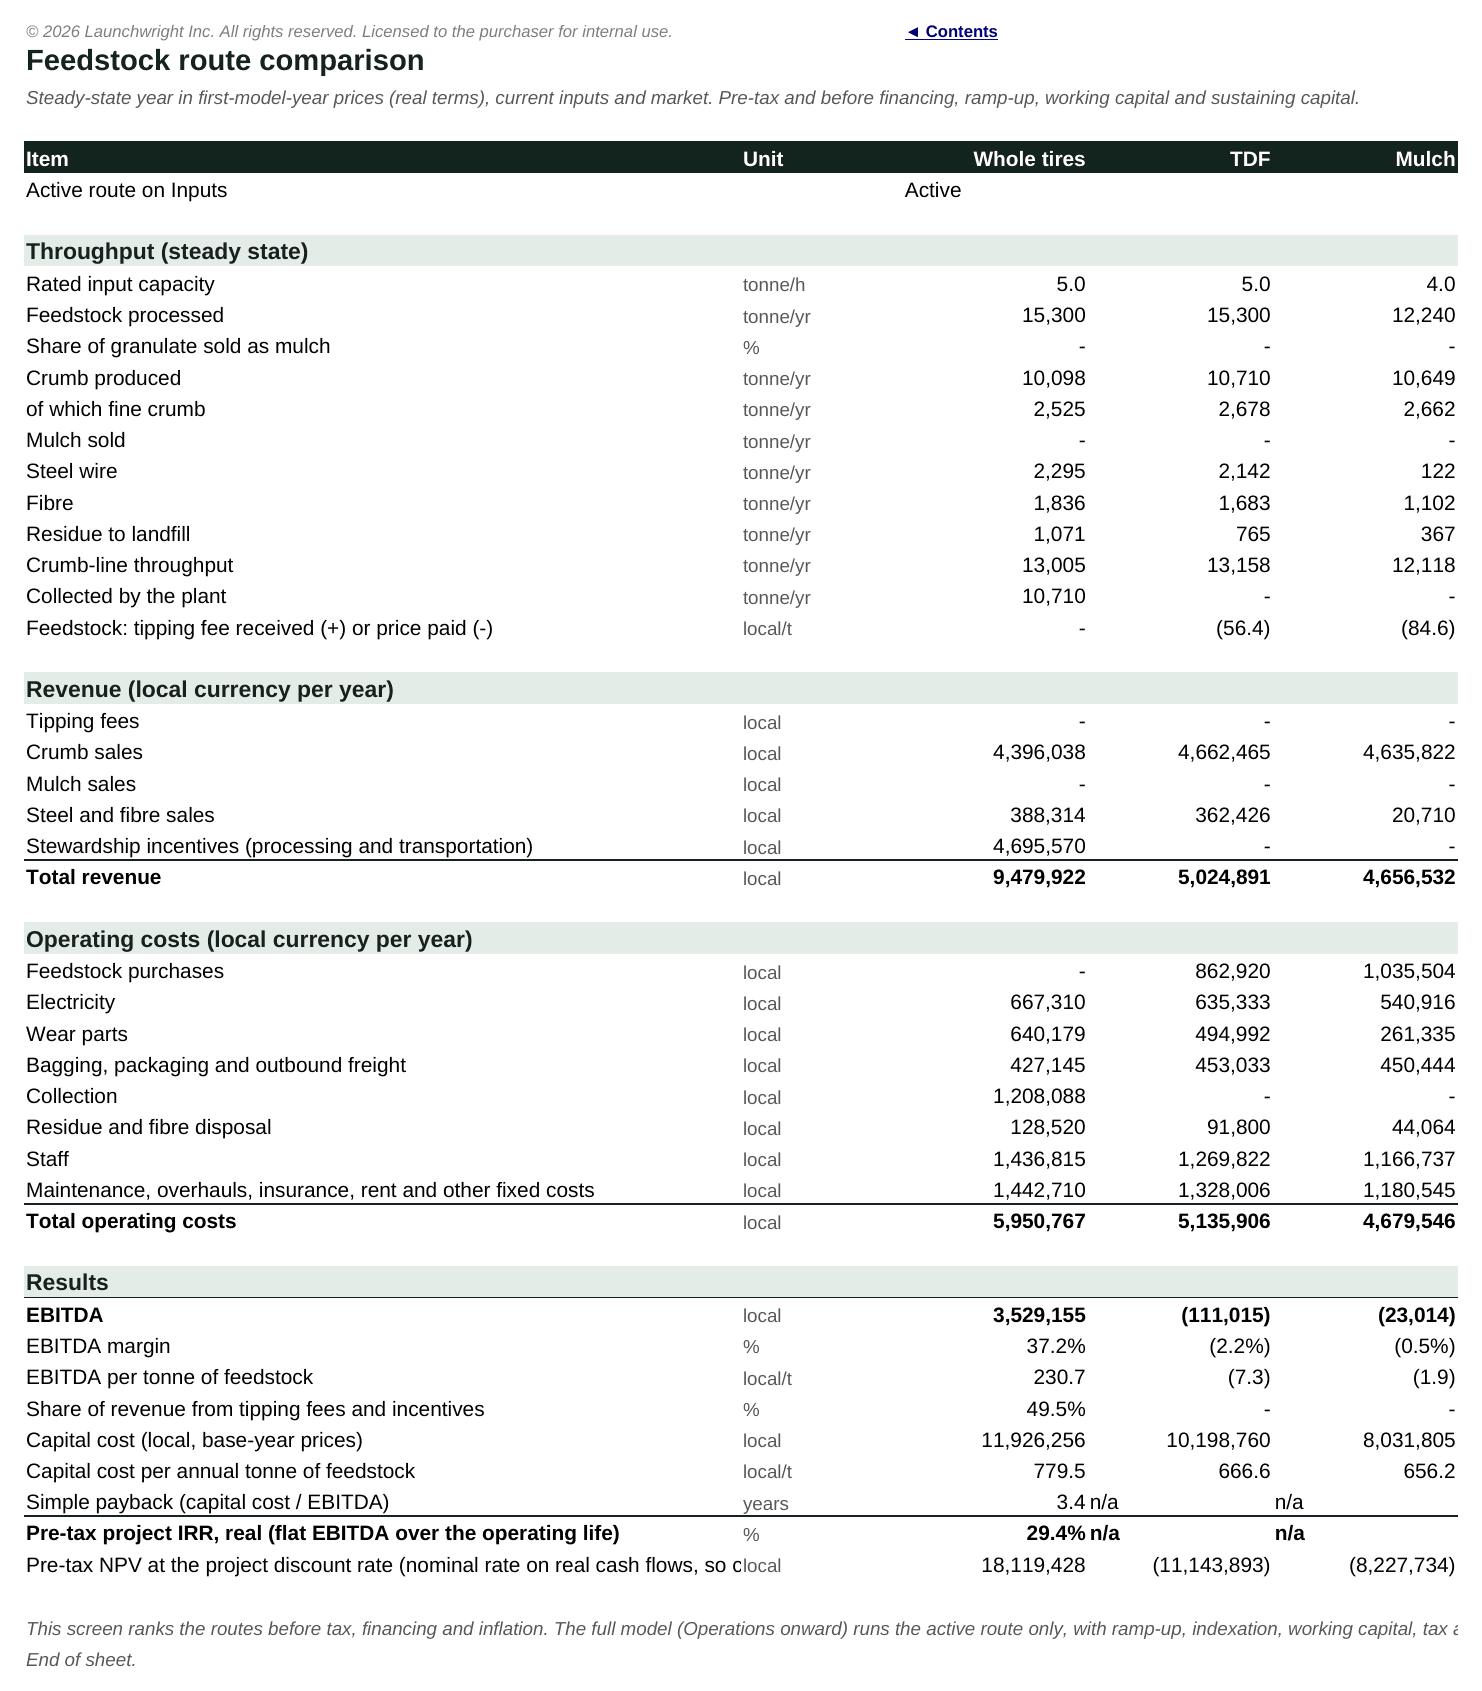
A crumb rubber plant does not have one business model. A plant that takes in whole tires usually gets paid to receive them, through a tipping fee or a stewardship incentive, but needs the full shredding front end. A plant that buys tire derived fuel (TDF) chips skips the primary shredder but pays for its feedstock. A plant that buys rubber mulch needs only the final crumb line. This model treats these as three feedstock routes with their own yields, process stages, power use, wear parts, staffing, building size and capital cost. Pick a route and every sheet follows; the Routes sheet shows all three side by side.
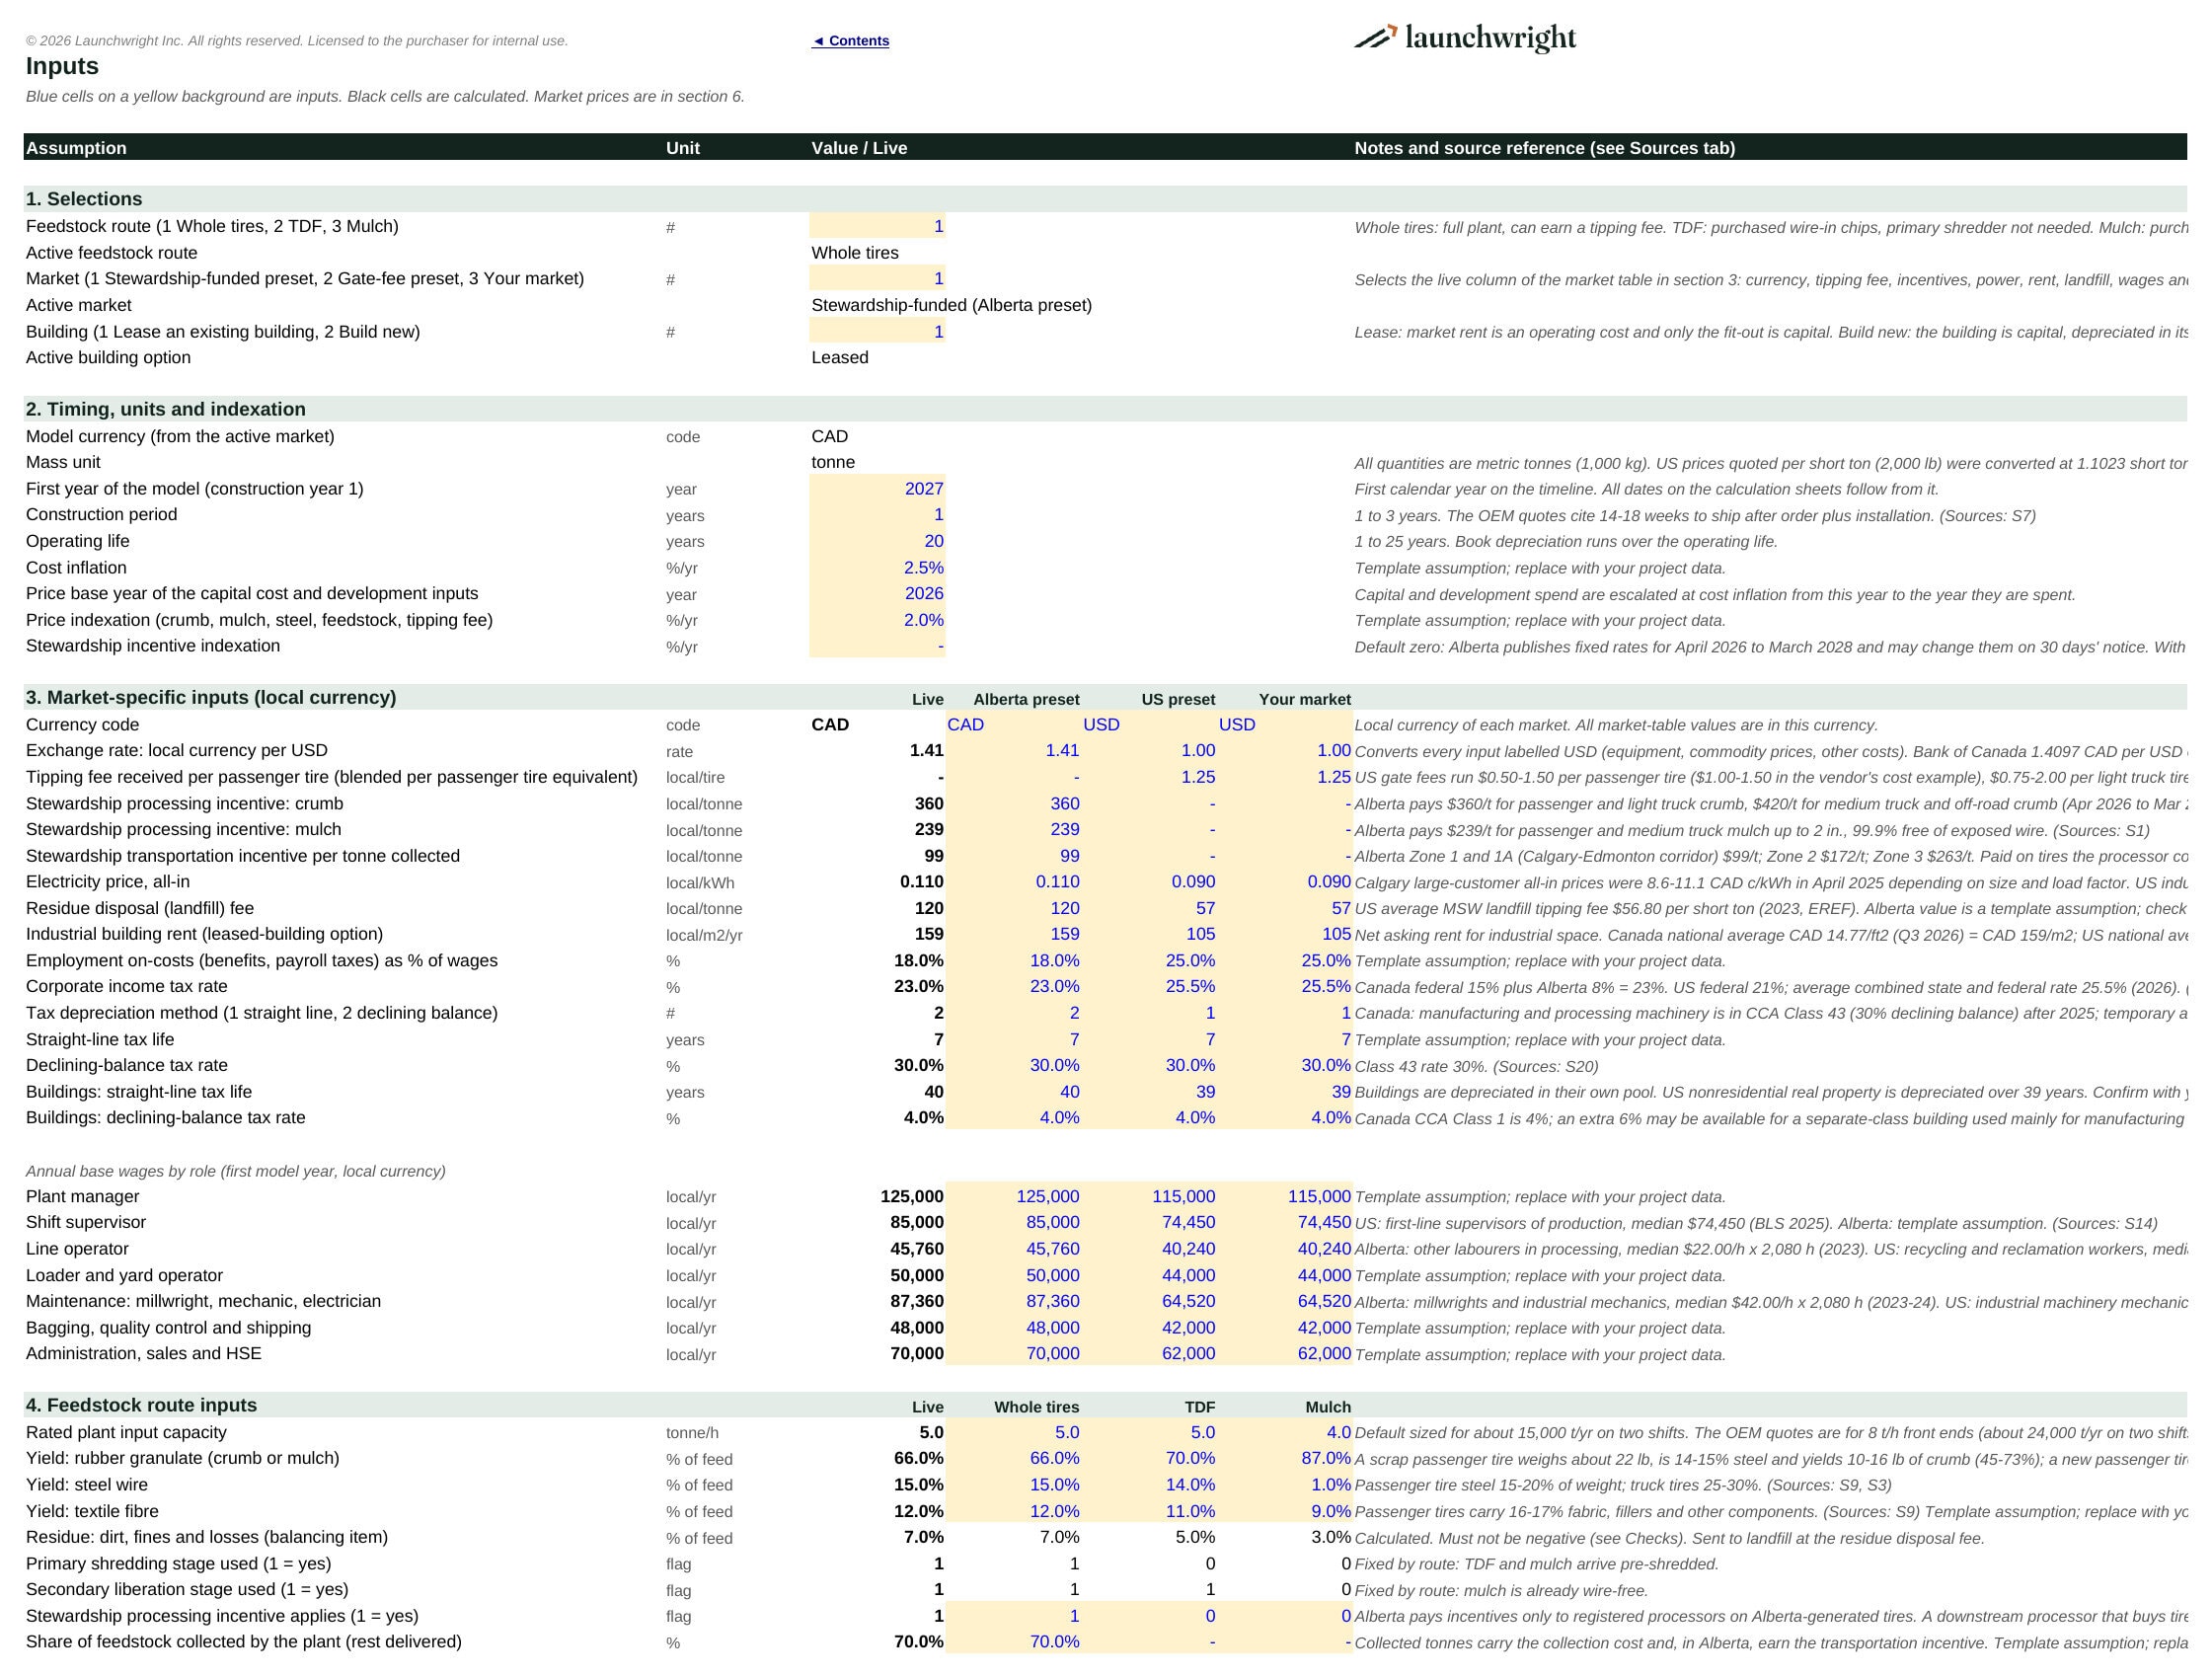
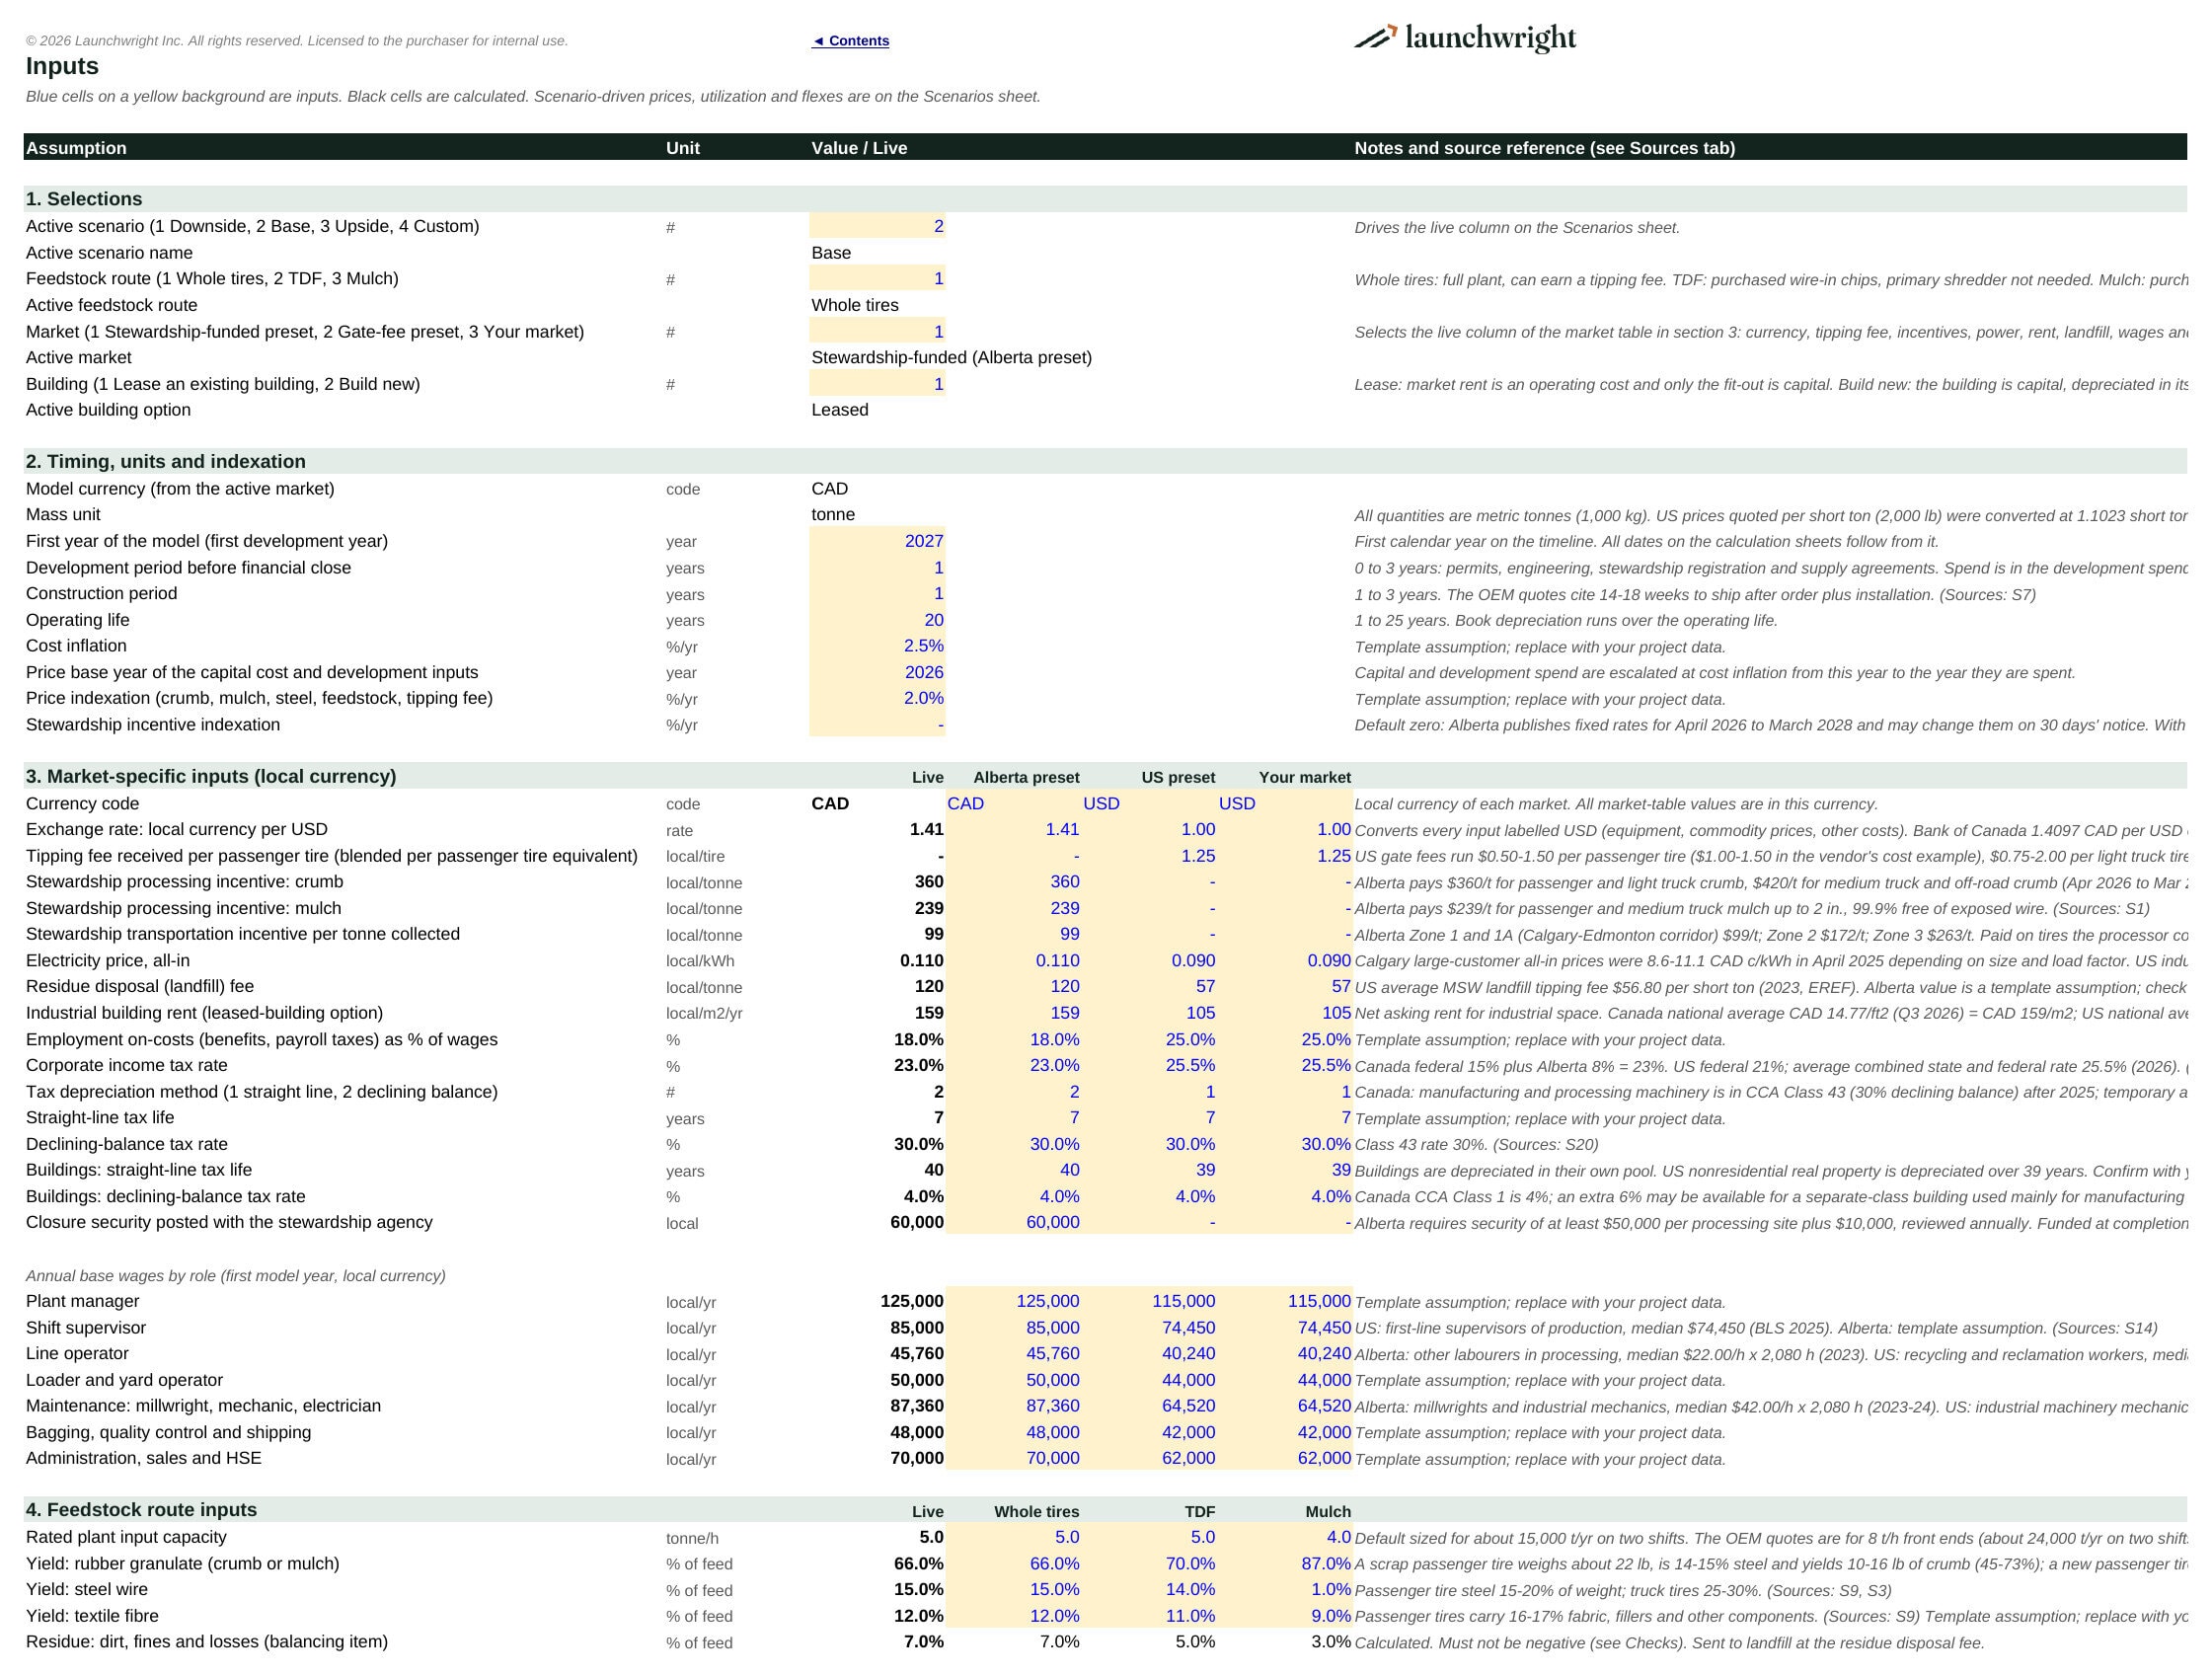
Revenue covers tipping fees per tire, stewardship processing and transportation incentives, coarse and fine crumb, mulch, steel wire and fibre. The model works in any market: it has a stewardship-funded preset built from a published incentive program (Alberta, in CAD), a gate-fee preset (United States, in USD) and a third column for your own market. Each column carries its own currency, tipping fee, incentives, power price, rent, landfill fee, wages and tax. You can also choose to lease an existing building (market rent, fit-out capitalized) or build new. Every preset value is an input you can overwrite.
Two editions
- Feasibility Edition: a fast, clear annual model for early screening. It covers the three feedstock routes, three market columns, a lease-or-build building option, a staged process and capital cost build, staffing by role, working capital, debt with interest-only years and level repayments, tax depreciation, three linked statements, returns and a dashboard.
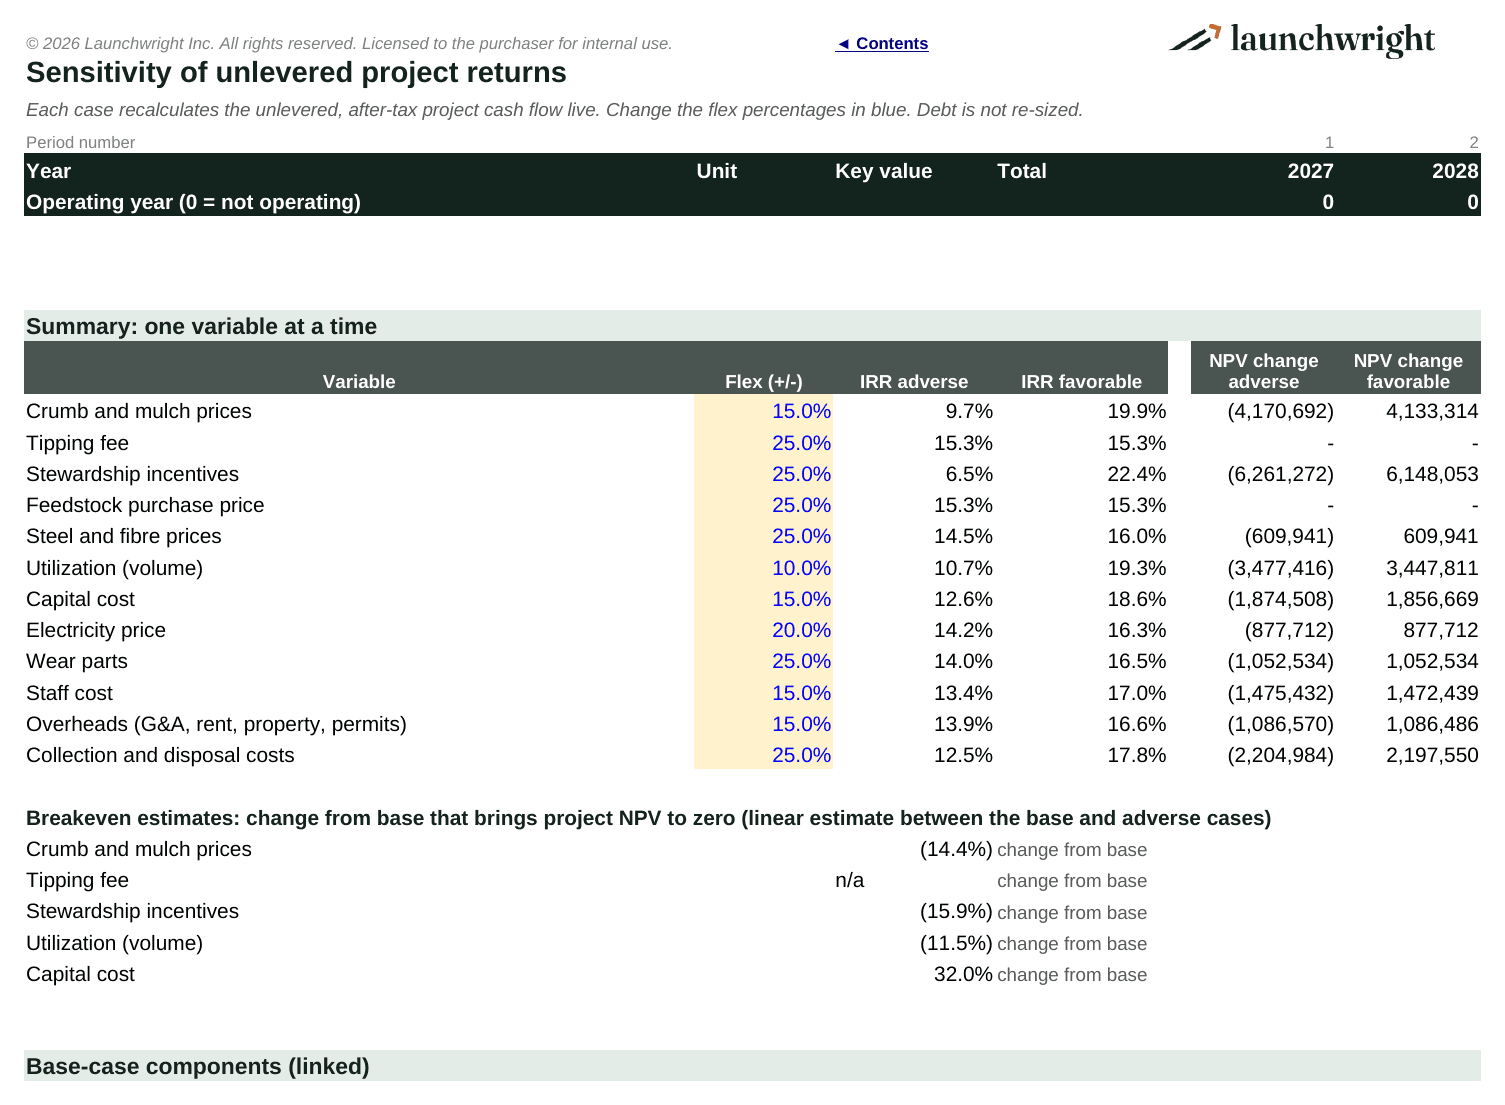
- Due Diligence Edition: everything in the Feasibility Edition, plus a development period with development spend, debt sized and sculpted to a target DSCR with no circular references, a debt service reserve account and distribution lock-up, closure security, LLCR and PLCR, four editable scenarios, and 12 live sensitivity cases with breakeven estimates and a tornado chart.
Key outputs
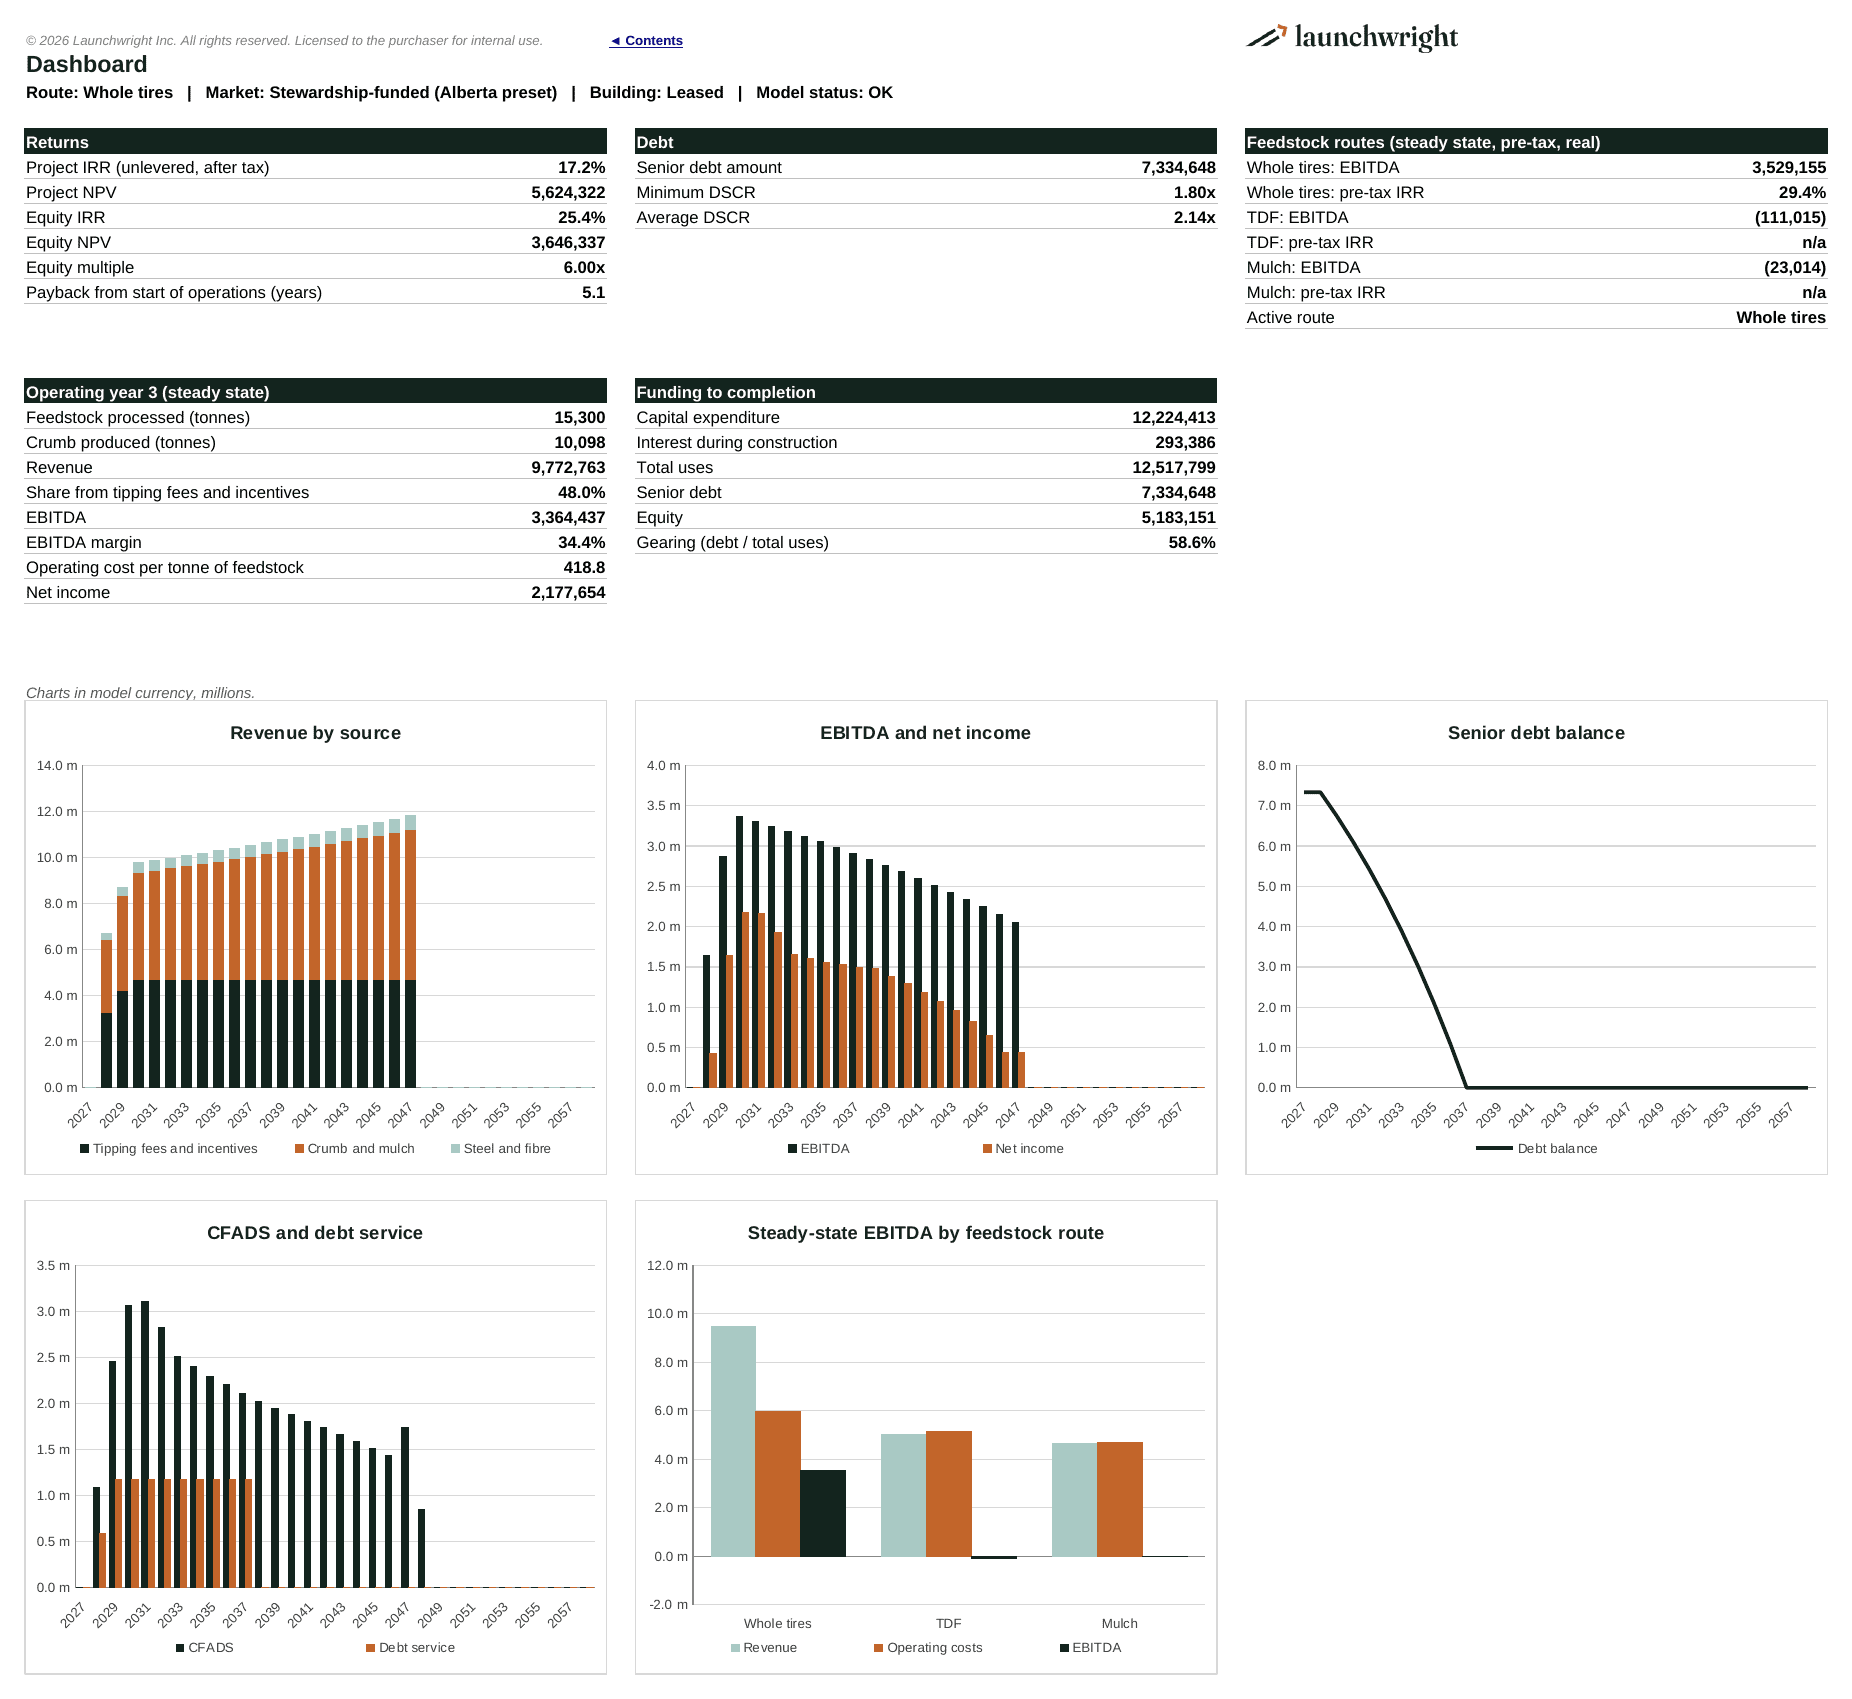
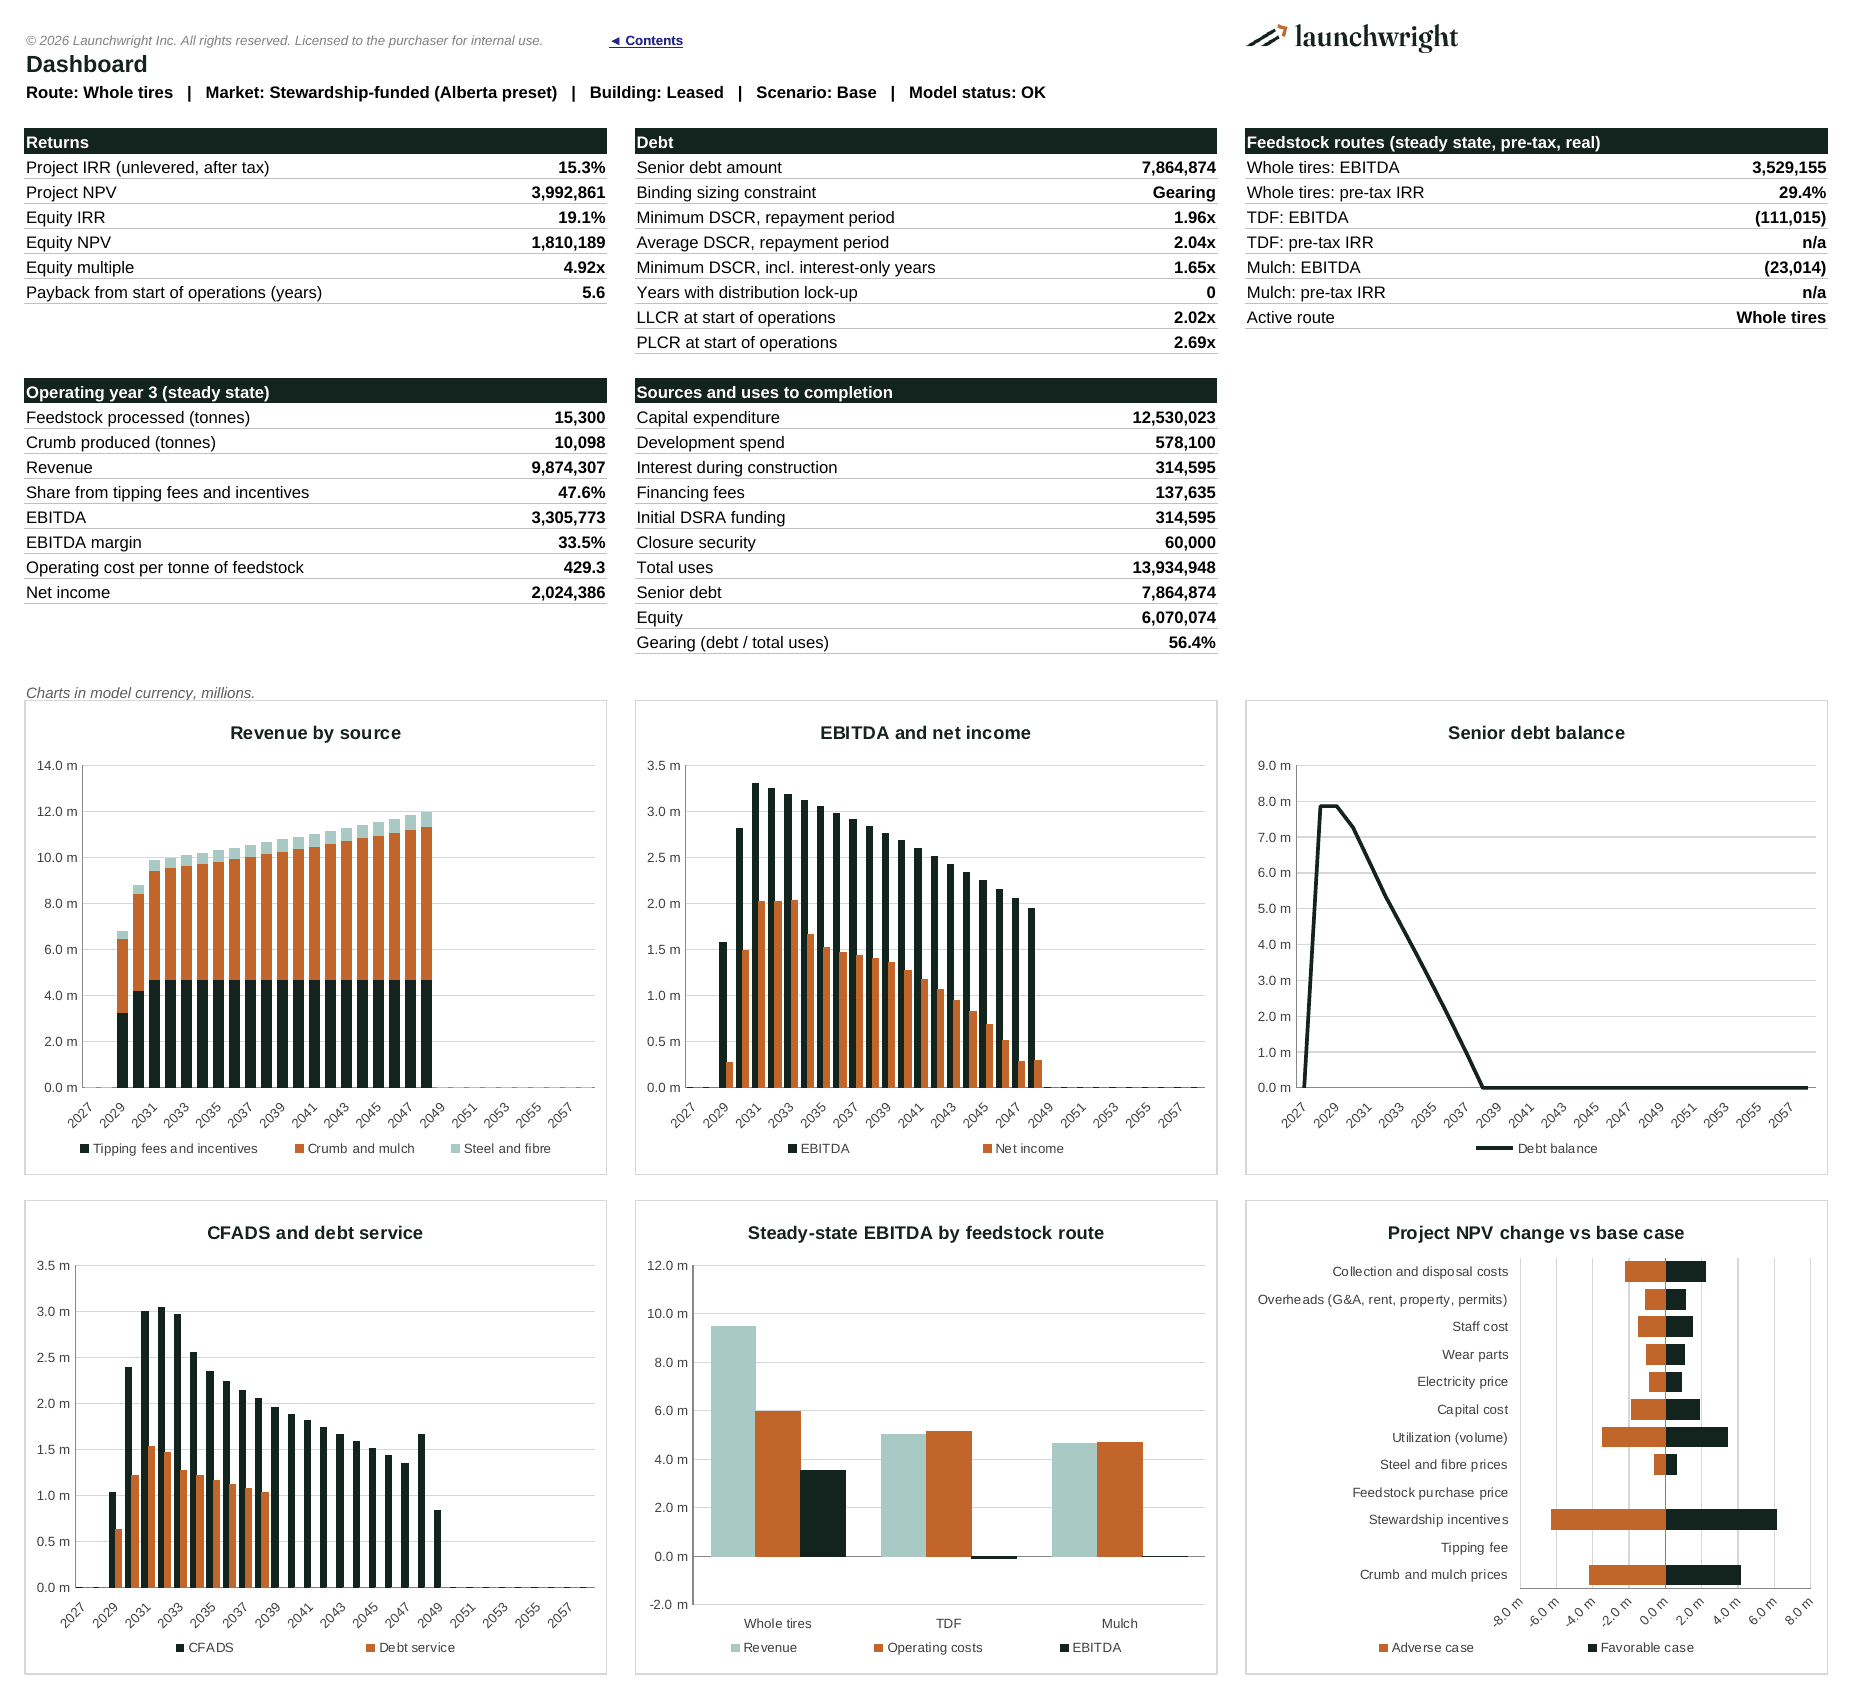
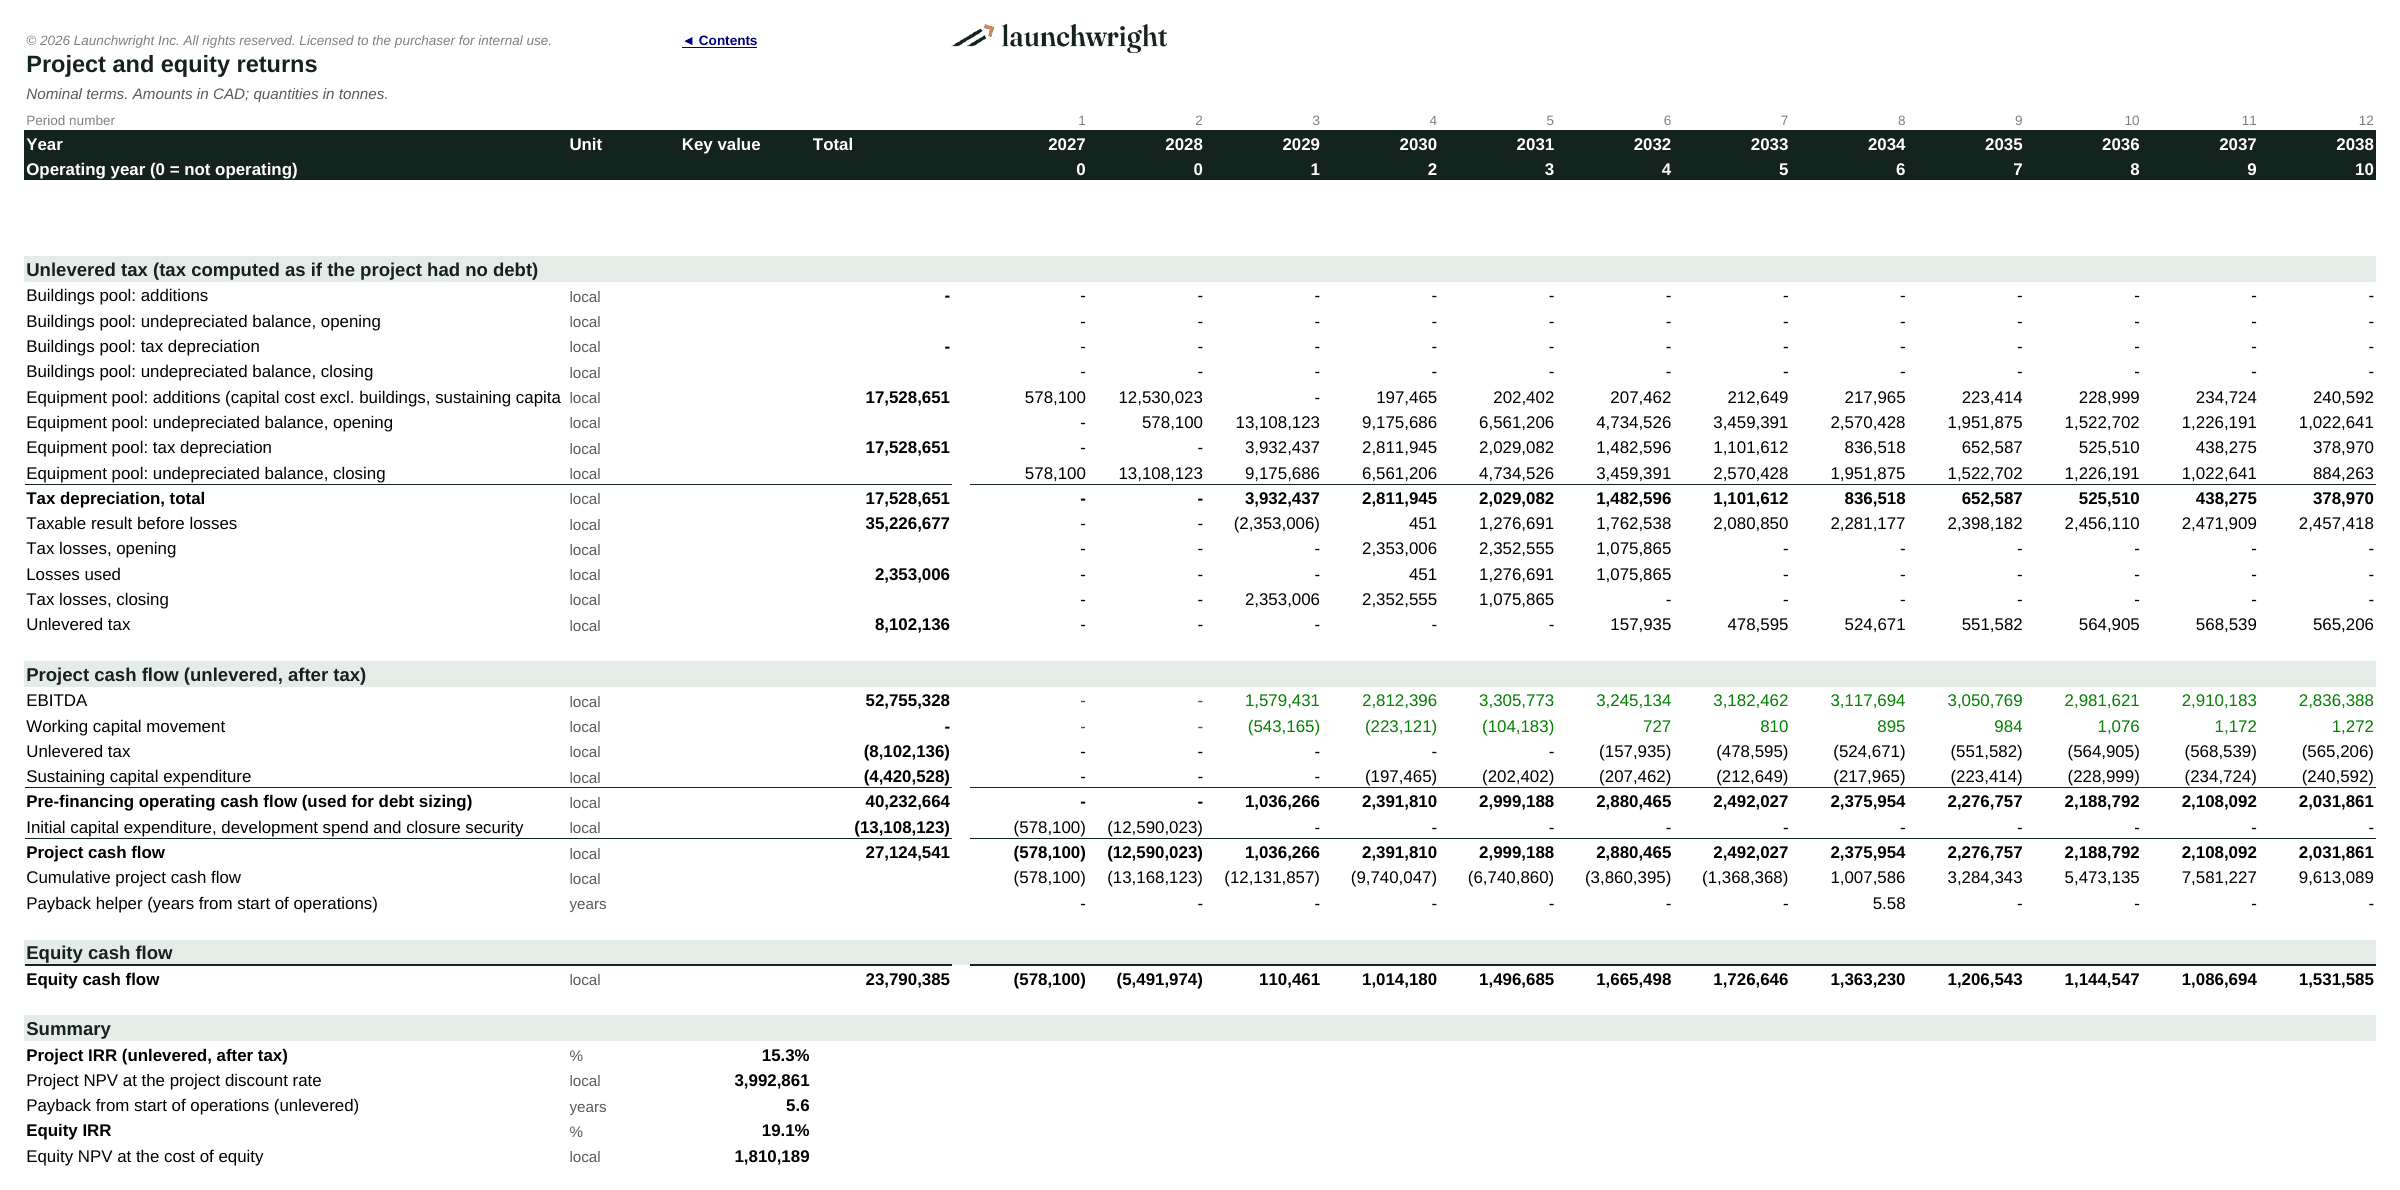
- Project IRR (unlevered, after tax), equity IRR, NPV, equity multiple and payback
- Senior debt amount and DSCR; binding sizing constraint, LLCR and PLCR in the Due Diligence Edition
- Steady-state comparison of the three feedstock routes: revenue, operating cost, EBITDA and pre-tax IRR
- Mass balance: crumb, fine crumb, mulch, steel, fibre and residue to landfill
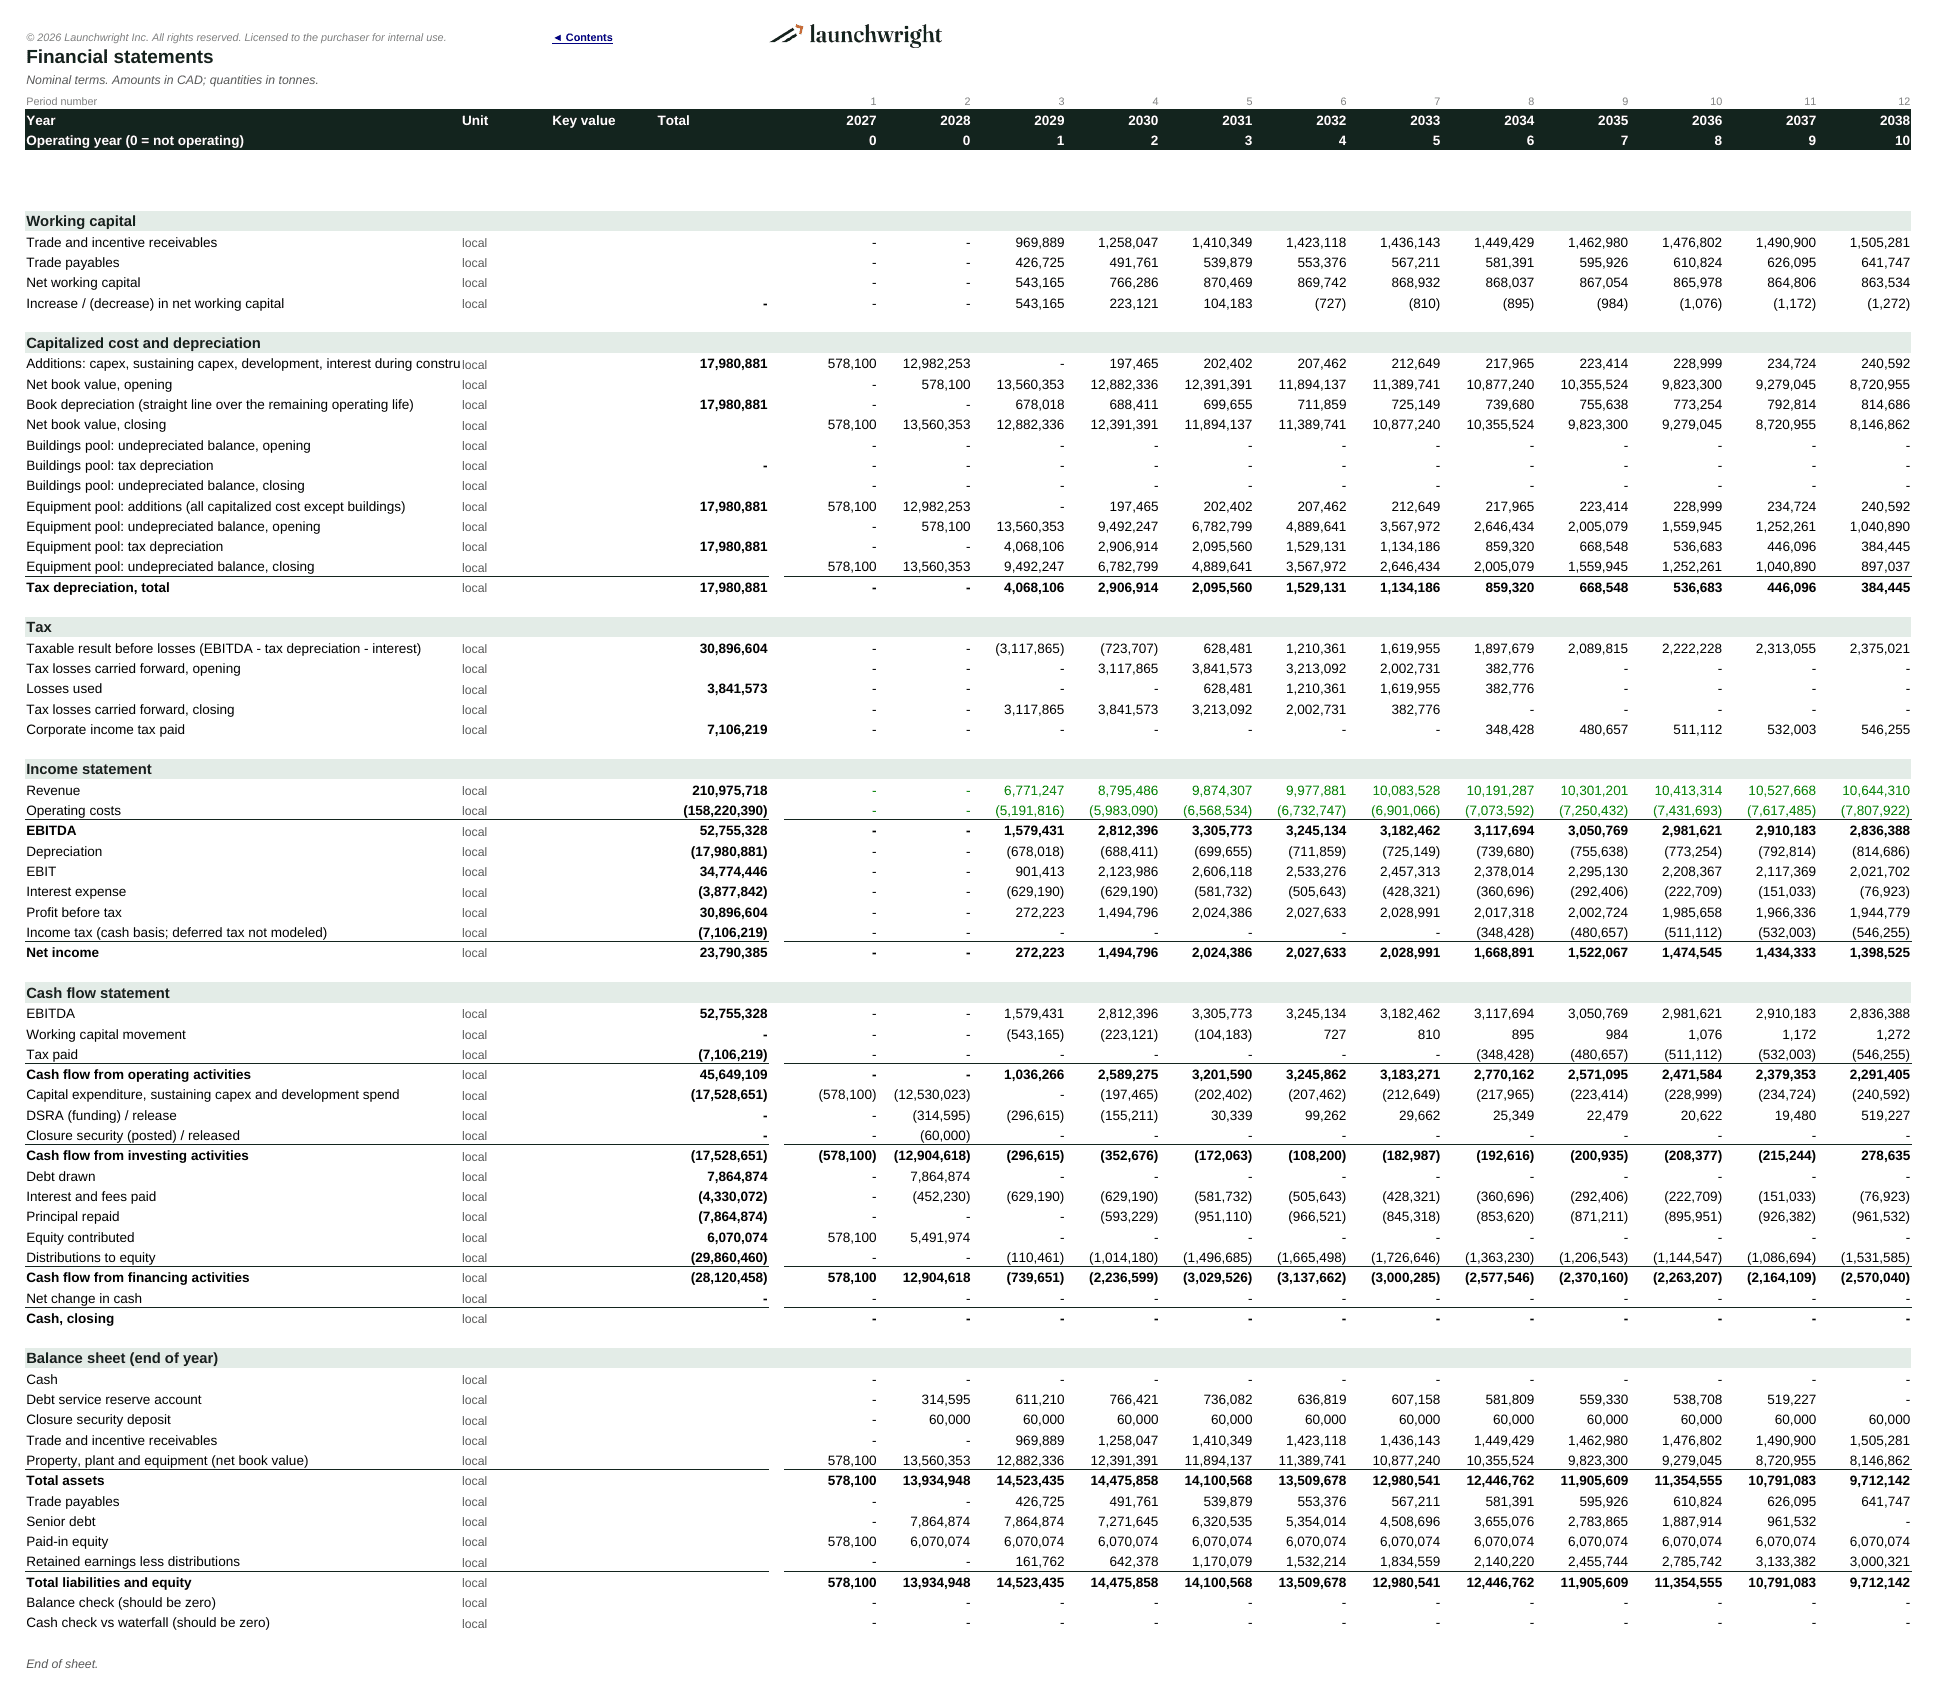
- Income statement, cash flow statement and balance sheet for every year, with a balance check
- Dashboard with revenue by source, EBITDA and net income, CFADS against debt service, debt balance and route comparison charts
Built to modeling best practice
- Inputs, calculations and outputs on separate sheets; inputs in blue on yellow, formulas in black
- Consistent formulas across every year; start year, inflation and capital cost base year are inputs
- Capital cost built by process stage and scaled to plant capacity, plus freight, installation, electrical service, building or fit-out, site works, engineering, owner’s costs and contingency; sustaining capital over the life
- Tax depreciation in two pools (buildings and equipment), straight line or declining balance, with losses carried forward
- No macros, no circular references, no hidden or protected sheets, no external links
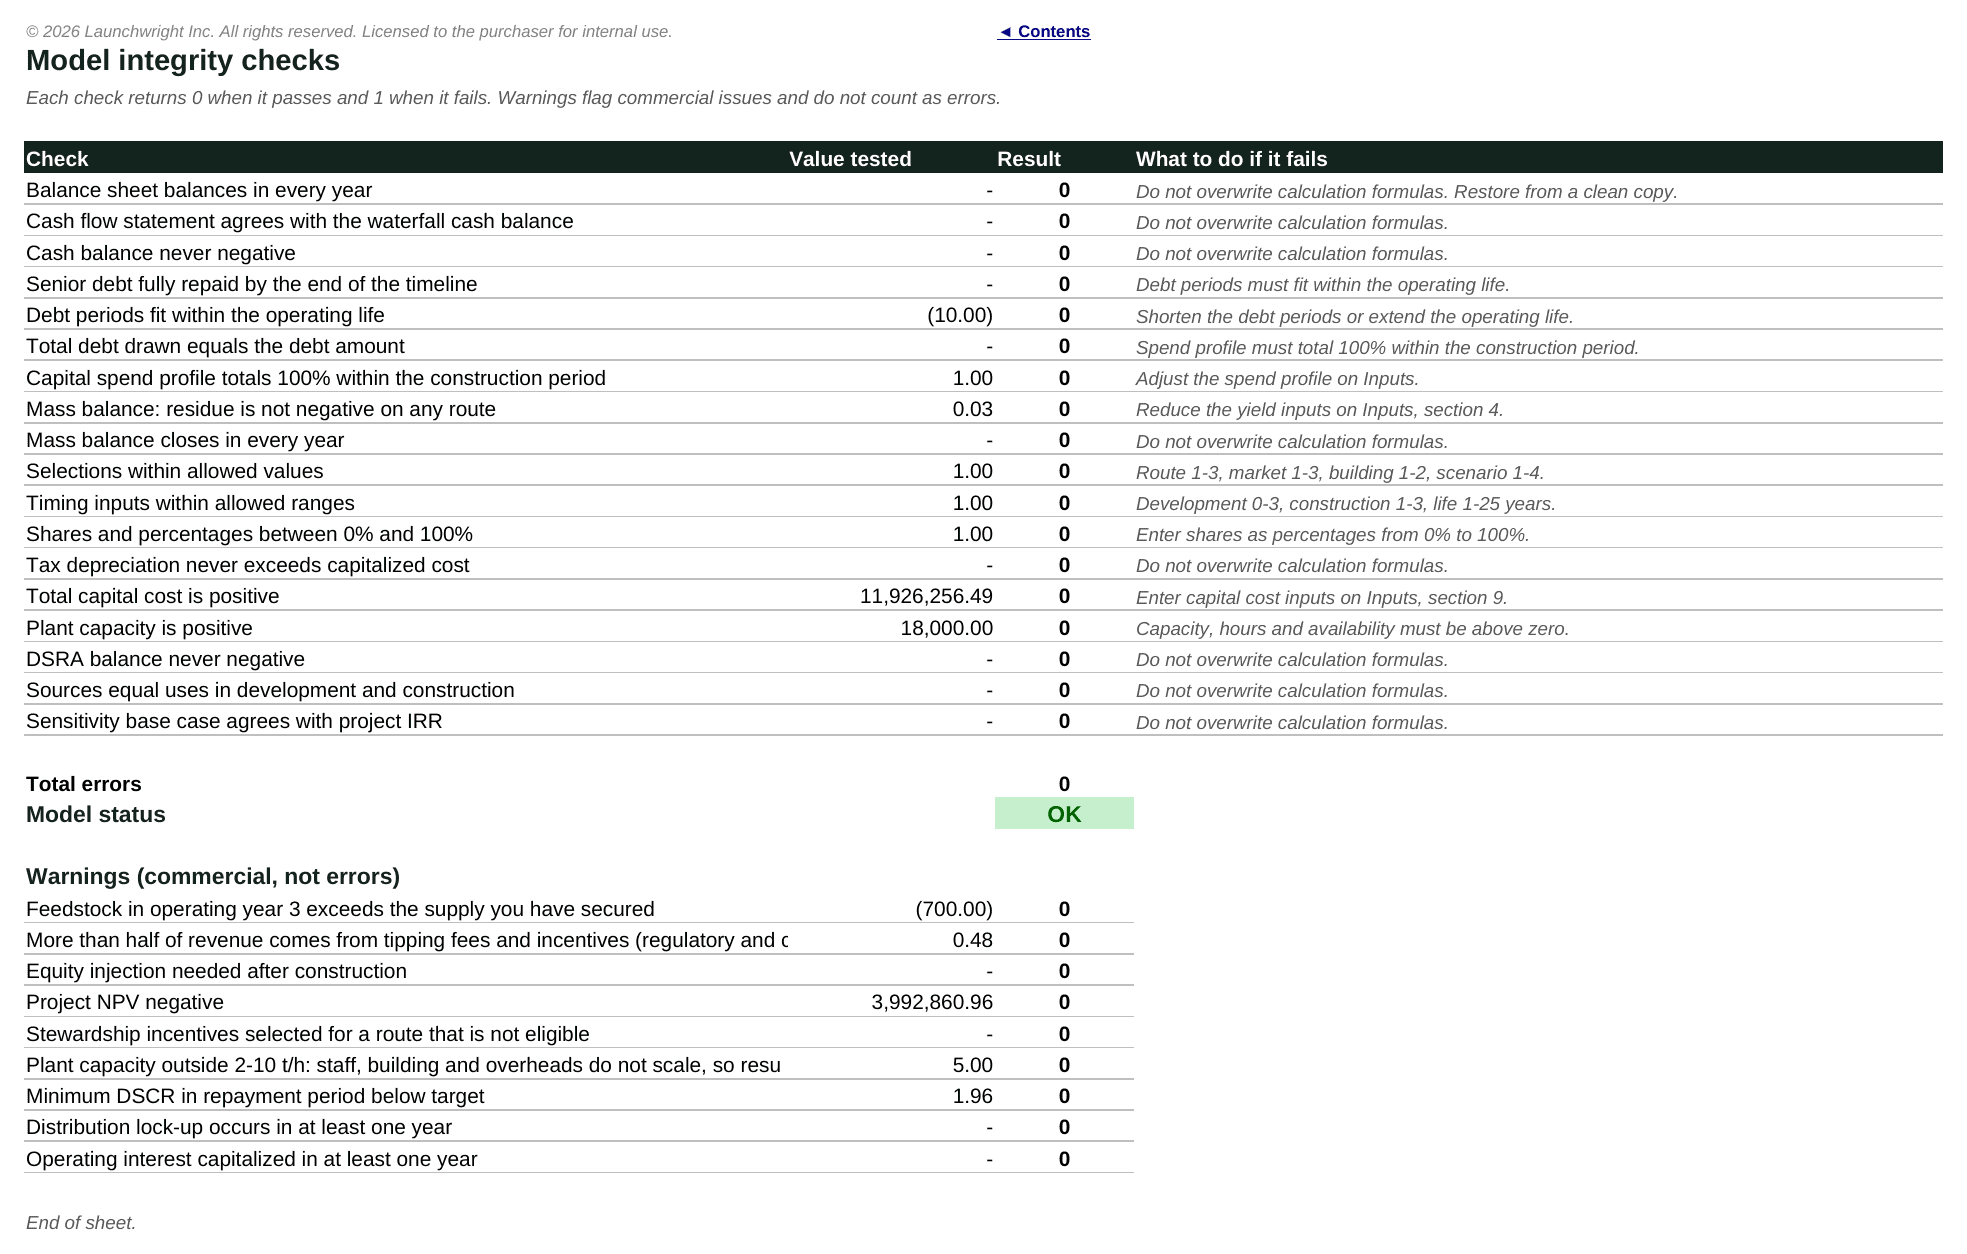
- Checks sheet confirms the balance sheet balances, cash never goes negative, debt is repaid, the mass balance closes and selections are valid; warnings flag commercial risks such as reliance on incentives
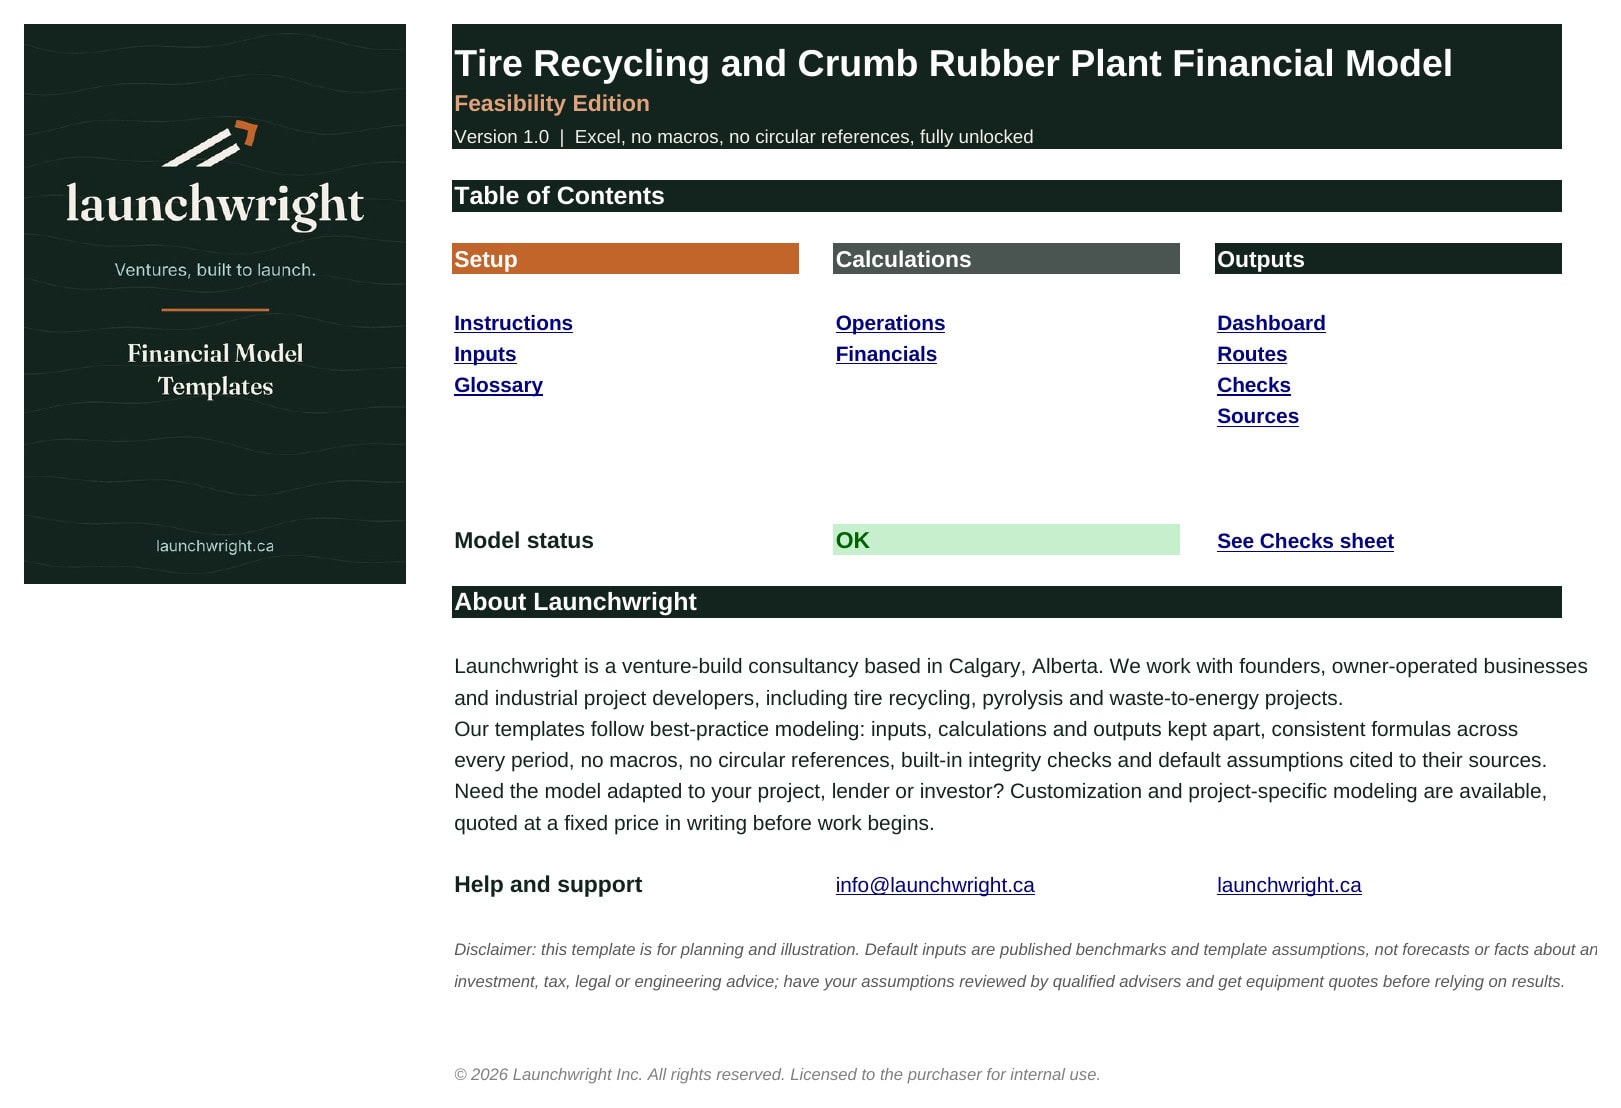
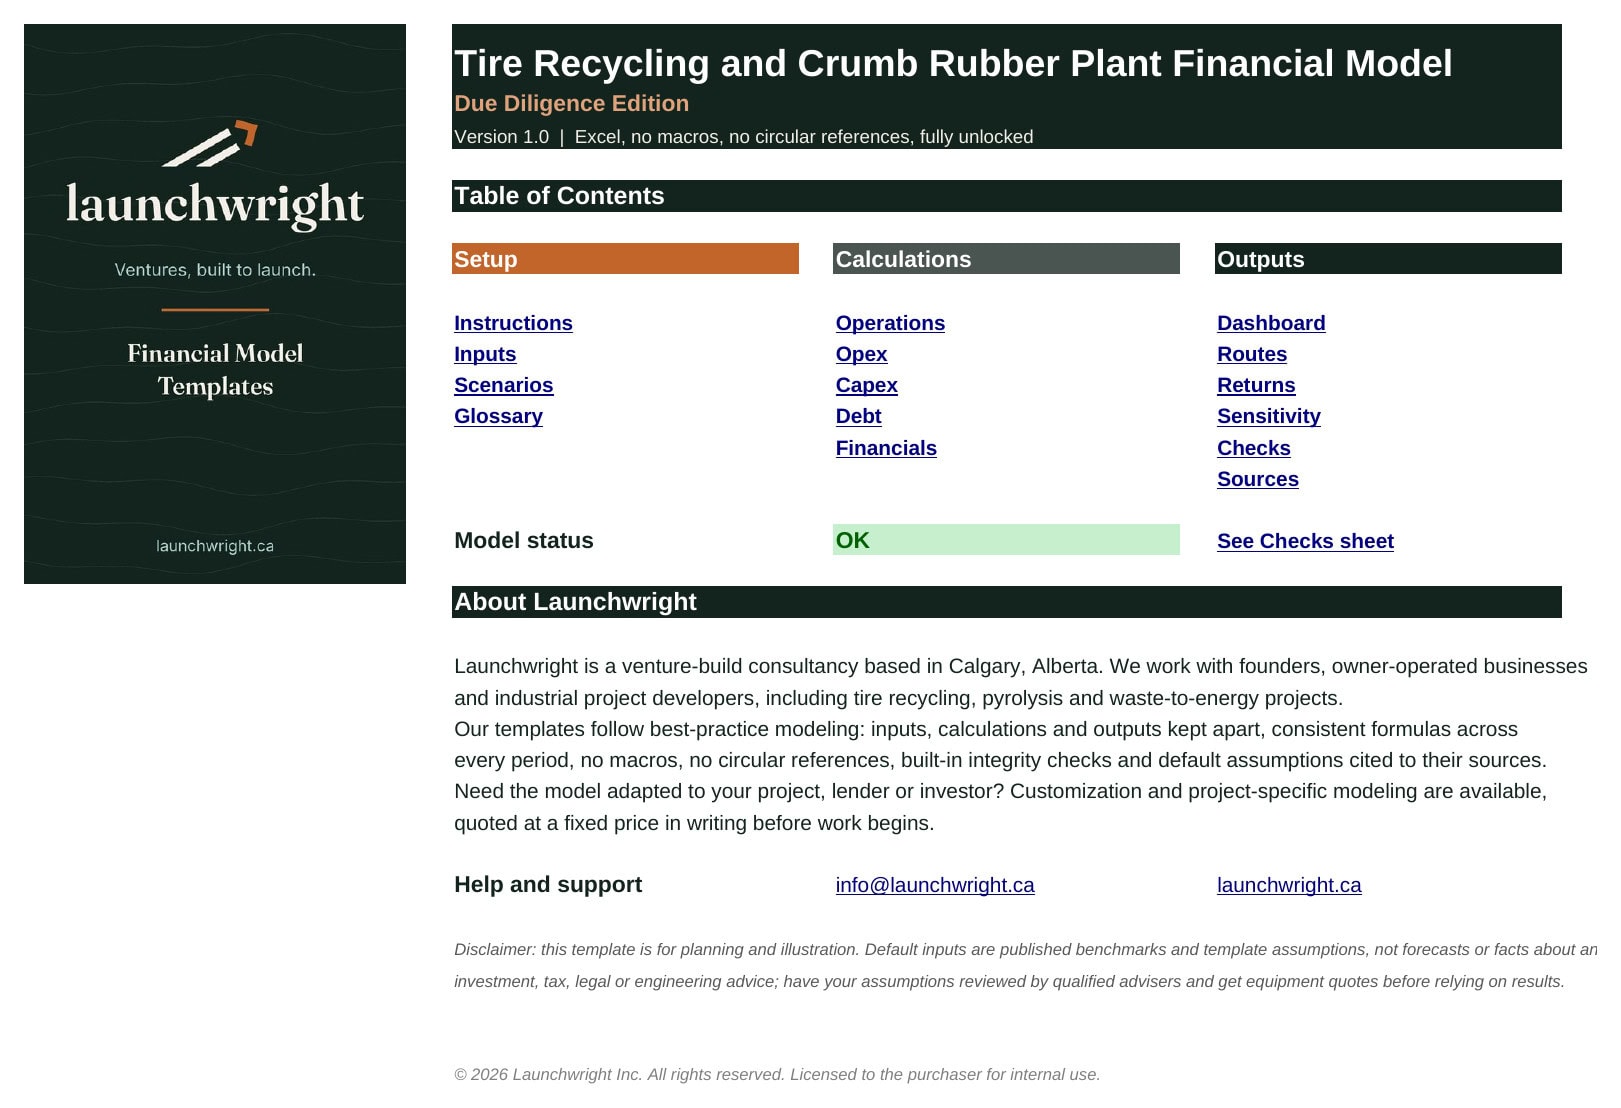
- Contents sheet with links, step-by-step instructions, a glossary and a full source list
Timeline
Annual periods. Up to 3 development years (Due Diligence Edition), 1 to 3 construction years and up to 25 operating years, with a ramp-up over the first two operating years. Product prices, operating and capital costs, and stewardship incentives escalate at separate rates.
Default assumptions
Defaults describe a 5 tonne-per-hour whole tire plant in a leased building, running two shifts, 250 days a year, processing about 15,300 tonnes a year and producing about 10,100 tonnes of crumb. Front-end equipment is calibrated to two OEM shredding line quotations scaled down from 8 tonnes per hour; total capital cost is about CAD 11.9 million (USD 8.5 million) in 2026 prices. Prices, wages, power, rent and tax come from published sources listed in the model. In the stewardship-funded preset the base case returns about 15% unlevered after tax and 19% to equity in the Due Diligence Edition, with incentives close to half of revenue; crumb prices would have to fall about 14%, or incentives about 16%, before project NPV reaches zero. The gate-fee preset at $1.25 per tire and the TDF and mulch routes do not repay their capital at the defaults. The model shows this rather than hiding it, so you can test what tipping fee, crumb price or feedstock price your market needs.
What you get
- One Excel workbook (.xlsx) for the edition purchased, built only with functions available since Excel 2010 (no dynamic arrays, no macros)
- A free PDF demo showing the main sheets of the Due Diligence Edition
Support and customization
Questions about how the template works are answered by email. Launchwright can also adapt the model to your project, region, lender or investor requirements.
Similar ProductsOther customers were also interested in...


 eFinancialModels
Electric Vehicle (EV) Charging Station Financial M...
With this comprehensive 5- or 10-year monthly tool, investors can assess the viability of setting up... Read more

Financial Model for Mobile App | Mobile App Busine...
The Mobile App Financial Plan Template in Excel allows you to develop financial projections when lau... Read more

 HenrySheykin
Food Truck Financial Model Excel Template
The Food Truck Financial Model helps entrepreneurs, founders, business owners, consultants, and anal... Read more

Green Hydrogen Production from Wind Energy Financi...
The Green Hydrogen from Wind Financial Model aims to comprehensively forecast a horizon of 40 years ... Read more

Simple Mutual Non-Disclosure Agreement Template
Protect your business secrets with ease using our Simple Mutual Non-Disclosure Agreement Template. S... Read more

Solar Energy Financial Model
The Solar Energy Financial Model Spreadsheet Template in Excel assists you in preparing a sophistica... Read more

 Peter Graf
The Customer-Centric Financial Model for Restauran...
Starting a restaurant without a financial plan is like driving a car blindfolded. You wouldn´t do i... Read more
You must log in to submit a review.