
0 ITEMS

Snail Farm Financial Model Excel Template
The Snail Farming Financial Model helps entrepreneurs, business owners, consultants, analysts, and farm planners turn a commercial heliculture concept into a structured financial forecast. Instead of estimating profitability from scattered notes or generic spreadsheets, users can work from a ready-to-use financial model template built around the practical economics of snail breeding, juvenile sales, harvested snails, processed escargot products, operating costs, and long production cycles. It supports financial planning by organizing the key assumptions needed to assess startup costs, revenue potential, operating expenses, payroll, cash flow, profitability, and funding requirements before major investment decisions are made. This template is designed for people preparing business plans, investor presentations, loan applications, grant proposals, or internal expansion plans for a snail farming operation. It allows users to edit assumptions such as breeding stock, production volume, survival rates, selling prices, product mix, feed costs, packaging costs, labor needs, facility costs, and working capital requirements. By connecting these drivers into one model, the template helps users understand how operational choices affect revenue, margins, monthly cash flow, and long-term financial performance. The Snail Farming Financial Model is especially useful for evaluating the slow ramp-up period that is common in agriculture and livestock-style operations. It helps users estimate the initial capital needed for farm setup, pens, hatchery equipment, processing machinery, and launch expenses while also forecasting the ongoing costs required to operate until sales volumes mature. With integrated profitability views, break-even analysis, cash flow forecasting, and decision-making outputs, the model helps identify whether the business can support its cost structure and when it may become financially sustainable. Built with an investor-ready structure, editable inputs, automated calculations, and visual outputs, the template saves time compared with building a forecast from scratch or hiring a custom analyst. Users can test low, base, and high scenarios, review performance metrics, prepare lender-friendly reports, and present a clearer financial story to stakeholders. Whether used for a new snail farm, an escargot production venture, a value-added food operation, or an expansion of an existing agricultural business, this financial model template provides a practical foundation for planning, budgeting, funding, and confident decision-making.
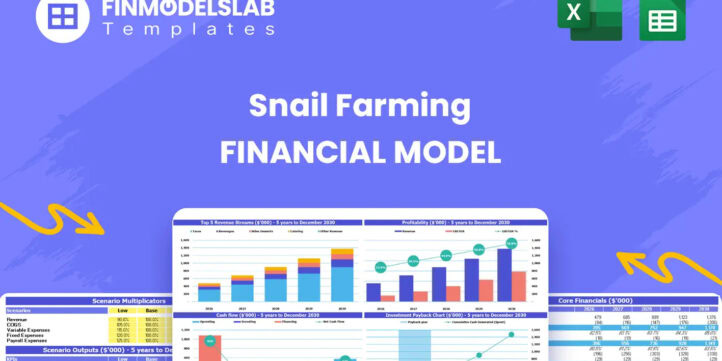


Financial Model Overview
The Snail Farming Financial Model is a ready-to-use financial model template built to help entrepreneurs, farm owners, consultants, analysts, and funding applicants evaluate the economics of a commercial snail farming operation. Snail farming has unique planning requirements because revenue depends on biological production cycles, breeding stock, survival rates, grow-out timelines, product mix, processing capacity, and market pricing. This model brings those variables together in a structured forecast so users can estimate revenue, startup investment, operating expenses, payroll, cash flow, profitability, break-even timing, and long-term funding needs. It is designed to support business planning, investor discussions, bank loan applications, internal budgeting, and expansion decisions. The template is editable, presentation-ready, and built to help users replace guesswork with a clear view of how a snail farming venture may perform under realistic assumptions.
All-in-One Dashboard
The all-in-one dashboard provides a central view of the most important inputs and outputs in the Snail Farming Financial Model. It is designed to help users quickly understand the financial position of the business without manually searching through every worksheet or calculation tab. This section may summarize core assumptions such as starting breeding stock, production scale, selling prices, revenue mix, startup investment, payroll, operating expenses, and financing structure, while also displaying outputs such as total revenue, gross margin, EBITDA, net profit, cash balance, payback period, and investor return metrics. For a snail farming business, this is especially useful because many decisions are connected. A change in survival rate, feed cost, or the percentage of snails sold as value-added products can affect revenue, cost of goods sold, cash flow, and profitability at the same time. The dashboard helps users review the overall business case, identify areas that require attention, and communicate the financial story to partners, lenders, or investors in a concise and professional format.
Low, Base, and High Scenario Analysis
The low, base, and high scenario analysis section helps users compare different financial outcomes based on changing assumptions. A snail farming operation can be affected by market prices, mortality rates, offspring per cycle, feed efficiency, labor requirements, production delays, and demand for live, purged, processed, or packaged snail products. This component allows users to evaluate conservative, expected, and optimistic cases within the same financial model. In a low case, users may test the impact of lower selling prices, higher mortality, slower production ramp-up, or increased operating expenses. In a base case, they can work from their most realistic planning assumptions. In a high case, they can model stronger yields, better pricing, improved cost control, or faster growth in wholesale and retail demand. The output helps users understand revenue range, cash flow pressure, profitability potential, funding needs, and break-even timing under different conditions. This is valuable for decision-making because it shows whether the business remains viable if assumptions change and helps stakeholders see that the plan has been tested beyond a single forecast.
Professional Charts
The professional charts section turns financial data into clear visual reports that can be used for presentations, business plans, funding documents, and internal management discussions. Instead of relying only on spreadsheet tables, this component helps users visualize revenue growth, cost behavior, gross margin, EBITDA, net income, cash flow, cumulative cash position, payback timing, and other key performance indicators. For a snail farming business, charts are useful because the financial story often includes an initial investment period, a biological ramp-up phase, and a later period where harvest volume and processed product sales begin to scale. Visual outputs make it easier to explain why cash may be negative during early months, when operating performance improves, and how production growth contributes to long-term profitability. Users can use these charts to communicate with banks, investors, grant reviewers, partners, or management teams who need to understand the business quickly. By presenting the numbers in a polished visual format, the model supports more confident decision-making and helps make the forecast more accessible to non-financial stakeholders.
ROE Components and DuPont Analysis
The ROE components section uses DuPont-style analysis to help users understand what drives return on equity in the snail farming operation. Rather than showing only a final return percentage, this component breaks performance into underlying drivers such as profit margin, asset efficiency, and leverage. For a snail farm, this can be highly useful because returns may be influenced by large upfront investments in facility renovation, snail pens, hatchery and rearing equipment, processing machinery, packaging equipment, and working capital. The analysis helps users see whether returns are being driven by operating profitability, efficient use of assets, or the financing structure of the business. Inputs may include projected revenue, net income, total assets, equity contribution, debt levels, and retained earnings. Outputs can include return on equity, asset turnover, profit margin, and leverage-related insights. This section is useful for investors and owners because it connects operational decisions with financial performance. If ROE is weak, users can assess whether they need to improve margins, increase production utilization, adjust pricing, reduce idle assets, or reconsider the balance between debt and equity financing.
Revenue Inputs
The revenue inputs section is where users define the commercial assumptions that drive sales in the Snail Farming Financial Model. This component is tailored to the logic of a snail farming operation, where revenue may come from juvenile snail sales, live and purged snails, blanched and shelled snails, wholesale food service products, frozen escargot meat, fresh escargot kits, retail packs, and potential value-added or direct-to-consumer channels. Inputs may include breeding stock, production cycles, survival rates, harvest volumes, retention of juveniles for future production, selling prices by product category, sales mix, growth rates, market penetration, and seasonality. The section helps users connect operational assumptions with revenue projections so they can see how production capacity translates into sales. It is especially valuable because snail farming revenue is not simply a matter of multiplying customers by price. The model must account for biological yield, processing choices, product mix, and the timing of sales. By organizing these inputs clearly, users can test different strategies, such as selling more juveniles early for quicker cash flow or shifting toward higher-margin packaged products as the operation matures.
Bank-Ready Reports
The bank-ready reports section provides lender-friendly financial outputs that help users prepare for loan applications, investor reviews, and professional funding conversations. This component is designed to present the financial model in a clean, structured format that highlights the information banks and stakeholders typically want to see. Outputs may include profit and loss projections, cash flow forecasts, balance sheet summaries, debt service capacity, financing requirements, capital expenditure schedules, working capital needs, profitability metrics, and repayment-related assumptions. For a snail farming business, this is important because lenders need to understand both the upfront capital required and the timing of future cash generation. The model helps explain how funds may be used for farm facility setup, snail pens, substrate infrastructure, hatchery equipment, processing machinery, packaging equipment, breeding stock, labor, and early operating expenses. It can also show when the business is expected to generate sufficient cash flow to cover expenses and support debt repayment. By using organized, professional reports, users can present a more credible case and reduce the risk of incomplete or confusing financial documentation.
Revenue Breakdown
The revenue breakdown section gives users a detailed view of how each revenue stream contributes to the overall financial forecast. A commercial snail farming business may generate income from multiple product categories, and each category can have different pricing, costs, margins, production constraints, and sales timing. This component separates revenue by stream so users can analyze juvenile snail sales, live and purged snail sales, processed and shelled products, food service sales, retail products, frozen products, and direct-to-consumer offerings. Inputs may include units sold, average selling price, product mix percentages, annual growth rates, production availability, and channel-specific assumptions. Outputs help users identify which products drive the most revenue, which categories support stronger margins, and how the mix changes as the farm scales. This is useful for strategic planning because a farm may choose to prioritize early juvenile sales to improve cash flow, wholesale live snails to build volume, or value-added retail products to improve profitability. The breakdown also supports pricing decisions, marketing focus, production planning, and investor communication by showing exactly where revenue is expected to come from.
KPI Dashboard and Performance Benchmarks
The KPI dashboard and performance benchmarks section helps users monitor the financial and operational health of the snail farming business using measurable indicators. It may include performance metrics such as revenue growth, gross margin, EBITDA margin, net profit margin, cash balance, cost of goods sold percentage, payroll ratio, operating expense ratio, break-even progress, payback timing, return on equity, internal rate of return, and cash-on-cash return. For a snail farm, it can also support operational benchmarks such as mortality rates, breeding efficiency, production yield, sales mix, average price per product, and cost per unit. This component is useful because it turns the forecast into a management tool, not just a funding document. Users can compare planned performance against industry expectations, internal targets, or updated actual results as the business develops. If feed costs rise, survival rates fall, or labor costs increase, the KPI dashboard can help identify pressure points quickly. For consultants and analysts, it provides a clear framework for discussing business performance with clients. For owners and founders, it supports faster decisions about pricing, production, cost control, staffing, and growth priorities.
Startup and Operating Cost Analysis
The startup and operating cost analysis section organizes the investment and expense structure required to launch and run the snail farming operation. Startup costs may include farm facility renovation, land preparation, snail pens, substrate infrastructure, hatchery and rearing equipment, climate control systems, processing and packaging machinery, initial breeding stock, licensing, deposits, professional fees, initial marketing, and opening working capital. Operating expenses may include feed, utilities, labor, packaging, maintenance, cleaning, transport, insurance, rent, marketing, administration, and other recurring costs. The model allows users to enter and adjust these assumptions so they can estimate total funding needs and understand the cost base before operations begin. This section is valuable because snail farming often requires meaningful upfront investment before full revenue generation occurs. It also helps users separate one-time capital expenditures from ongoing monthly expenses, which is important for cash flow planning and funding discussions. By seeing how costs behave over time, users can evaluate whether to phase equipment purchases, lease certain assets, control payroll growth, negotiate supply agreements, or adjust the launch plan to reduce financial risk.
Break-Even Analysis
The break-even analysis section helps users identify when the snail farming business is expected to cover its cumulative costs and begin generating net profit. This component connects revenue projections, variable costs, fixed operating expenses, payroll, capital investment, and cash flow timing to estimate the point where the business becomes financially sustainable. Inputs may include product pricing, units sold, gross margin, feed costs, packaging costs, labor costs, overhead expenses, startup costs, and production ramp-up assumptions. Outputs may show break-even month, break-even date, required revenue level, required sales volume, cumulative profit position, and the impact of changing assumptions on the break-even timeline. For a snail farming operation, this analysis is especially important because the business may experience an initial cash burn while breeding stock grows, production scales, and processed products reach the market. Users can test how break-even timing changes if they increase juvenile sales, shift toward higher-margin products, lower feed costs, reduce mortality, lease equipment, or secure early wholesale contracts. This section supports funding preparation, operational planning, and owner decision-making by clarifying how long the business may need support before it reaches profitability.
File types:
Excel – Single-User: .xlsx
Excel – Multi-User: .xlsx
Similar ProductsOther customers were also interested in...


 HenrySheykin
Cannabis Financial Model Excel Template
The Cannabis Business Financial Model is a ready-to-use financial model template designed to help en... Read more
Greenhouse Farming Financial Model Excel Template
The Greenhouse Farming Financial Model helps users evaluate the economics of a controlled environmen... Read more
Marijuana Financial Model Excel Template
The Cannabis Business Financial Model is a ready-to-use financial model template designed to help en... Read more
Fruits Farming Financial Model Excel Template
The Fruit Farming Financial Model helps users turn a fruit farm concept, orchard expansion, or agric... Read more
Poultry Farm Financial Model Excel Template
The Poultry Farming Financial Model helps users turn a poultry farm concept into a structured, lende... Read more
Fish Farm Financial Model Excel Template
The Fish Farming Financial Model template helps entrepreneurs, aquaculture founders, business owners... Read more
Shrimp Farm Financial Model Excel Template
The Shrimp Farming Financial Model helps entrepreneurs, aquaculture operators, consultants, analysts... Read more
Soy Production Financial Model Excel Template
The Soy Production Financial Model helps users turn a soybean farming and processing plan into a str... Read more
Cotton Growing Financial Model Excel Template
The Cotton Farming Financial Model Financial Model Template helps entrepreneurs, farm owners, consul... Read more
Vegetable Farming Financial Model Excel Template
The Vegetable Farming Financial Model helps users turn a farming concept, expansion plan, or funding... Read more
You must log in to submit a review.