
0 ITEMS

Rental Property ROI Calculator Excel – 15-Year Cash Flow, IRR, DSCR, Cap Rate & Mortgage Model
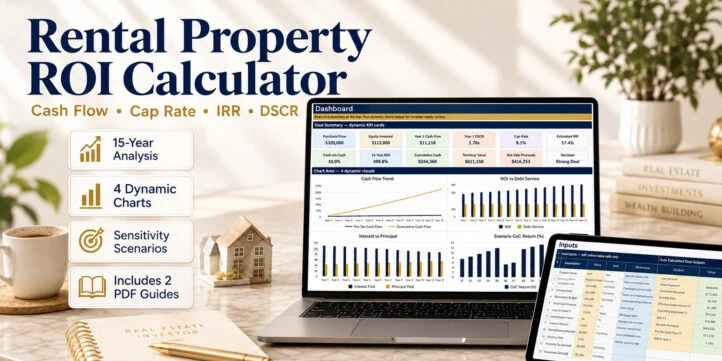
Analyze rental investments with a 15-year Excel cash flow model, mortgage schedule, cap rate, IRR, DSCR, ROI, sensitivity analysis and KPI dashboard.
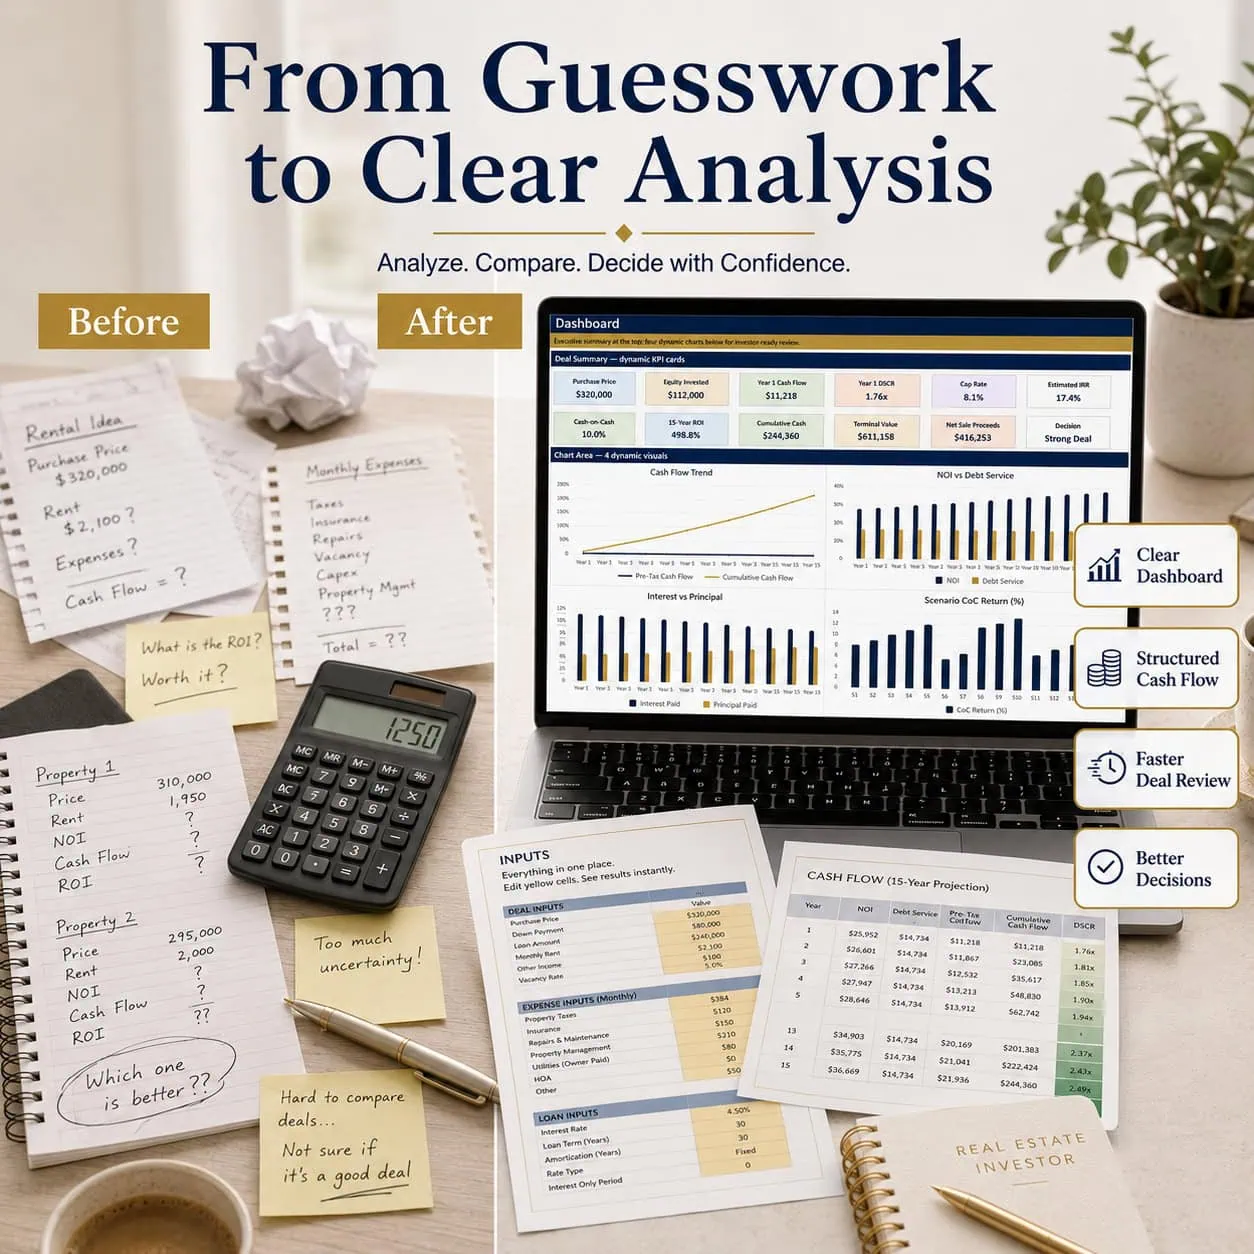

Cash Flow Forecast · Cap Rate · IRR · DSCR · Mortgage Schedule · Investment Dashboard
Evaluate rental property investments with greater clarity using a professional, fully editable Excel financial model designed for residential real estate investors, landlords and property investment analysts.
The Rental Property ROI Calculator by SheetworksStudio combines acquisition assumptions, rental income, operating expenses, mortgage financing, annual cash flow projections, exit valuation and investment return metrics in one structured workbook.
Whether you are reviewing your first rental property or comparing potential buy-and-hold opportunities, this model helps you understand the financial drivers behind a property investment before committing capital.
What You Receive
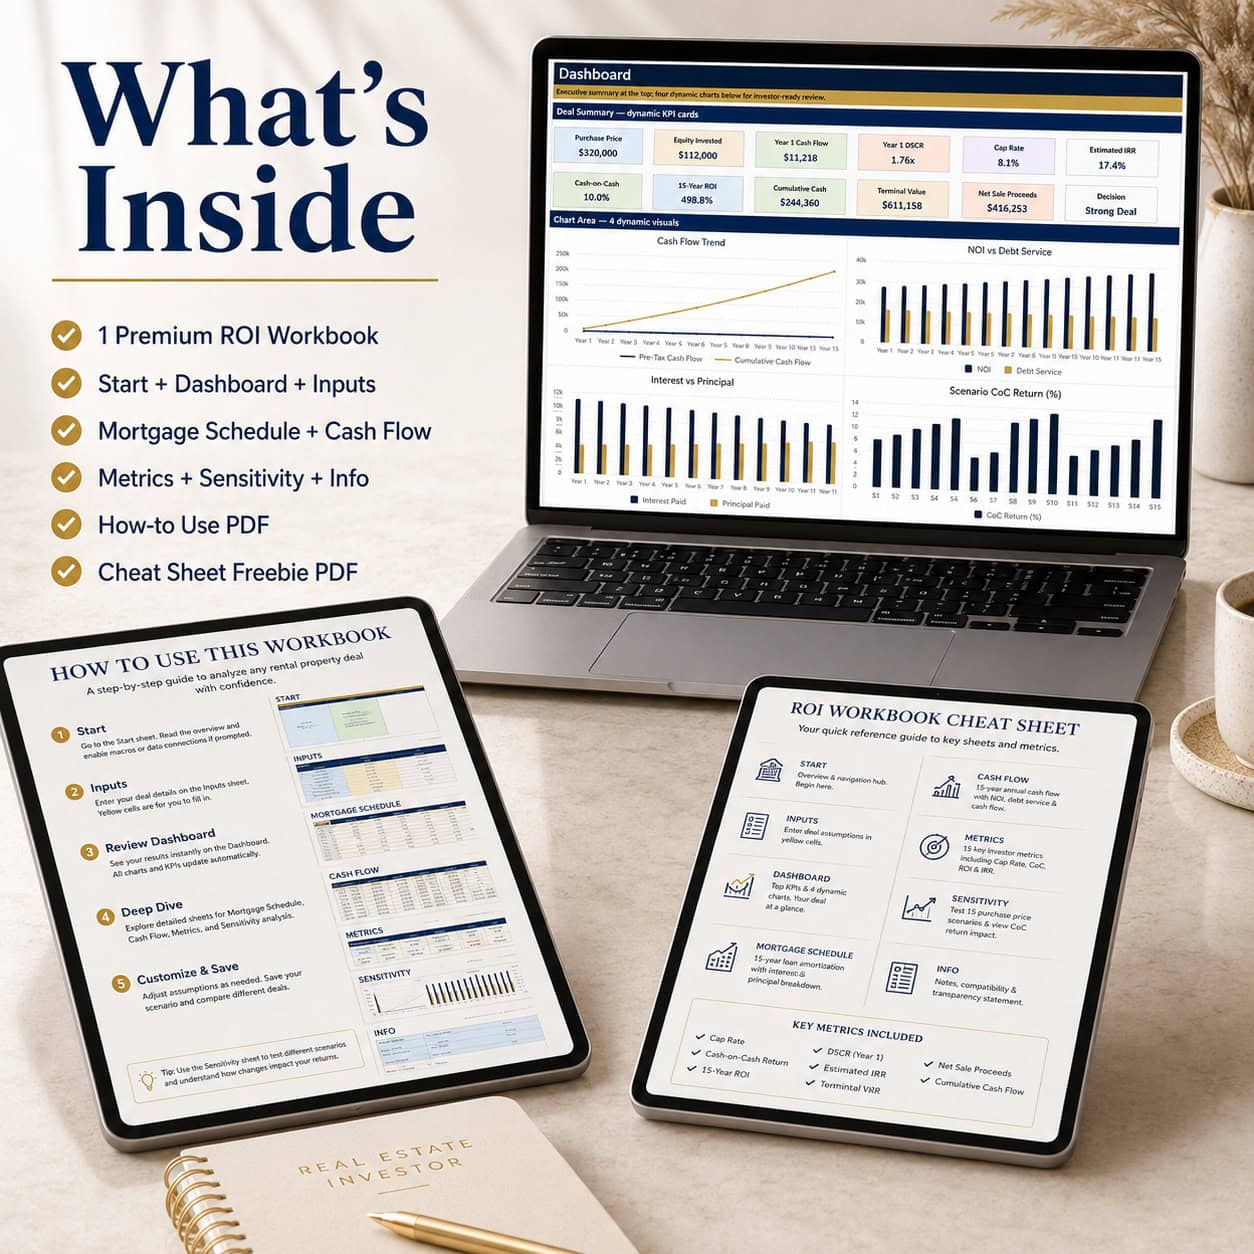
1. Premium Rental Property ROI Excel Model (.xlsx)
An eight-worksheet investment calculator featuring a 15-year annual financial projection, an integrated mortgage schedule, a professional KPI dashboard and 15 sensitivity scenarios.
2. Professional How-to-Use Guide (6-Page PDF)
Step-by-step guidance explaining setup, financial assumptions, workbook navigation, calculations and important model limitations.
3. Bonus Real Estate Investment Cheat Sheet (4-Page PDF)
A printable reference covering investment metrics, financial formulas, KPI explanations and practical interpretation guidance.
All files are digital, editable where applicable and ready for download.
What’s Inside the Excel Model
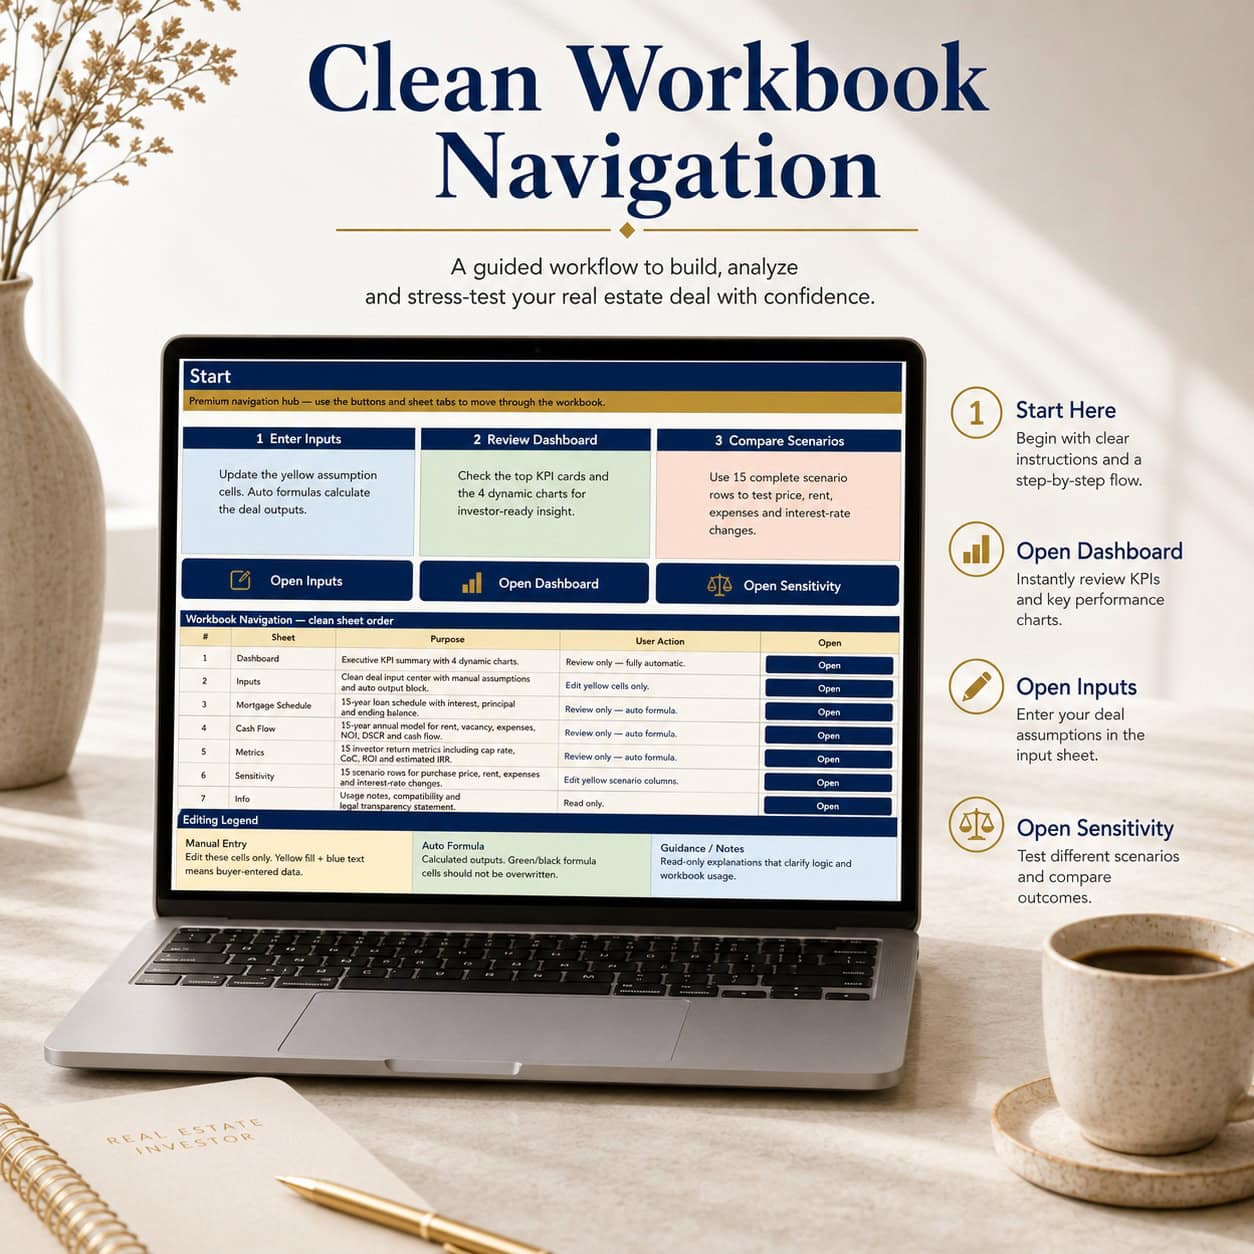
1. Start Page & Navigation
Begin with a structured welcome page that provides an overview of the workbook and direct navigation to the main financial analysis sections.
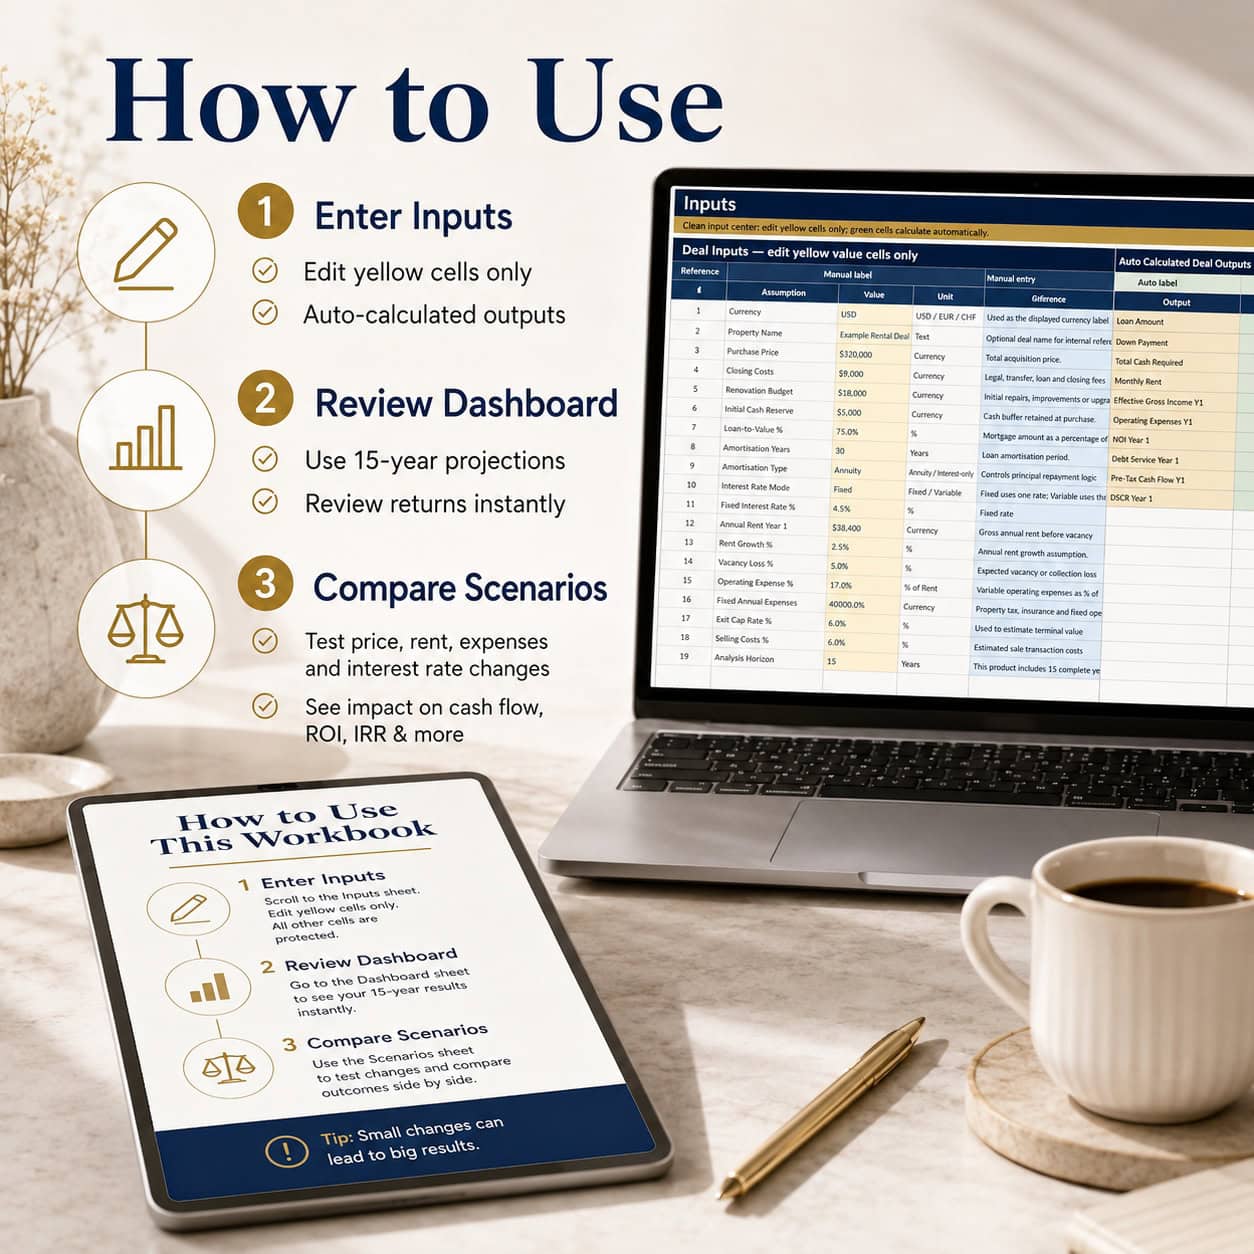
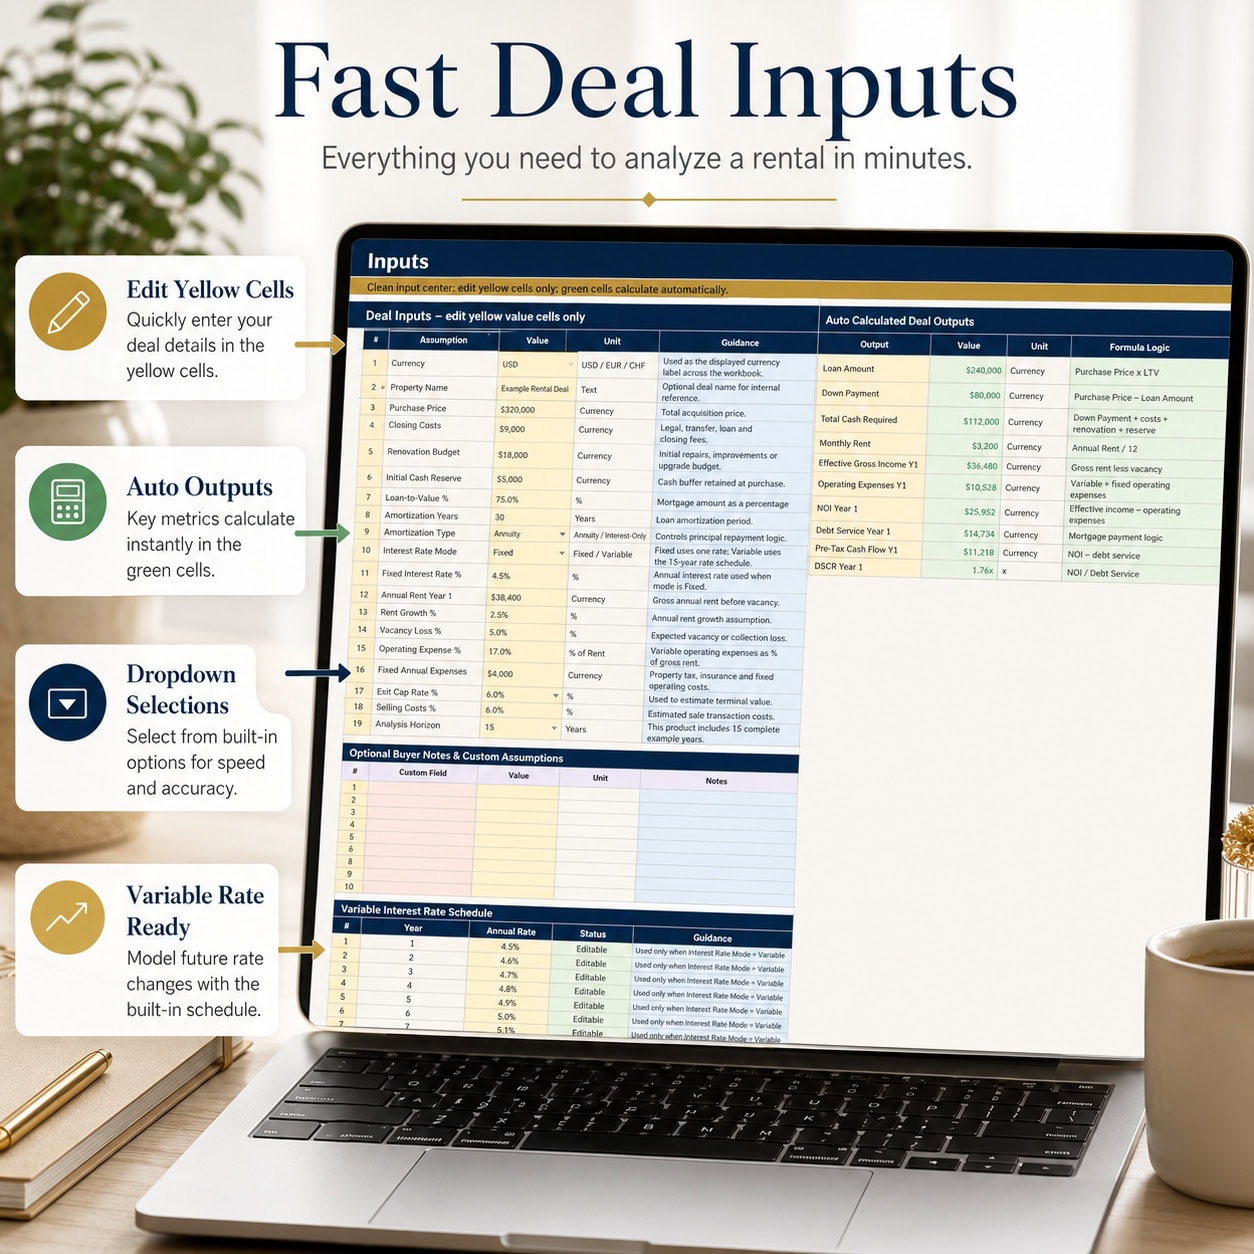
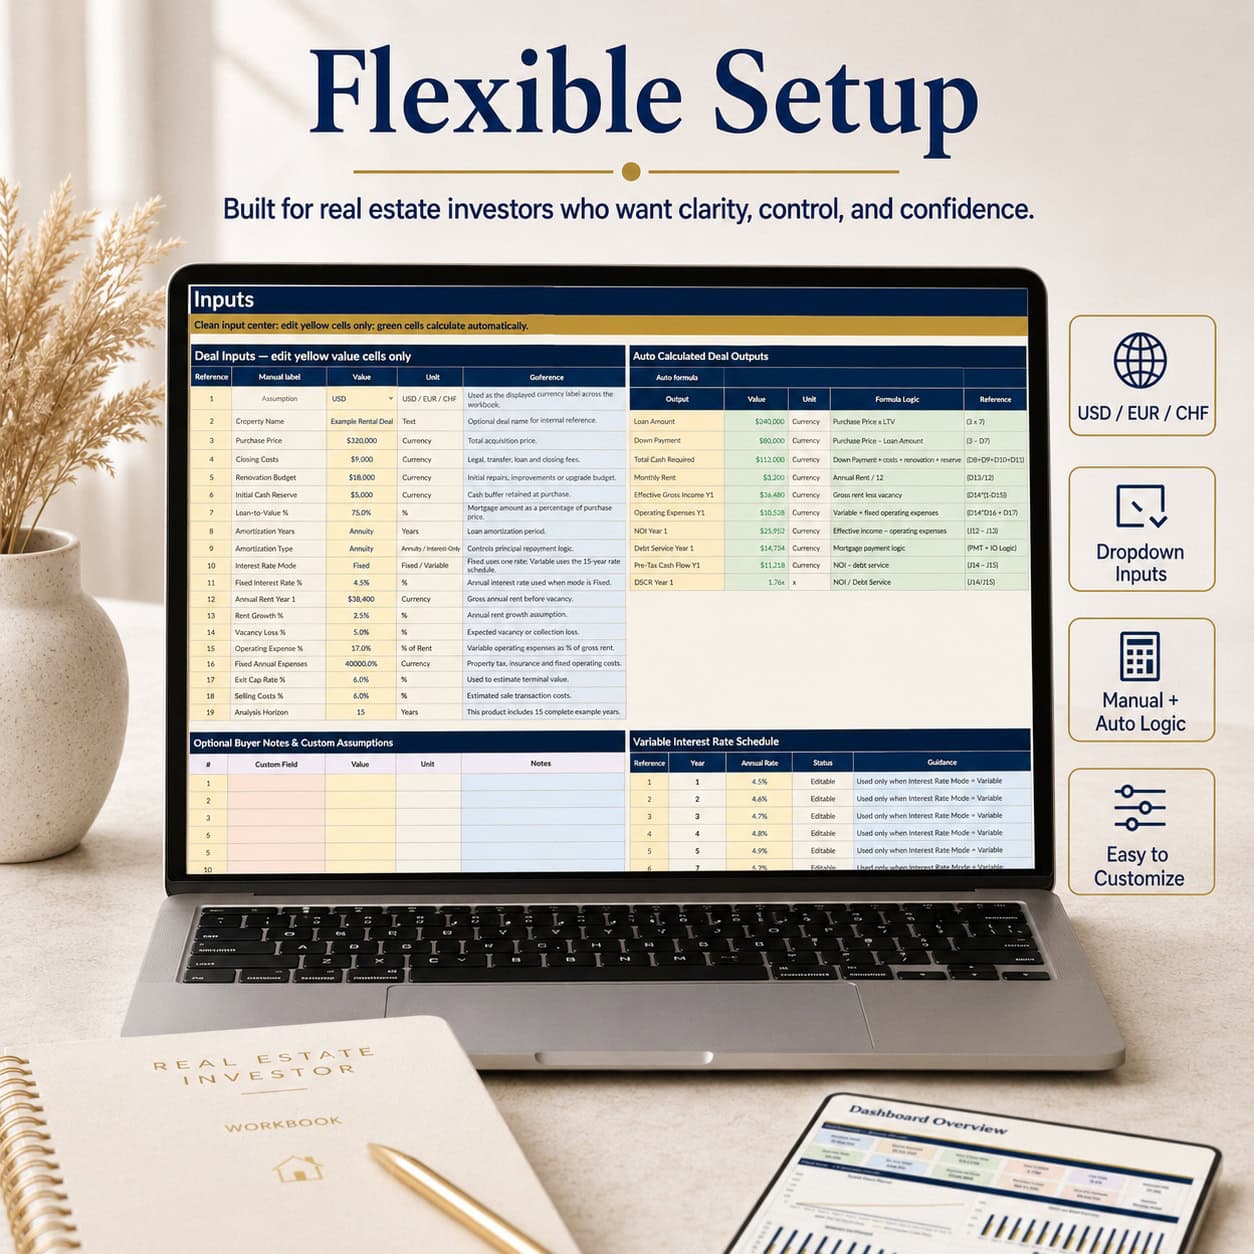
2. Investment Inputs & Deal Assumptions
Enter the assumptions that drive your analysis, including:
- Property purchase price and acquisition costs
- Renovation spending and initial cash reserves
- Financing percentage and mortgage assumptions
- Rental income and expected vacancy
- Operating expenses and growth assumptions
- Property appreciation and exit assumptions
- Investment holding period
Editable input cells are clearly distinguished from calculated outputs, making the model easier to understand and customize.
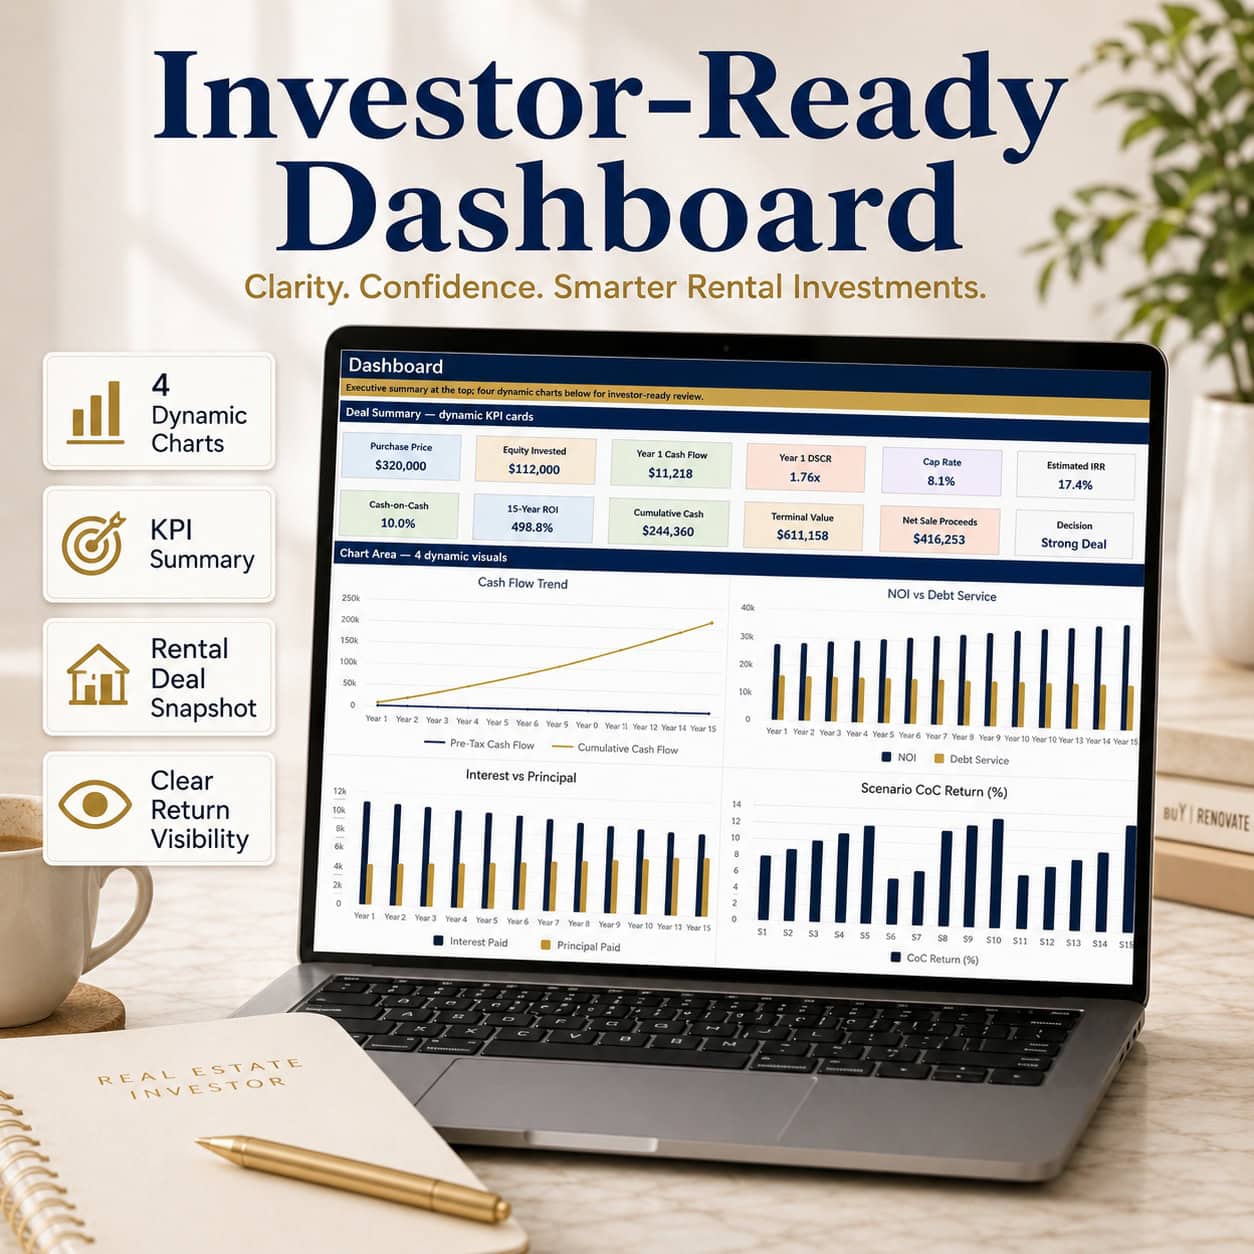
3. Executive Investment Dashboard
Review your property investment through professional financial KPI cards and four dynamic charts.
Key indicators include:
- Purchase Price
- Equity Invested
- Year 1 Cash Flow
- Debt Service Coverage Ratio (DSCR)
- Capitalization Rate (Cap Rate)
- Cash-on-Cash Return
- Investment ROI
- Cumulative Cash Flow
- Estimated Internal Rate of Return (IRR)
- Terminal Property Value
- Net Sale Proceeds
The visual dashboard includes cash flow trends, NOI versus debt service, interest versus principal repayment, and scenario cash-on-cash returns.
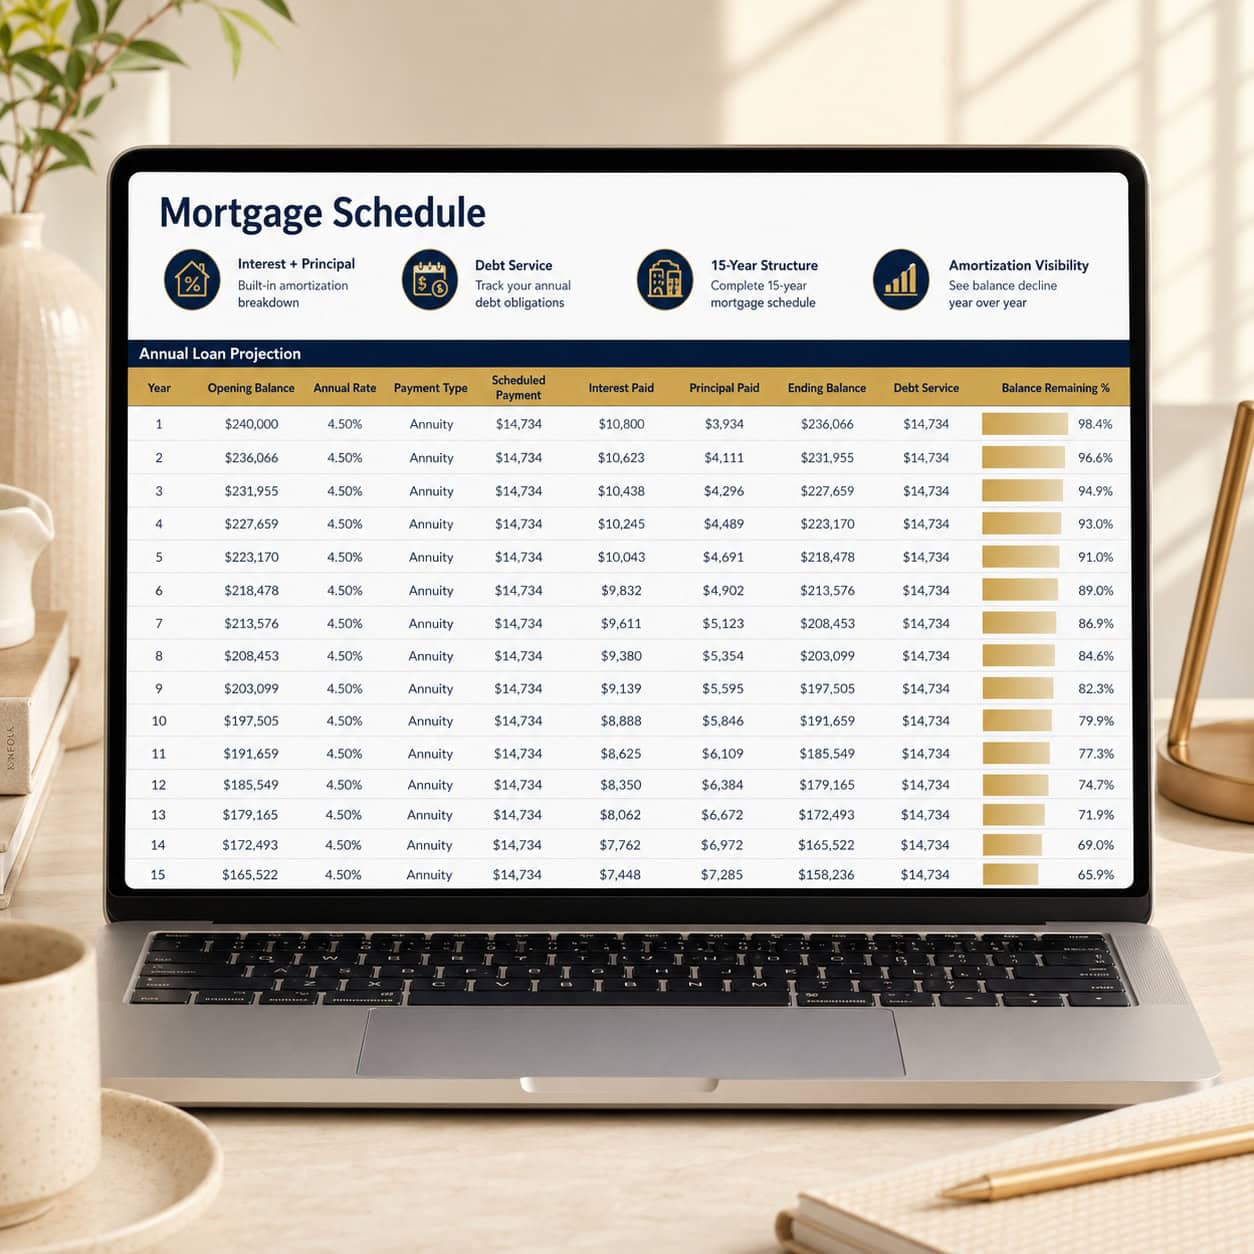
4. 15-Year Mortgage Schedule
Analyze the impact of financing on your rental property investment.
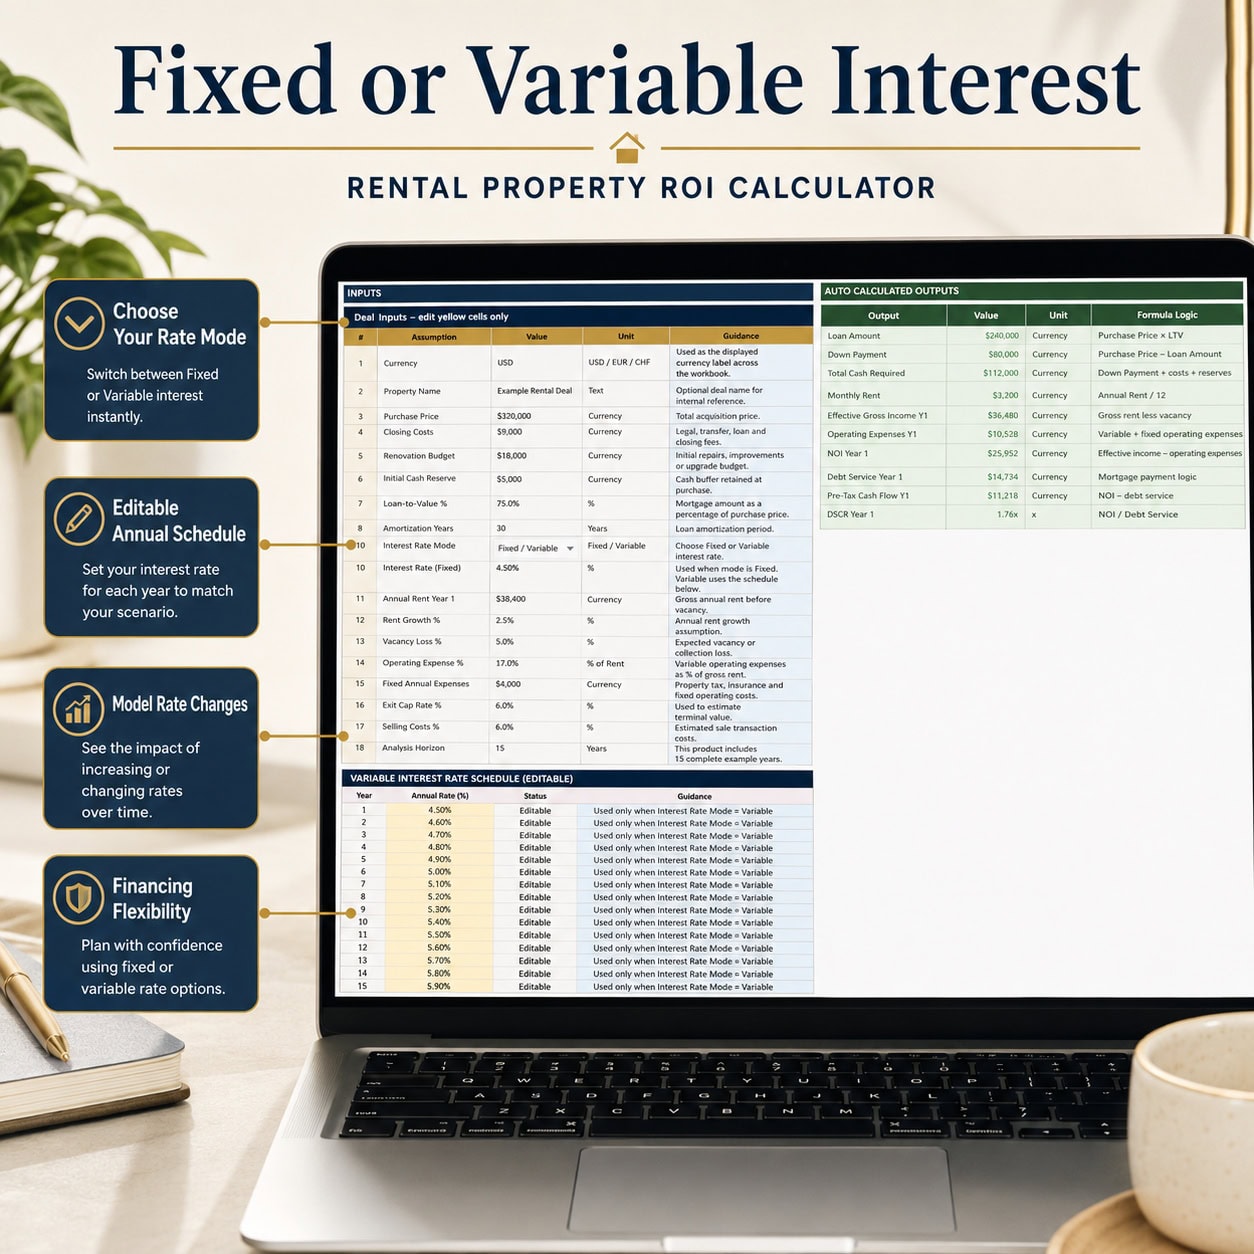
The mortgage schedule calculates debt service, interest payments, principal repayment and outstanding loan balances across a 15-year projection.
The model supports annuity and interest-only loan structures, along with fixed or annually variable interest-rate assumptions.
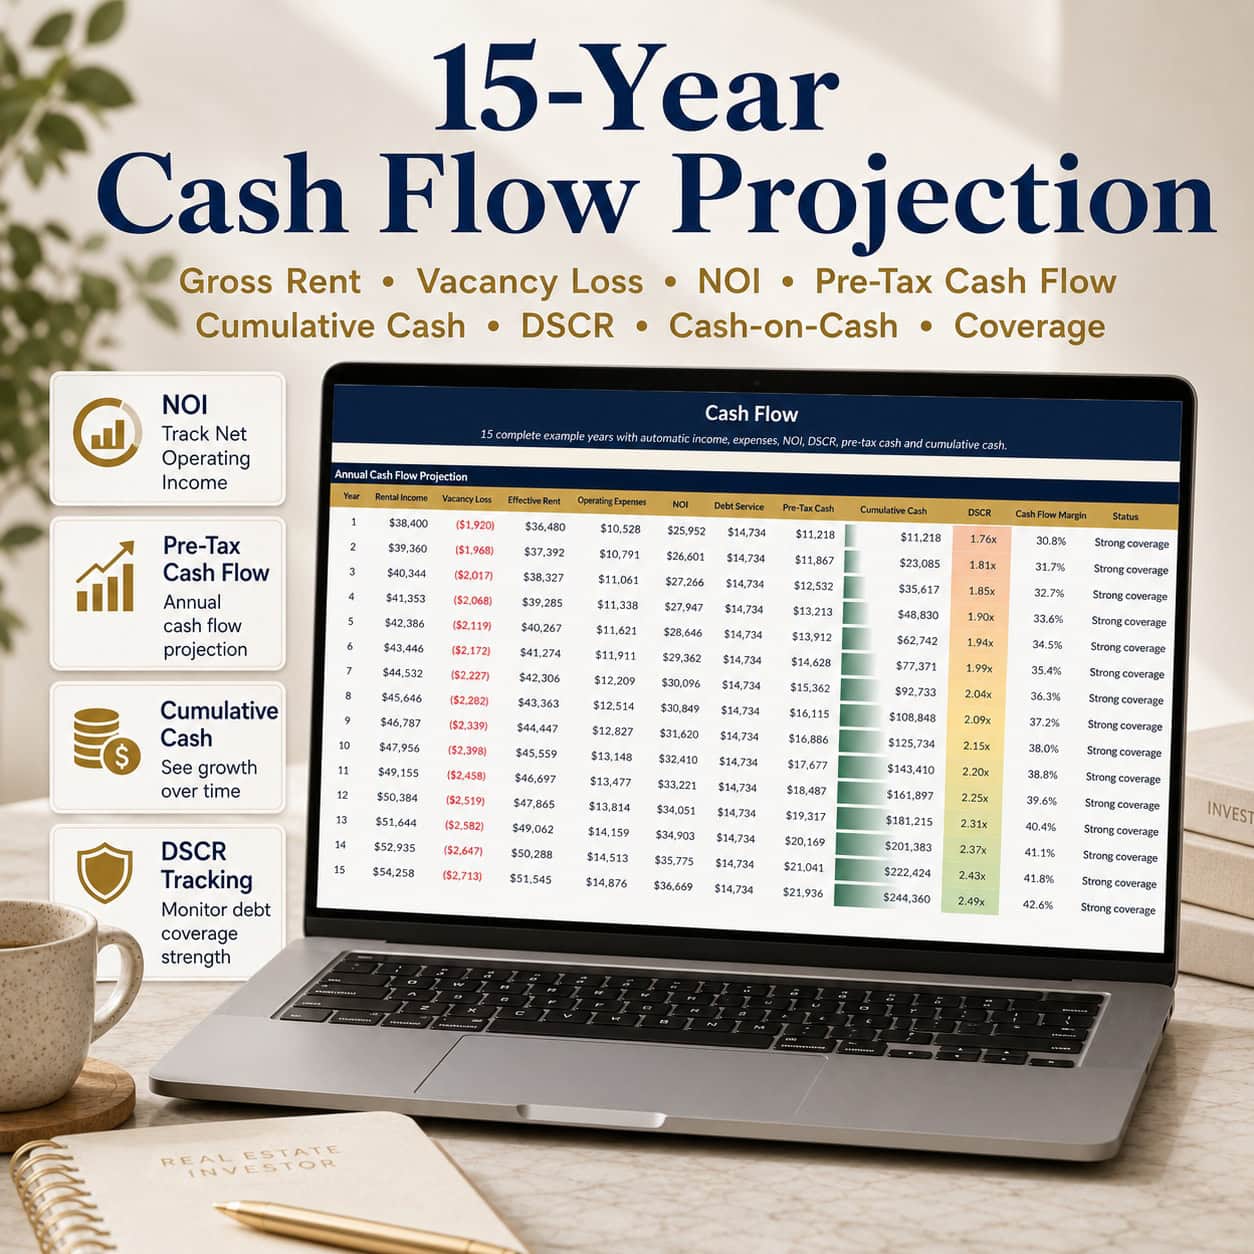
5. 15-Year Rental Cash Flow Projection
Understand how your rental investment may perform over time.
The annual projection covers:
- Gross Rental Income
- Vacancy Losses
- Effective Rental Income
- Operating Expenses
- Net Operating Income (NOI)
- Mortgage Debt Service
- Pre-Tax Cash Flow
- Cumulative Cash Flow
- Debt Service Coverage Ratio
These calculations help you assess ongoing rental cash generation, financing coverage and potential long-term investment performance.
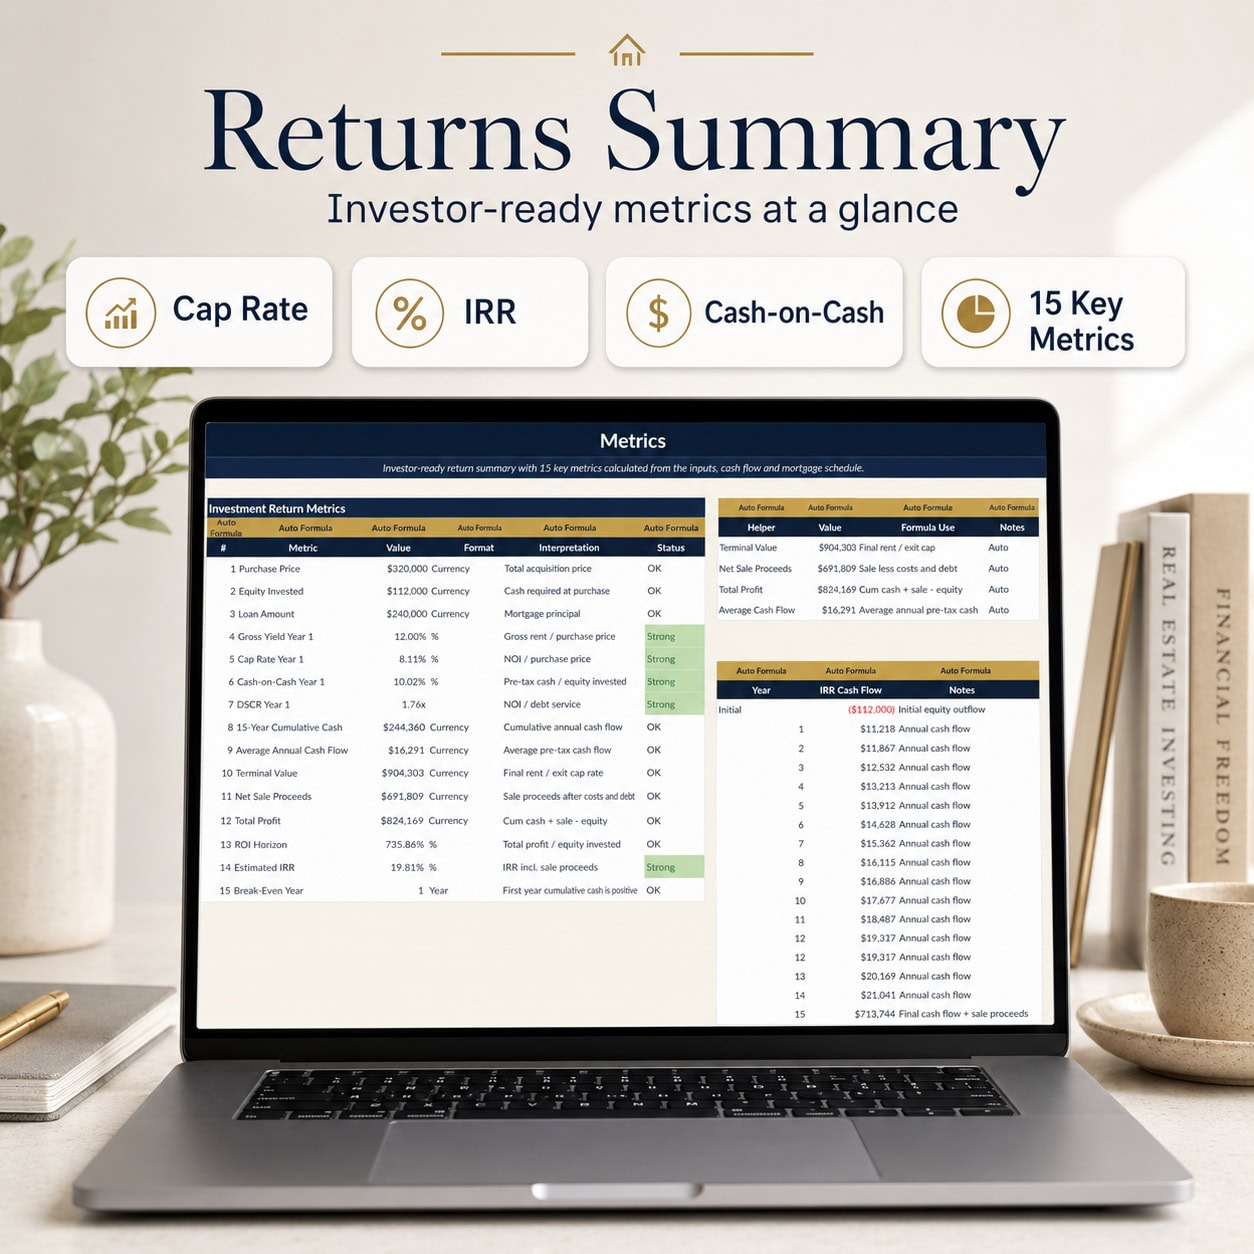
6. Property Investment Returns & Exit Analysis
Evaluate investment returns using recognized real estate metrics, including gross yield, cap rate, cash-on-cash return, ROI, estimated IRR, terminal value and net sale proceeds.
Choose an investment holding period between 1 and 15 years. The model updates relevant investment return calculations and exit results to reflect the selected holding period.
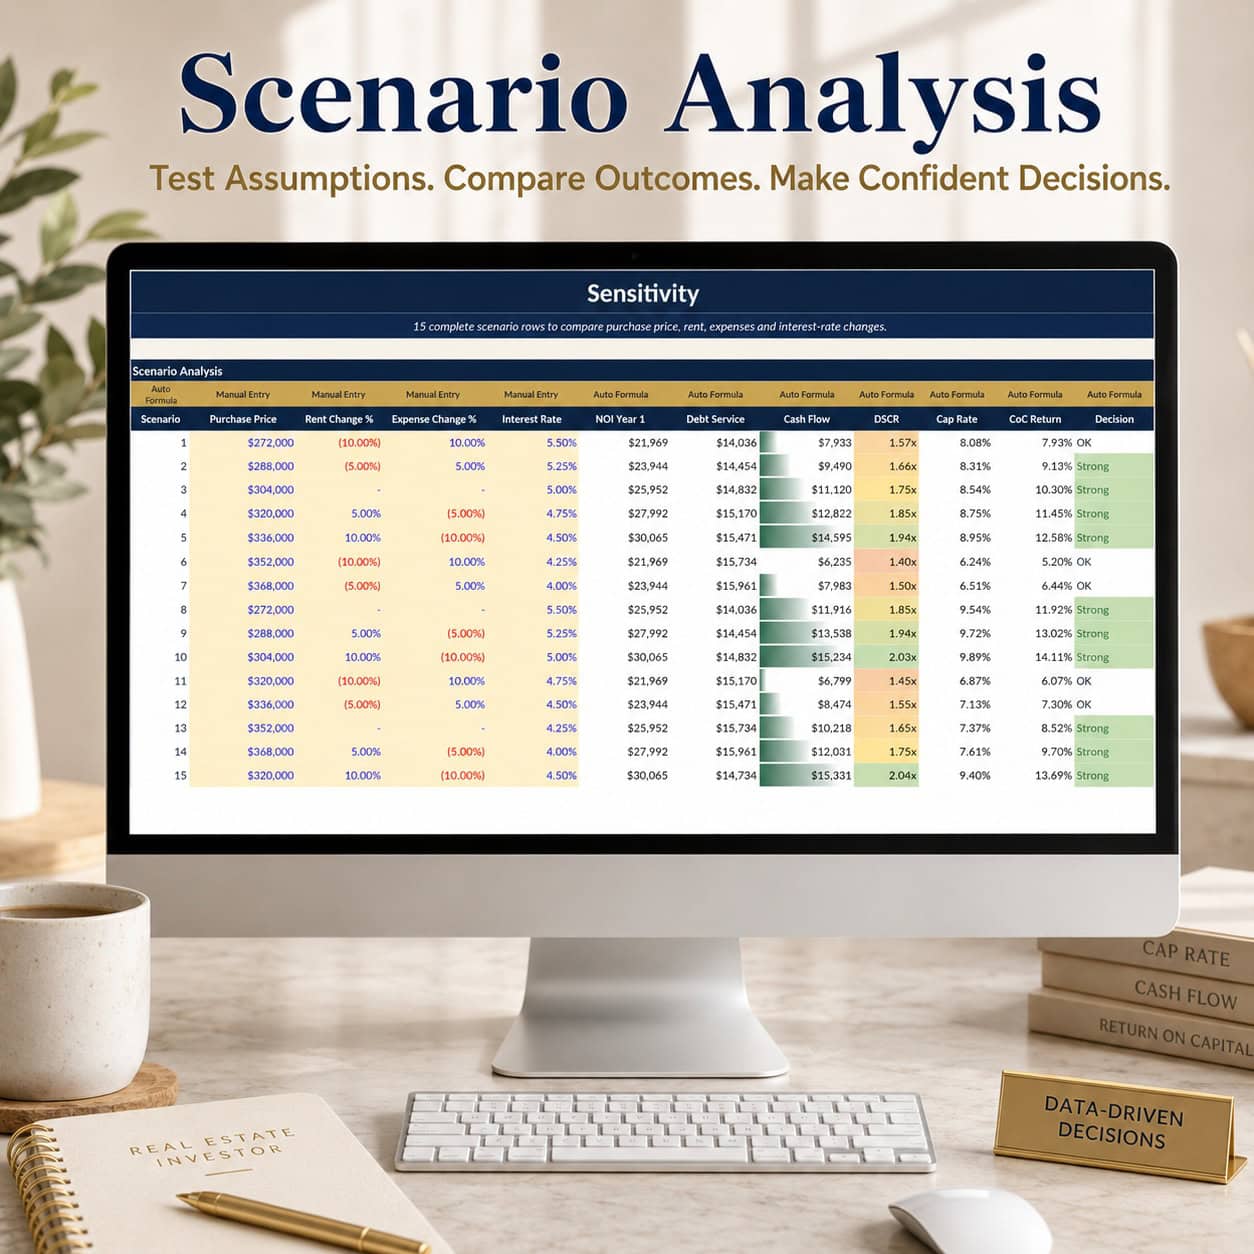
7. Sensitivity & What-If Analysis
Compare 15 sensitivity scenarios to understand how changes in key assumptions may influence first-year investment performance.
Explore variations in:
- Property purchase price
- Rental income
- Operating expenses
- Mortgage interest rates
This section supports quick deal screening and comparison of potential investment risks.
8. Model Information & Guidance
Additional instructions help explain important assumptions, calculations and the intended scope of the investment model.
How to Use the Model
- Open the Excel workbook and begin on the Start page.
- Navigate to the Inputs sheet.
- Replace the illustrative sample assumptions with your own property information.
- Select your financing assumptions and investment holding period.
- Review the automatically calculated mortgage schedule and cash flow projection.
- Examine investment returns, DSCR, IRR, cap rate and exit proceeds.
- Compare sensitivity scenarios to understand the impact of changing assumptions.
- Review the KPI Dashboard before making your investment decision.
Ideal For
- Residential property investors and private landlords
- Buy-and-hold rental property analysis
- Single-property acquisition screening
- Real estate investment consultants
- Property investment analysts
- Mortgage and financing comparisons
- Cash flow and rental yield analysis
- Investment holding-period comparisons
- Investors preparing structured property deal reviews
Key Benefits
Understand Property Returns
Analyze rental income, operating expenses, debt service, cash flow and investment returns through transparent Excel calculations.
Compare Financing and Risk Assumptions
Explore different property and mortgage assumptions using the integrated sensitivity analysis.
Make More Structured Investment Decisions
Review 15-year financial projections, exit assumptions and key investment metrics through an organized workflow and professional dashboard.
Technical Specifications
- File format: Microsoft Excel (.xlsx)
- Main workbook: 8 worksheets
- Projection period: 15 years, annual
- Selectable investment holding period: 1–15 years
- Mortgage amortization and financing calculations
- 15 first-year sensitivity scenarios
- Executive KPI Dashboard with 4 charts
- Formula-driven investment metrics
- Fully editable workbook
- Macro-free
- No external data connections
- Illustrative sample investment assumptions
- Includes 2 PDF guides totaling 10 pages
Excel & Google Sheets Compatibility
The workbook is designed for Microsoft Excel on Windows and Mac.
Import into Google Sheets may be possible, but formulas, formatting, data validation, charts and navigation should be checked after import. Microsoft Excel is the recommended environment for the most consistent experience.
USD, EUR and CHF can be selected as display currency labels. The workbook does not perform foreign exchange conversions.
Important Model Scope
This is an annual, pre-tax, single-property buy-and-hold investment analysis model.
It is not a full three-statement accounting model and does not include detailed income tax calculations, depreciation schedules, refinancing simulations, a complete BRRRR investment workflow or a dedicated renovation-and-flip development model.
Sensitivity scenarios evaluate changes in first-year investment assumptions rather than generating 15 separate long-term financial forecasts.
Initial cash reserves remain included in invested equity and are not modeled as a separate release of funds at sale. Fixed operating expenses follow the model’s rent-growth assumption.
Disclaimer
This financial model is provided for educational, organizational and investment planning purposes only.
It does not constitute financial, investment, tax, legal, accounting or real estate advice and does not guarantee any particular investment outcome.
Forecasts, valuation assumptions, loan calculations and investment returns depend on user inputs and should be independently verified before making financial decisions.
Consult qualified real estate, finance, accounting and legal professionals as appropriate.
No physical product will be shipped.
Developed by SheetworksStudio – Professional Excel Financial Models & Business Templates.
Similar ProductsOther customers were also interested in...



 eFinancialModels
Electric Vehicle (EV) Charging Station Financial M...
With this comprehensive 5- or 10-year monthly tool, investors can assess the viability of setting up... Read more

Financial Model for Mobile App | Mobile App Busine...
The Mobile App Financial Plan Template in Excel allows you to develop financial projections when lau... Read more

 HenrySheykin
Food Truck Financial Model Excel Template
The Food Truck Financial Model helps entrepreneurs, founders, business owners, consultants, and anal... Read more

Green Hydrogen Production from Wind Energy Financi...
The Green Hydrogen from Wind Financial Model aims to comprehensively forecast a horizon of 40 years ... Read more

Simple Mutual Non-Disclosure Agreement Template
Protect your business secrets with ease using our Simple Mutual Non-Disclosure Agreement Template. S... Read more

Solar Energy Financial Model
The Solar Energy Financial Model Spreadsheet Template in Excel assists you in preparing a sophistica... Read more

 Peter Graf
The Customer-Centric Financial Model for Restauran...
Starting a restaurant without a financial plan is like driving a car blindfolded. You wouldn´t do i... Read more
You must log in to submit a review.