
0 ITEMS

Poultry Farm Financial Model Excel Template
The Poultry Farming Financial Model helps users turn a poultry farm concept into a structured, lender-ready financial forecast. It is designed for planning a commercial poultry operation where hatchery activity, grow-out production, harvest volume, product mix, feed costs, processing costs, payroll, startup investment, and cash flow all need to connect in one clear model. Instead of estimating these numbers separately, users can organize revenue assumptions, cost drivers, operating expenses, and profitability in a ready-to-use template built around the economics of poultry farming. This financial model template is useful for entrepreneurs, farm owners, business consultants, analysts, founders, and anyone preparing a poultry farming business plan, loan application, investor presentation, or internal budget. It helps users assess whether hatchery and juvenile sales can support early overhead, how grow-out and harvest assumptions affect end-product revenue, and how startup costs and operating expenses influence the path to profitability. The model is also helpful for established poultry businesses considering expansion, equipment upgrades, processing capacity, or a more detailed financial planning process. The template supports practical decision-making by helping users test assumptions before committing capital. Users can adjust production cycles, mortality rates, bird weights, pricing, cost of goods sold, staffing levels, payroll, fixed overhead, and capital expenditure requirements to reflect their own operation. These assumptions flow into projected revenue, expenses, cash flow, profit and loss, financial statements, break-even analysis, and key performance indicators, giving users a clearer picture of funding needs and long-term viability. Built for use in Microsoft Excel and Google Sheets, the Poultry Farming Financial Model is fully editable and structured for professional presentation. It gives buyers a time-saving framework for forecasting cash requirements, reviewing profitability, identifying major cost risks, and presenting financial projections to lenders, investors, partners, or internal stakeholders. Whether the goal is to launch a new poultry farm, refine an existing plan, or prepare funding documents, this template provides a practical foundation for understanding the financial side of a poultry farming business.
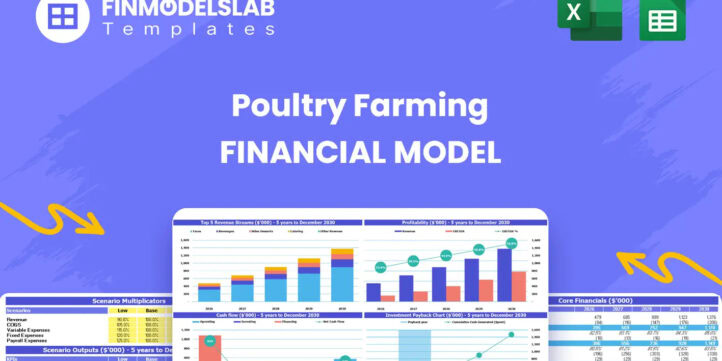


Financial Model Overview
The Poultry Farming Financial Model is a ready-to-use financial model template designed to help entrepreneurs, farm owners, consultants, analysts, and business planners evaluate the economics of a poultry farming operation. Poultry farming can be capital-intensive because it combines biological production, facilities, equipment, labor, feed, processing, working capital, and sales planning into one business system. This template helps users bring those moving parts together in a structured forecast, making it easier to plan startup investment, estimate revenue, project operating expenses, understand cash flow, and assess profitability before making major financial commitments. It is especially useful for poultry farms that need to present a professional plan to lenders, investors, partners, or internal decision-makers, because it connects assumptions with clear financial outputs in a format that supports funding discussions and operational planning.
All-in-One Dashboard
The all-in-one dashboard gives users a central place to review the core inputs and core outputs of the Poultry Farming Financial Model. Instead of switching between disconnected worksheets to understand how the farm is performing, users can use the dashboard to monitor the main financial drivers and results in one organized view. Key inputs may include assumptions for production cycles, hatchery output, grow-out volumes, mortality rates, harvest weights, product pricing, feed costs, processing costs, payroll, fixed overhead, and capital investment. These assumptions flow into summarized outputs such as revenue, gross profit, EBITDA, net income, cash balance, funding needs, and return metrics. This component is useful because poultry farming decisions are highly interconnected, and the dashboard helps users quickly see how changes in production, pricing, costs, or staffing affect the overall financial outlook. For lenders and investors, the dashboard also provides a concise summary of the business case, helping them understand the farm’s projected scale, profitability, and cash requirements without reviewing every detailed schedule first.
Low, Base, and High Scenario Analysis
The low, base, and high scenario analysis section helps users test how the poultry farm may perform under different operating and market conditions. A poultry farming forecast can be sensitive to assumptions such as hatch rates, juvenile loss, mortality during grow-out, feed cost inflation, harvest weight, selling prices, production cycle frequency, labor requirements, and processing costs. This component allows users to compare a conservative case, a most likely case, and an optimistic case, so they can understand the range of possible outcomes before committing capital or presenting projections to stakeholders. Inputs may include adjustments to revenue growth, product pricing, bird volumes, cost percentages, payroll assumptions, and capital expenditure timing. Outputs may show how each scenario affects revenue, EBITDA, net profit, cash flow, break-even timing, and funding requirements. This is valuable for planning because it helps users avoid relying on a single forecast that may be too optimistic. It also supports better decision-making by showing what happens if feed costs rise, sales prices fall, mortality increases, or expansion happens more slowly than expected.
Professional Charts
The professional charts component converts the model’s financial projections into clear visuals that are easier to explain in meetings, funding presentations, and business planning documents. Poultry farming financials often involve many detailed assumptions, including flock size, production cycles, product mix, direct costs, fixed overhead, payroll, startup capital, and cash flow timing. Charts help simplify that complexity by showing trends and relationships across the forecast period. This section may visualize revenue growth, gross margin, EBITDA, net income, operating cash flow, cash balance, capital expenditure, revenue mix, cost structure, and key operational metrics. The outputs are useful for identifying whether profitability improves as production scales, whether cash reserves remain adequate, and which revenue streams or costs have the greatest impact on results. For entrepreneurs and consultants, presentation-ready charts save time when preparing pitch decks, bank submissions, or internal reports. For lenders and investors, the charts make the financial story easier to review, helping them see whether the poultry operation has a credible path from startup investment to sustainable cash generation.
ROE Components and DuPont Analysis
The ROE components and DuPont analysis section helps users understand what is driving return on equity in the poultry farming business. Return on equity is important because it shows how effectively the farm is generating profit from shareholder or owner capital. DuPont analysis breaks this return into its underlying drivers, typically profitability, asset efficiency, and leverage, allowing users to see whether returns are being created by strong margins, efficient use of assets, or financial structure. In a poultry farming model, this is especially useful because the business may require significant investment in land, coop construction, hatchery infrastructure, processing equipment, vehicles, and working capital. Inputs and outputs may include net profit margin, asset turnover, equity levels, debt assumptions, total assets, and net income. This component helps users evaluate whether the farm’s return profile is healthy or overly dependent on leverage. It is useful for owners planning capital allocation, investors evaluating potential returns, and lenders reviewing whether the farm can generate enough earnings to support the assets and financing required to operate.
Revenue Inputs
The revenue inputs section is where users define the assumptions that drive the poultry farm’s sales forecast. A poultry operation may generate income from juvenile bird sales, whole chickens, portioned cuts, premium breast and thigh products, by-products, processing-related revenue, or other farm outputs depending on the business model. This component allows users to document assumptions such as the number of breeding females, production cycles, offspring per cycle, juvenile loss rate, percentage of juveniles sold, juvenile selling price, percentage retained for grow-out, purchased birds, grow-out mortality, harvest weight, product mix, and selling price per kilogram or unit. These inputs are important because revenue in poultry farming is not only a function of price, but also biological productivity, production capacity, cycle timing, and product yield. The outputs generated by this section help estimate total birds available for sale or harvest, sellable product volume, revenue by product category, and total farm revenue. This is useful for planning because it allows users to test whether production assumptions are realistic and whether the farm can generate enough income to cover direct costs, payroll, overhead, debt service, and reinvestment needs.
Bank-Ready Reports
The bank-ready reports component provides lender-friendly financial outputs that help users present the poultry farming business in a professional and organized way. Banks and funding partners typically want to see startup costs, projected profit and loss, cash flow forecasts, balance sheets, debt assumptions, minimum cash balances, break-even timing, and the ability of the business to repay financing. This component brings those outputs together so users can support a loan application, investor discussion, grant submission, or internal approval process with structured financial statements. Inputs may come from the full model, including revenue assumptions, COGS, operating expenses, payroll, capital expenditure, financing sources, tax assumptions, depreciation, and working capital requirements. Outputs may include annual and monthly forecasts, income statements, cash flow statements, balance sheets, financing summaries, and key metrics such as EBITDA, net income, cash balance, debt coverage, and payback period. This is useful because poultry farming often requires significant upfront investment before revenue is fully stabilized, and a bank-ready reporting structure helps users show how the farm plans to manage startup cash burn, ramp production, and move toward sustainable profitability.
Revenue Breakdown
The revenue breakdown section gives users a detailed view of each revenue stream within the poultry farming operation. Rather than showing only one total sales number, this component separates revenue by activity or product category so users can understand what is contributing most to the business. For example, the model may distinguish between hatchery and juvenile sales, whole chicken sales, portioned chicken breast and thigh sales, other cuts, by-products, or additional revenue categories that fit the farm’s strategy. Inputs may include volume sold, retained production, sellable weight, pricing by product, percentage mix, production cycle timing, and growth assumptions. Outputs help show total revenue by stream, percentage contribution by category, revenue per cycle, annual revenue, and the effect of shifting product mix toward higher-value items. This is useful for decision-making because poultry farms can often improve performance by changing how birds are sold, how much product is processed into higher-margin cuts, or how much volume is allocated to wholesale versus direct sales. A clear revenue breakdown also helps users explain the business model to lenders, investors, and partners who want to understand exactly where sales are expected to come from.
KPI Dashboard
The KPI dashboard focuses on performance metrics and benchmarks that help users evaluate the poultry farm beyond standard financial statements. Poultry farming performance depends on both financial and operational indicators, so this section may track metrics such as revenue growth, gross margin, EBITDA margin, net profit margin, cash balance, break-even timing, return on equity, return on assets, mortality rates, average harvest weight, production volume, revenue per bird, cost of goods sold as a percentage of revenue, payroll as a percentage of revenue, and fixed overhead coverage. Inputs come from the model’s operating assumptions and financial outputs, while the dashboard turns them into measurable indicators for ongoing review. This component is useful because it helps users compare projected results against internal targets, industry expectations, or lender requirements. It also supports management discipline by showing which areas need attention, such as rising feed costs, weaker margins, insufficient cash reserves, or lower-than-expected production efficiency. For owners and advisors, the KPI dashboard makes the model more actionable because it turns a detailed forecast into practical signals for planning, budgeting, and operational control.
Startup Costs and Capital Planning
The startup costs and capital planning section helps users estimate the upfront investment required to launch or expand a poultry farming operation. Poultry farms often require substantial capital before revenue begins, including land preparation, coop construction, hatchery setup, brooding equipment, feeding and watering systems, processing lines, cold storage, vehicles, biosecurity systems, permits, insurance deposits, initial inventory, technology, professional fees, and working capital reserves. This component allows users to itemize those costs, assign timing, and separate one-time capital expenditures from ongoing operating expenses. Outputs may include total startup cost, capital expenditure by category, funding required before launch, depreciation-related assumptions, minimum cash requirement, and the amount of owner equity or external financing needed. This is useful because underestimating startup capital is one of the most common risks in a poultry farming plan. By clearly organizing initial investment needs, users can approach lenders and investors with a more credible funding request, avoid unexpected cash shortages, and decide whether to phase construction, delay equipment purchases, or adjust production capacity to match available capital.
Break-Even and Payback Analysis
The break-even and payback analysis section helps users understand when the poultry farming business may become profitable and how long it may take to recover the initial investment. Break-even analysis may consider fixed operating costs, payroll, direct production costs, gross margin, product pricing, sales volume, and production capacity to estimate the level of revenue or output needed to cover costs. Payback analysis helps users evaluate how quickly cumulative cash flow may offset startup capital expenditures and early operating losses. Inputs may include monthly revenue, COGS, operating expenses, payroll, capital expenditure, financing costs, depreciation assumptions, tax assumptions, and cash flow projections. Outputs may show break-even month, required sales volume, required revenue, cumulative cash flow, payback period, and the sensitivity of profitability to changes in price, feed cost, mortality, or production volume. This component is especially useful for poultry farming because early cash burn can be significant while facilities are built, flocks are established, and sales channels mature. It helps users determine whether the planned operation can reach profitability within an acceptable timeframe and whether additional funding or operational adjustments may be needed.
File types:
Excel – Single-User: .xlsx
Excel – Multi-User: .xlsx
Similar ProductsOther customers were also interested in...


 eFinancialModels
Chicken Egg Farm – Business Plan
This chicken egg farming model aims to plan the operations, financial feasibility, and profitability... Read more
 Giorgos
Broilers Poultry Farm – 10 Year Financial Model
Financial Model providing a dynamic up to 10-year financial forecast for a startup Broilers Poultry ... Read more
Poultry Project Financial Feasibility Model
This poultry financial model template in Excel provides a framework to determine the financial feasi... Read more
Agriculture Financial Model Templates Bundle
This is a collection of financial model templates for businesses in the Agriculture Industry and its... Read more
 HenrySheykin
Cannabis Financial Model Excel Template
The Cannabis Business Financial Model is a ready-to-use financial model template designed to help en... Read more
Shrimp Farm Financial Model Excel Template
The Shrimp Farming Financial Model helps entrepreneurs, aquaculture operators, consultants, analysts... Read more
Fruits Farming Financial Model Excel Template
The Fruit Farming Financial Model helps users turn a fruit farm concept, orchard expansion, or agric... Read more
Greenhouse Farming Financial Model Excel Template
The Greenhouse Farming Financial Model helps users evaluate the economics of a controlled environmen... Read more
Fish Farm Financial Model Excel Template
The Fish Farming Financial Model template helps entrepreneurs, aquaculture founders, business owners... Read more
Vegetable Farming Financial Model Excel Template
The Vegetable Farming Financial Model helps users turn a farming concept, expansion plan, or funding... Read more
 Startup Financial Financial Model - 5 Year Project Plan