
0 ITEMS

Outpatient Physical Therapy Clinic Acquisition & SBA Underwriting Financial Model
Underwrite the purchase of an outpatient physical therapy clinic the way an SBA lender will: visits split by payer at their own allowed rates, the PTA/CQ reimbursement differential priced explicitly, an owner-therapist add-back, a DSCR gate and a dated Medicare fee-cut down-case. Excel + Google Sheets, 11 sheets.
| Clinics, Financial Model, Health Care, Service Businesses |
| 5-year Financial Projections, Business Valuation, Cash Flow Projections, Debt Service Coverage, Financial Model, Loans, Pro-Forma |


The seller’s pro-forma prices a margin plan the payer mix will not let you run.
Almost every outpatient physical therapy clinic on the market is priced off a pro-forma: trailing earnings plus improvements nobody has made yet. Two of them appear in nearly every deal – shifting visits from a therapist to an assistant, and filling the slots lost to cancellations and no-shows. The first one is not worth the same on every visit. Medicare pays 85% for services furnished in whole or in part by a physical therapist assistant (the CQ modifier, in force since 1 January 2022). In the base case in this model the labour saving on a PTA-delivered visit is $11.88 – and on a Medicare visit the CQ haircut takes $11.68 of it straight back. Net: 20 cents. On a commercial visit the payer does not touch, the clinic keeps the full $11.88. The same management decision is worth 58.5 times more or less, decided only by the payer mix on the schedule.
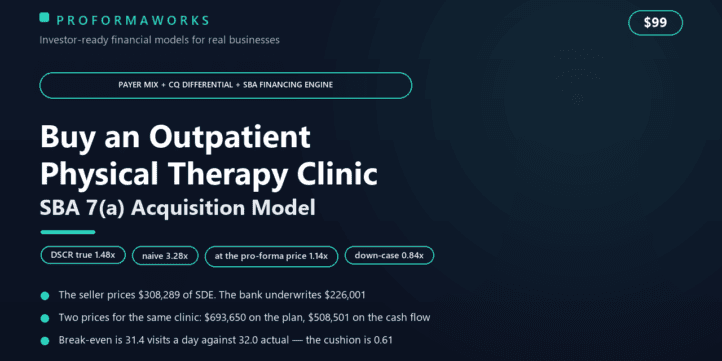
So the model puts both prices on one screen: the pro-forma price of $693,650 against the cash-flow price of $508,501 – a difference of $185,148, or 26.7% of the ask – and shows that at the pro-forma price the DSCR lands at 1.14x, which fails the 1.25x lender convention and also the 1.15x floor written into the SBA’s own SOP. Declined. This is the model a buyer hands the lender. It is not a startup forecast; it is an acquisition underwrite.
What is inside
- Payer-mix revenue engine. Revenue is built from completed visits, not typed in: 8,000 visits a year at 32.0 a day, each payer carrying its own allowed rate per visit (commercial 135% of Medicare, workers’ compensation 138%, Medicaid 65%), a CQ differential line and a net-collection adjustment. A blended allowed rate of $110.37 becomes $846,667 of net collected revenue at $105.83 a visit – within pennies of the two published anchors we could find.
- The CQ differential, on its own sheet. The labour saving, the haircut and the net value of a PTA-delivered visit, payer by payer. The improvement plan the seller is charging you for is worth $33,261 on his arithmetic and $23,322 on yours: a capture rate of 70.1% on this payer mix, and only 47.9% on a Medicare-heavy book.
- DSCR true versus naive. 3.28x on the seller’s SDE with the owner’s clinical work counted at zero; 1.483x once you hire the therapist who replaces the owner at the chair ($113,832). The gap is not a rounding difference. It is a job.
- The schedule you already pay for. A 12% cancellation and no-show rate is 1,091 lost visits a year, $115,464 of allowed revenue at almost no incremental cost, equal to 51.1% of SDE. Break-even is 31.4 visits a day against 32.0 actual – a cushion of 0.61 visits.
- A dated, published down-case. Five consecutive years of Medicare conversion-factor cuts, with 2027 proposed at minus 1.68%, plus commercial rate pressure and a 4% wage step, drive the DSCR to 0.84x. Operating leverage 5.70x. Two documented mechanisms, not a recession back-test, and the model says so.
- SBA 7(a) capital stack. Buyer equity, a seller note (full-standby versus amortizing as a DSCR lever) and the loan: $463,135 at 76.6% leverage, ten years at 8.50%, with a real amortisation schedule, a 24.2% debt yield, and working capital sized properly – in an asset sale the seller keeps the receivables, so you fund about 35 days of payroll before the first cheque arrives.
- Three profiles, and the toggle is the payer mix. Medicare-Heavy Suburban (2.00x, $103.13 a visit, DSCR 1.32x, plan capture 47.9%), Balanced Commercial (2.25x, 1.48x, 70.1%), Workers’ Comp and Cash-Forward (2.60x, $117.66, 1.44x, 84.9%) – the last with an explicit flag on referral concentration, since workers’ compensation rates run from 64% to 207% of Medicare depending on the state.
Honest by design. The payer mix, the Medicaid and self-pay rates, the share of units carrying the CQ modifier, commercial adoption of it, the current and planned PTA share and the net-collection adjustment are declared model inputs with reference bands, not statistics dressed up as facts. The published evidence on cancellation and no-show rates conflicts and the model says so on the face of the sheet instead of picking a number quietly. The base adjusted-EBITDA margin of 13.25% is deliberately below what a listed multi-clinic platform reports, because a single clinic does not have that scale or contract leverage. There is no IRR anywhere in the workbook, by design: on a single small acquisition it is fragile. You get cash-on-cash by year, average cash-on-cash, a five-year MOIC flagged as leverage-amplified, and a payback period. This is the first acquisition-underwriting model for an outpatient PT clinic – not the first physical therapy model; operating and startup forecasts already exist and are good at what they do. Educational planning tool, not financial, lending, legal or medical advice.
Similar ProductsOther customers were also interested in...



 eFinancialModels
Electric Vehicle (EV) Charging Station Financial M...
With this comprehensive 5- or 10-year monthly tool, investors can assess the viability of setting up... Read more

Financial Model for Mobile App | Mobile App Busine...
The Mobile App Financial Plan Template in Excel allows you to develop financial projections when lau... Read more

 HenrySheykin
Food Truck Financial Model Excel Template
The Food Truck Financial Model helps entrepreneurs, founders, business owners, consultants, and anal... Read more

Green Hydrogen Production from Wind Energy Financi...
The Green Hydrogen from Wind Financial Model aims to comprehensively forecast a horizon of 40 years ... Read more

Simple Mutual Non-Disclosure Agreement Template
Protect your business secrets with ease using our Simple Mutual Non-Disclosure Agreement Template. S... Read more

Solar Energy Financial Model
The Solar Energy Financial Model Spreadsheet Template in Excel assists you in preparing a sophistica... Read more

 Peter Graf
The Customer-Centric Financial Model for Restauran...
Starting a restaurant without a financial plan is like driving a car blindfolded. You wouldn´t do i... Read more
You must log in to submit a review.