
0 ITEMS

Organic Gardening Financial Model Excel Template
The Gardening Service Financial Model helps users turn a lawn care, garden maintenance, or horticulture service concept into a structured financial forecast. Instead of relying on scattered estimates, the template gives entrepreneurs, business owners, consultants, analysts, and founders a practical way to organize revenue assumptions, startup costs, operating expenses, payroll, cash flow, profitability, and funding needs in one editable model. It is designed for users preparing business plans, investor presentations, bank loan applications, internal budgets, or expansion decisions for a gardening service business. This financial model template is especially useful for planning a service business where revenue depends on customer acquisition, recurring service packages, seasonal add-ons, crew capacity, pricing, and retention. Users can adjust assumptions such as marketing spend, customer acquisition cost, service pricing, labor needs, direct supplies, equipment investment, subcontractor costs, and overhead to see how different choices affect financial results. The model supports up to five years of projections, helping users evaluate not only whether the business can launch, but whether it can scale into a sustainable and profitable operation over time. The template brings together core financial planning outputs, including revenue forecasting, expense planning, cash flow projections, profitability analysis, investor metrics, and break-even analysis. This makes it easier to understand how much capital may be needed at the beginning, how long cash reserves may last, when the business may become profitable, and which assumptions have the biggest impact on performance. Because the fields are fully customizable, users can tailor the model to a small local gardening operation, a growing lawn care company, or a broader garden maintenance service with multiple packages and recurring customers. Built for decision-making, the Gardening Service Financial Model helps users compare scenarios, test assumptions, prepare lender-friendly outputs, and communicate the financial story clearly. Whether the goal is to secure funding, evaluate a new business idea, improve an existing operation, or present a polished forecast to stakeholders, the template saves time by providing a ready-made structure with editable inputs, automated calculations, professional summaries, and visual reporting. It gives users a clearer view of revenue potential, cost pressure, cash flow timing, profitability milestones, and the operational decisions needed to build a financially viable gardening service.
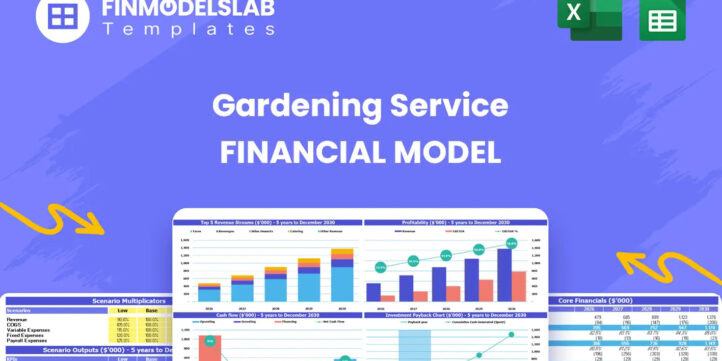


Financial Model Overview
The Gardening Service Financial Model is a ready-to-use financial model template built for entrepreneurs, business owners, consultants, analysts, and founders planning a gardening service, lawn care company, garden maintenance operation, or horticulture service business. It helps convert the operating logic of the business into a structured five-year forecast, connecting service pricing, customer acquisition, recurring demand, seasonal add-ons, staffing, equipment, direct costs, overhead, cash flow, and profitability. For a gardening service, the numbers can become difficult to manage quickly because growth depends on marketing efficiency, customer volume, route capacity, labor availability, fuel and supply costs, and the timing of equipment investment. This template gives users a clear framework for testing those assumptions before launch, during funding preparation, or while planning expansion. Instead of building a spreadsheet from scratch, users can customize the model with their own prices, service packages, marketing plans, payroll structure, startup costs, and growth strategy, then review the outputs in a professional format suitable for internal planning, investor conversations, lender discussions, and business plan documentation.
All-in-One Dashboard
The all-in-one dashboard brings the core inputs and core outputs of the Gardening Service Financial Model into one central planning view. It is designed to help users quickly understand how the business is expected to perform without having to search through multiple tabs or manually compile results. The dashboard may summarize assumptions such as service pricing, customer growth, marketing spend, cost structure, payroll, startup investment, and funding needs, then connect those inputs to outputs such as revenue, gross profit, EBITDA, net income, cash balance, payback period, and other key performance indicators. For a gardening service business, this is especially useful because the owner or planner needs to see how operating decisions affect the overall financial picture. If customer acquisition cost changes, service package pricing is adjusted, or staffing is increased, the dashboard helps show the effect on profitability and cash flow. This component supports faster decision-making, cleaner business plan preparation, and more confident stakeholder communication by providing a concise snapshot of the financial forecast.
Low, Base, and High Scenario Analysis
The low, base, and high scenario analysis component helps users evaluate how the gardening service may perform under different market and operating conditions. A base case can represent the expected plan, while a low case can reflect slower customer growth, higher costs, weaker pricing, or a more difficult funding environment. A high case can model stronger demand, better marketing efficiency, improved margins, or faster route expansion. Inputs may include customer acquisition cost, marketing budget, service package adoption, pricing, labor costs, fuel costs, subcontractor costs, supplies, and overhead. The output helps users compare revenue, profit, cash flow, runway, and funding requirements across multiple outcomes. This is valuable for a gardening service because the business can be sensitive to seasonality, local competition, customer retention, and field operating costs. By testing different assumptions, users can prepare contingency plans, understand risk, and avoid relying on a single optimistic forecast. For investors, lenders, and internal decision-makers, scenario analysis also demonstrates that the business plan has been pressure-tested and that management understands the drivers behind the numbers.
Professional Charts
The professional charts component converts financial results into clear visual reports that can be used in presentations, business plans, investor updates, or internal reviews. Rather than showing only rows of spreadsheet data, this section helps communicate the story behind the Gardening Service Financial Model through charts that may illustrate revenue growth, expense trends, EBITDA progression, cash balance, customer growth, revenue mix, profit margins, or funding requirements. For a gardening service, visual reporting is useful because many stakeholders want to quickly understand whether the business can grow from early startup losses into sustainable profitability. Charts can show how recurring service packages build over time, how customer acquisition improves as the brand becomes established, or how direct costs and payroll affect margin development. This component makes the model more presentation-ready and easier to understand for non-financial audiences. It also helps owners and managers review performance at a glance, identify trends, spot pressure points, and explain the financial plan in a polished, professional way during funding discussions or strategic planning meetings.
ROE Components and DuPont Analysis
The ROE components and DuPont analysis section helps users understand what is driving return on equity in the gardening service business. Instead of looking only at a single return figure, this component breaks performance into the underlying drivers that influence investor returns, such as profitability, asset efficiency, and financial leverage. Inputs may include net income, revenue, total assets, equity, debt, operating margin, and other balance sheet assumptions. The outputs help show whether returns are being generated through strong margins, efficient use of assets, or the way the business is financed. For a gardening service, this is helpful because the business often requires investment in vans, mowers, tools, storage, equipment, and working capital before revenue reaches scale. DuPont analysis can clarify whether the business is using those assets effectively and whether the expected return justifies the capital required. This component supports investor conversations, ownership planning, and long-term strategic decision-making by helping users move beyond surface-level profit figures and examine the quality of financial performance.
Revenue Inputs
The revenue inputs component is where users define the commercial assumptions that drive the Gardening Service Financial Model. This section may include pricing for different service packages, customer acquisition cost, marketing spend, conversion assumptions, customer growth, retention, service frequency, seasonal add-ons, and recurring monthly fees. For a gardening service, revenue is often built from a mix of essential lawn care, garden maintenance packages, premium bundles, seasonal cleanup, planting support, fertilization, and other add-on services. By setting these assumptions clearly, users can model how customer volume and service mix translate into monthly and annual revenue. The section is useful because small changes in pricing, customer acquisition cost, or package adoption can materially affect profitability and cash flow. It also helps users understand whether their marketing budget can realistically support the desired customer base. Because the inputs are editable, the template can be adapted to a small local operator, a larger maintenance company, or a growing service provider with multiple teams. This component creates the foundation for a credible forecast by linking operational sales assumptions directly to financial outcomes.
Bank-Ready Reports
The bank-ready reports component organizes the financial outputs into a format that can support lender reviews, loan applications, funding requests, and formal business planning. Banks and lenders typically want to see clear projections, realistic assumptions, cash flow coverage, startup investment needs, profitability timing, and the ability of the business to manage debt or operating obligations. This section may include forecasted profit and loss, cash flow statements, balance sheet summaries, funding needs, debt repayment assumptions, and key financial metrics. For a gardening service, lender-friendly reporting is important because startup and expansion plans often involve financing for service vans, mowers, major equipment, storage space, office setup, and working capital. The model helps users present those needs in a structured way, showing not only what funds are required but also how the business expects to generate revenue and repay obligations over time. This component saves time during funding preparation and helps users communicate their financial plan with more credibility. It is also useful for consultants and analysts preparing financial documentation on behalf of clients.
Revenue Breakdown
The revenue breakdown component provides a detailed view of how different income streams contribute to total sales. Instead of treating the gardening service as one generic revenue line, this section can separate income by service package, recurring maintenance plan, premium bundle, seasonal add-on, one-time project, or other revenue category. Inputs may include customer counts, pricing, service frequency, monthly demand, adoption rates, and growth assumptions for each revenue stream. Outputs can show monthly and annual revenue by category, total revenue mix, and the contribution of each service line to overall growth. This is particularly useful for a gardening service because not all services have the same margin, staffing requirement, seasonality, or customer retention profile. A recurring lawn care package may provide stable revenue, while seasonal add-ons may create periodic boosts, and premium bundles may improve average revenue per customer. By reviewing the revenue breakdown, users can identify which offerings deserve more marketing attention, which prices may need adjustment, and which services are most important to achieving profitability. This component supports better pricing strategy, sales planning, and operational focus.
KPI Dashboard
The KPI dashboard component tracks the key performance indicators that matter most to a gardening service business. It may include metrics such as revenue growth, gross margin, EBITDA margin, customer acquisition cost, customer count, average revenue per customer, cash balance, payback period, return on equity, break-even timing, and other planning benchmarks. The purpose of this section is to translate the financial model into practical performance signals that owners and stakeholders can monitor over time. For a gardening service, KPIs are valuable because profitability depends on a combination of sales efficiency, labor productivity, route utilization, direct cost control, and customer retention. If marketing spend rises but customer growth does not improve, the KPI dashboard can make that issue visible. If payroll or supply costs grow faster than revenue, the model can highlight margin pressure. This component is useful for business planning, investor reporting, monthly management reviews, and operational decision-making. It helps users move from a static forecast to an active management tool by identifying the metrics that should be watched as the business launches, scales, and matures.
Break-Even Analysis
The break-even analysis component helps users estimate when the gardening service may begin generating enough revenue to cover its fixed and variable costs. This section may use inputs such as monthly revenue, service pricing, direct supplies, subcontractor labor, payroll, rent, vehicle costs, marketing, insurance, software, administrative expenses, and other overhead. The outputs can show the break-even month, required revenue level, required customer volume, and the relationship between cost structure and profitability. For a gardening service, this is one of the most important planning tools because the early years may involve heavy investment in equipment, staff, customer acquisition, and brand development before the customer base is large enough to support the operation. Break-even analysis helps users understand whether the current plan is realistic and what must change to reach profitability sooner. It can also show the impact of increasing premium package sales, improving route efficiency, reducing customer acquisition cost, negotiating supply discounts, or controlling fixed overhead. This component is useful for founders, lenders, and investors because it answers a direct question: how much activity is needed before the business becomes financially sustainable.
Startup and Operating Cost Planning
The startup and operating cost planning component organizes the investment required to launch and run the gardening service. Startup costs may include service vans, mowers, tools, major equipment, office setup, storage fitout, licenses, insurance deposits, branding, website setup, initial marketing, uniforms, software, and working capital. Operating expenses may include payroll, fuel, maintenance, supplies, subcontracted labor, rent, utilities, insurance, marketing, administrative costs, technology, and other recurring overhead. The outputs help users estimate total funding required before launch, monthly spending levels, and the cost base that revenue must support. This component is valuable because gardening services can appear simple on the surface but often require meaningful upfront investment and disciplined expense control. A business may need to buy or lease equipment before customer revenue is fully established, and payroll must be planned carefully as service demand grows. By separating startup investment from ongoing operating costs, the model helps users build a more accurate budget, avoid undercapitalization, and make better decisions about purchasing equipment, hiring staff, outsourcing work, or pacing expansion. It also supports funding requests by showing exactly how capital will be used and why each cost category matters.
File types:
Excel – Single-User: .xlsx
Excel – Multi-User: .xlsx
Similar ProductsOther customers were also interested in...


 HenrySheykin
Vegetable Farming Financial Model Excel Template
The Vegetable Farming Financial Model helps users turn a farming concept, expansion plan, or funding... Read more
Mushrooms Farming Financial Model Excel Template
The Mushroom Farming Financial Model helps entrepreneurs, growers, business owners, consultants, and... Read more
Cotton Growing Financial Model Excel Template
The Cotton Farming Financial Model Financial Model Template helps entrepreneurs, farm owners, consul... Read more
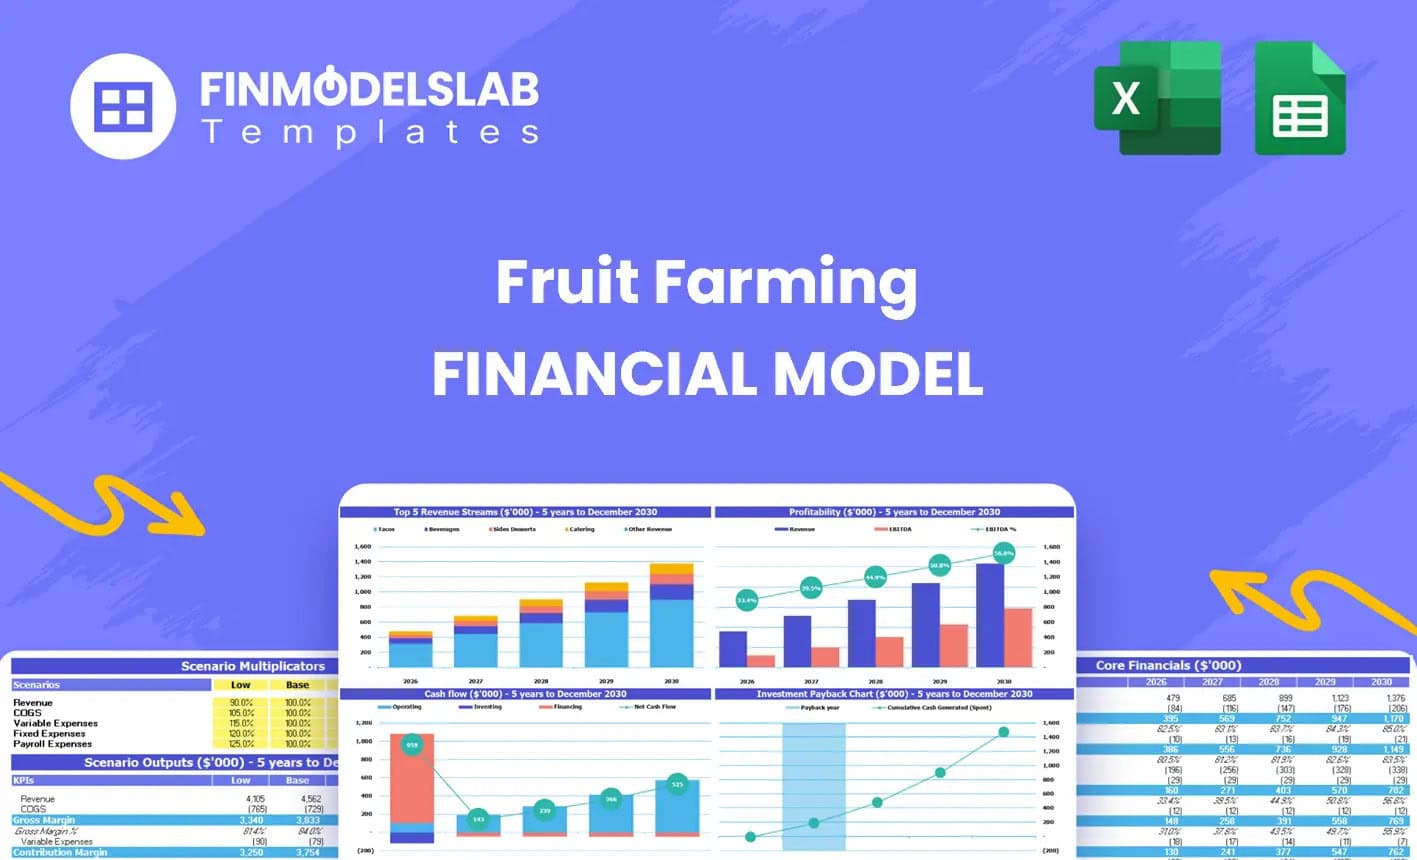
Fruits Farming Financial Model Excel Template
The Fruit Farming Financial Model helps users turn a fruit farm concept, orchard expansion, or agric... Read more
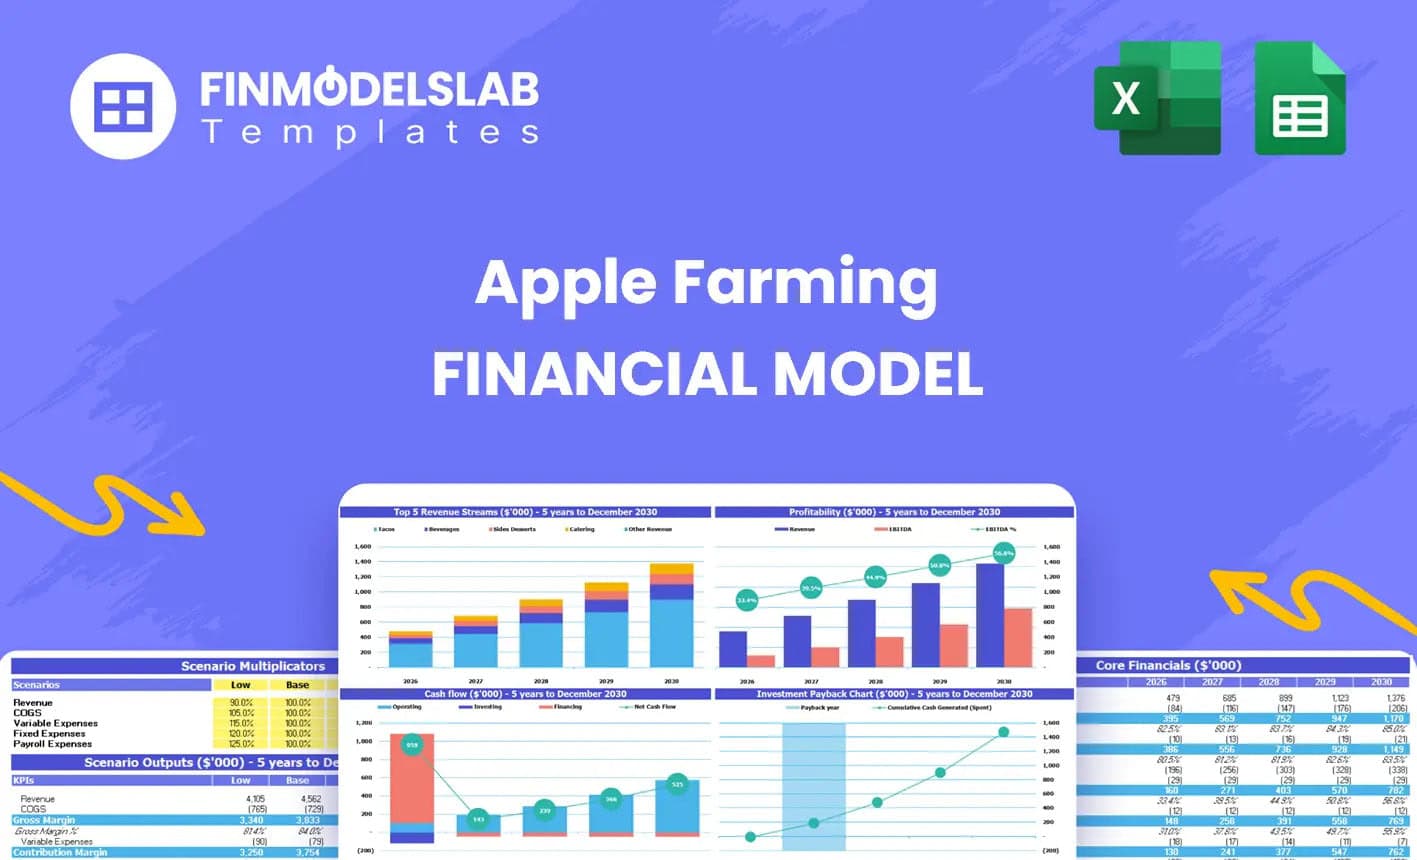
Apple Farming Financial Model Excel Template
The Apple Farming Financial Model helps users turn an orchard business plan into a structured, edita... Read more
 Andreas
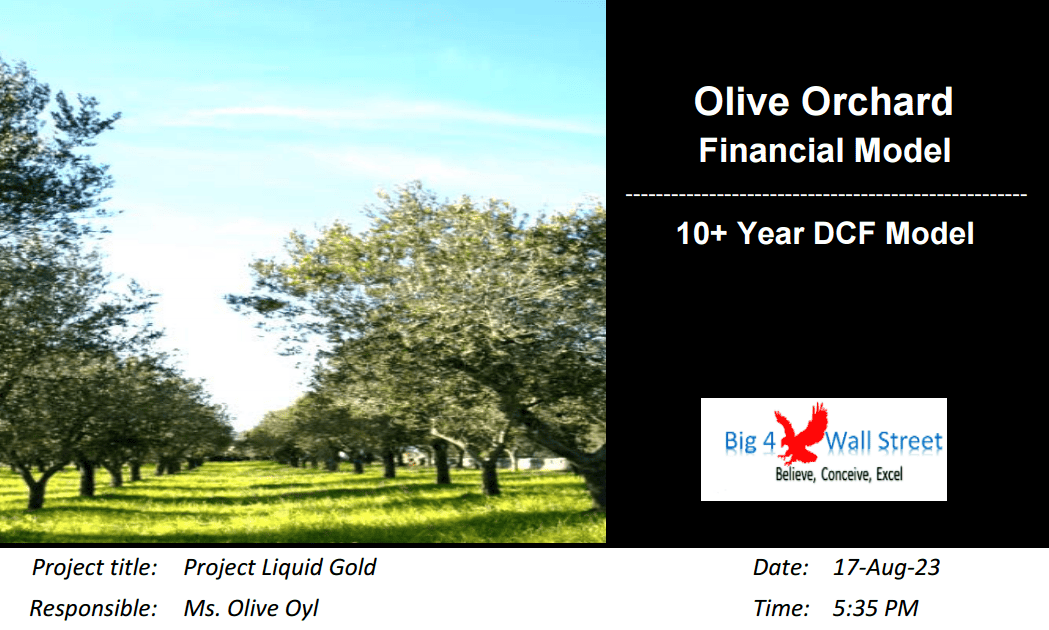
Olive Orchard Business – DCF 10-Year Financi...
The Olive Orchard Financial Model is a comprehensive tool tailored to analyze the financial aspects ... Read more
 Luigi R.
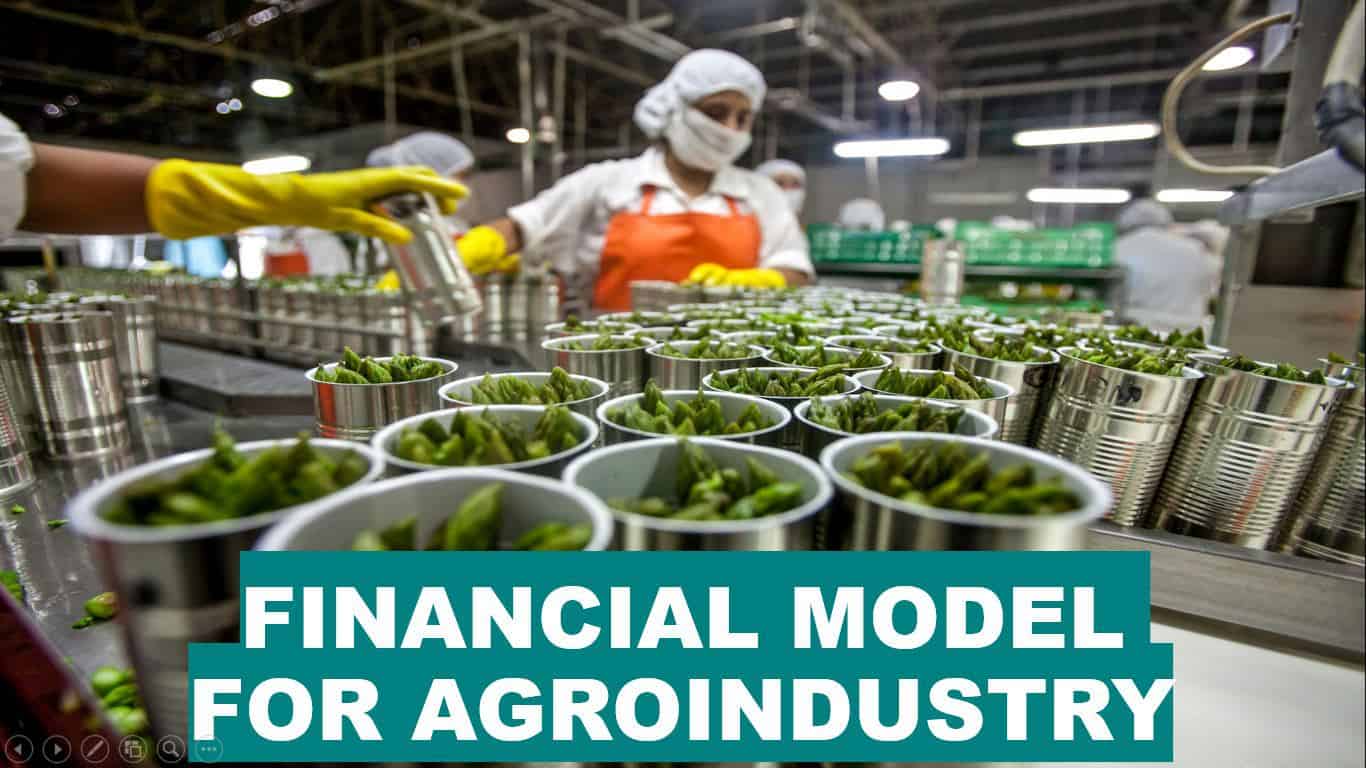
Financial Model for AGROINDUSTRY
The financial model I have built contains all the advanced corporate finance concepts referring to a... Read more
 Giorgos
Crop Farm Financial Model – Dynamic 10 Year Fore...
If you want to start a crop farm from scratch or you need a sample crop farm business plan template,... Read more
Sunflower Farm & Oil Processing Plant Financia...
Sunflower is not only one of the most important oil seed crops, but it is also a major source of con... Read more
Fruit Processing Facility – 10 Year Financia...
Financial Model providing a dynamic up to 10-year financial forecast for a startup Fruit Processing ... Read more
Reviews
 Organic farm
Finmodelslab models are very detailed and well explained inside the wks. This VDO is a great plus for further understanding, which makes us save lots of time. Thank you
Thank you for your feedback.
1183 of 2257 people found this review helpful.
You must log in to submit a review.