
0 ITEMS

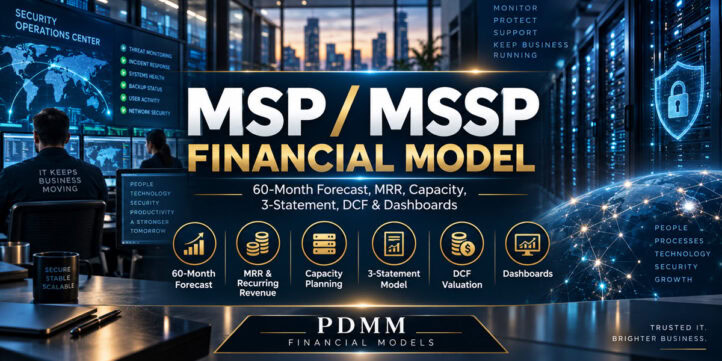
MSP / MSSP Financial Model | 60-Month Forecast, MRR, Capacity, 3-Statement, DCF & Dashboards
MSP / MSSP Financial Model – 60-Month Forecast, MRR, Capacity, 3-Statement, DCF & Dashboards 🛡️ Connect managed-services commercial terms, recurring revenue, technical delivery, security-stack economics, cash flow, and valuation in one integrated Excel model. This workbook is designed for managed service providers (MSPs), managed security service providers (MSSPs), IT-services operators, finance teams, founders, advisors, and acquisition buyers who need to understand not only how much revenue the business can generate, but also whether pricing, staffing, vendor costs, service levels, retention, working capital, and capital structure support that growth.

MSP / MSSP Financial Model – 60-Month Forecast, MRR, Capacity, 3-Statement, DCF & Dashboards
🛡️ Connect managed-services commercial terms, recurring revenue, technical delivery, security-stack economics, cash flow, and valuation in one integrated Excel model. This workbook is designed for managed service providers (MSPs), managed security service providers (MSSPs), IT-services operators, finance teams, founders, advisors, and acquisition buyers who need to understand not only how much revenue the business can generate, but also whether pricing, staffing, vendor costs, service levels, retention, working capital, and capital structure support that growth.
Seller-supplied and already tested; no Studio workbook audit was performed.
🎯 The buyer problem this model addresses
MSP/MSSP economics are interconnected. A change in seat pricing or endpoint pricing affects MRR; client mix changes tool-stack cost and gross margin; churn changes the installed base; ticket demand and resolution effort affect technician capacity; security attach rates affect revenue and vendor spend; cloud resale creates a separate margin stream; staffing and overhead flow into EBITDA; receivables and payables influence cash; and these operating results ultimately affect acquisition value. Managing those relationships in separate spreadsheets can make planning slow and difficult to reconcile.
This model brings those drivers together across a 60-month monthly forecast with annual valuation outputs, linked operating schedules, three financial statements, sensitivity analysis, and management dashboards.
⚙️ Model workflow
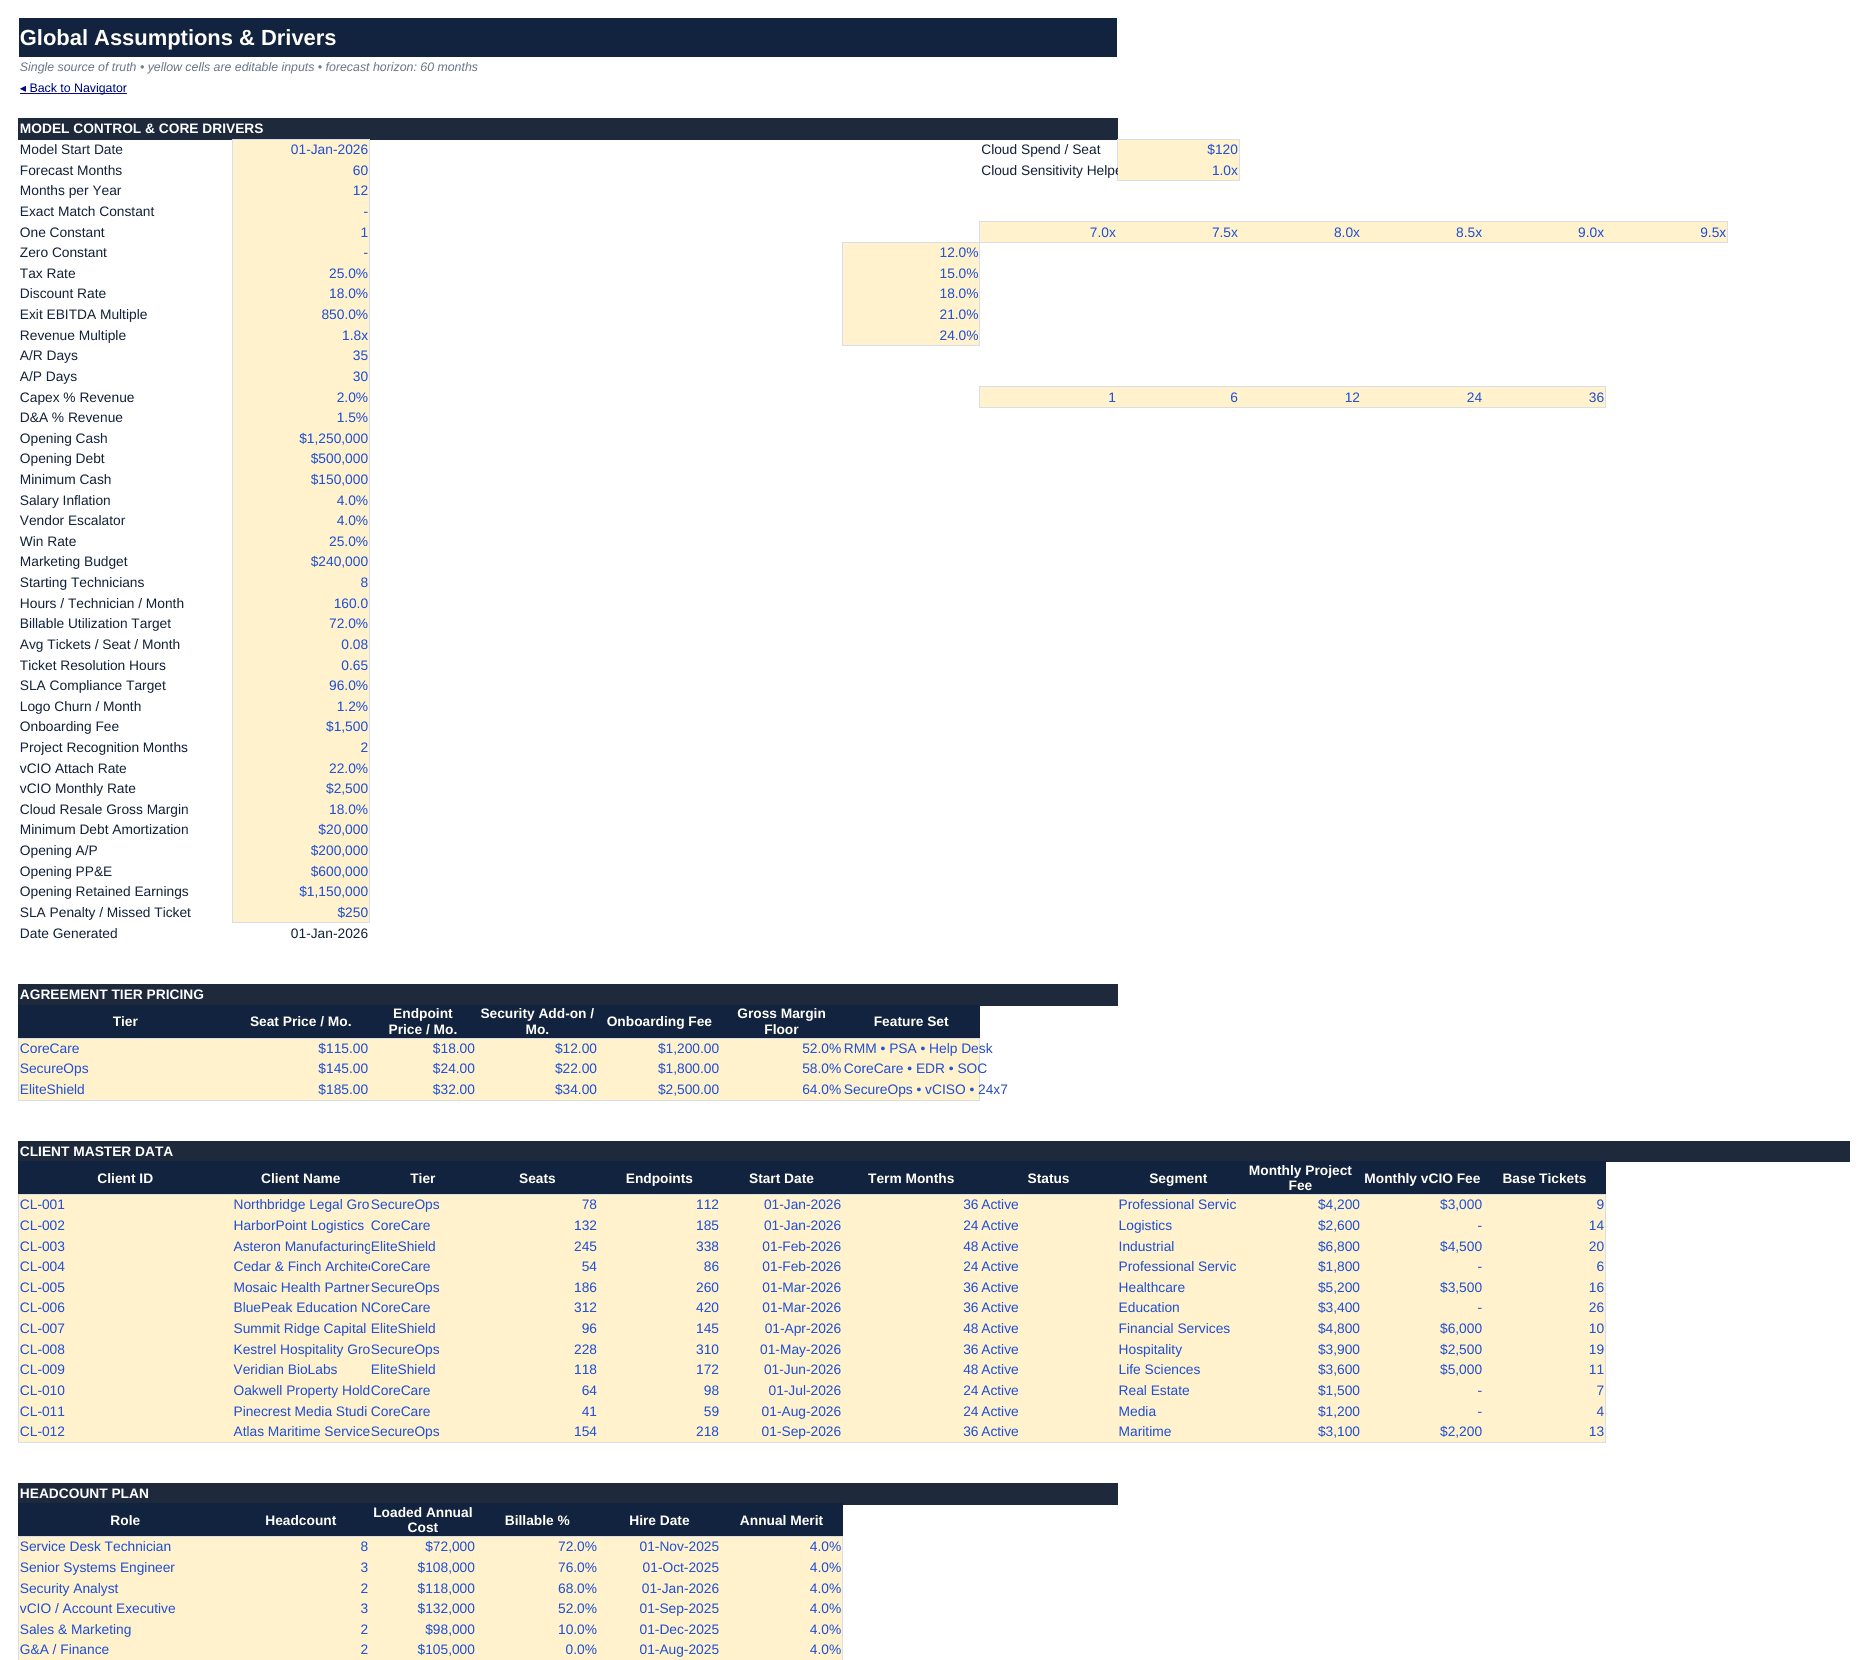
1. Set the operating assumptions in the Global Assumptions & Drivers sheet. The workbook identifies yellow cells as the raw-input zone.
2. Define the commercial base through the client/contract register and agreement tiers, including seats, endpoints, service tier, start date, term, project fees, vCIO fees, ticket assumptions, and segment.
3. Build recurring and project revenue through the MRR, seat/endpoint, onboarding/project, vCIO, security, and cloud-resale schedules.
4. Translate demand into operating requirements using churn/retention, technician capacity, ticket volume, SLA, and utilization schedules.
5. Roll up cost and profitability through tool-stack COGS, technical payroll, headcount/OPEX, client margin, and concentration analysis.
6. Review the integrated financial statements for monthly revenue, profitability, balance-sheet movement, and cash flow.
7. Assess value and decision outputs through the DCF/acquisition sheet and the executive, sales/growth, and technical-operations dashboards.
✏️ Editable inputs and commercial drivers
The assumptions area includes model start date and forecast length; tax and discount rates; exit EBITDA and revenue multiples; A/R and A/P days; capex and depreciation assumptions; opening cash, debt, payables, PP&E and retained earnings; minimum cash; salary inflation and vendor escalation; sales win rate and marketing budget; technician headcount, hours and utilization target; tickets per seat, resolution time, SLA target and penalty assumptions; monthly logo churn; onboarding fee and project-recognition period; vCIO attach rate and monthly rate; cloud-resale gross margin; debt amortization; agreement-tier pricing; client master data; headcount costs; tool/vendor economics; OPEX; and sales-pipeline assumptions.
The workbook uses illustrative client and operating data that can be replaced with the buyer’s own assumptions.
📚 Worksheet coverage
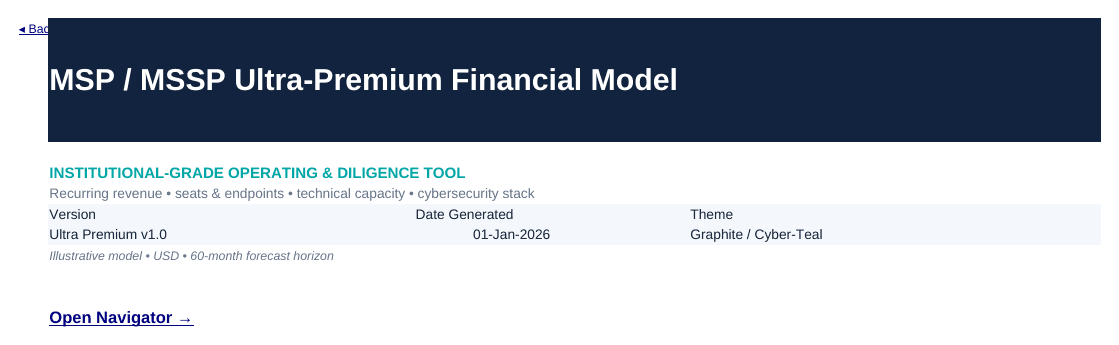
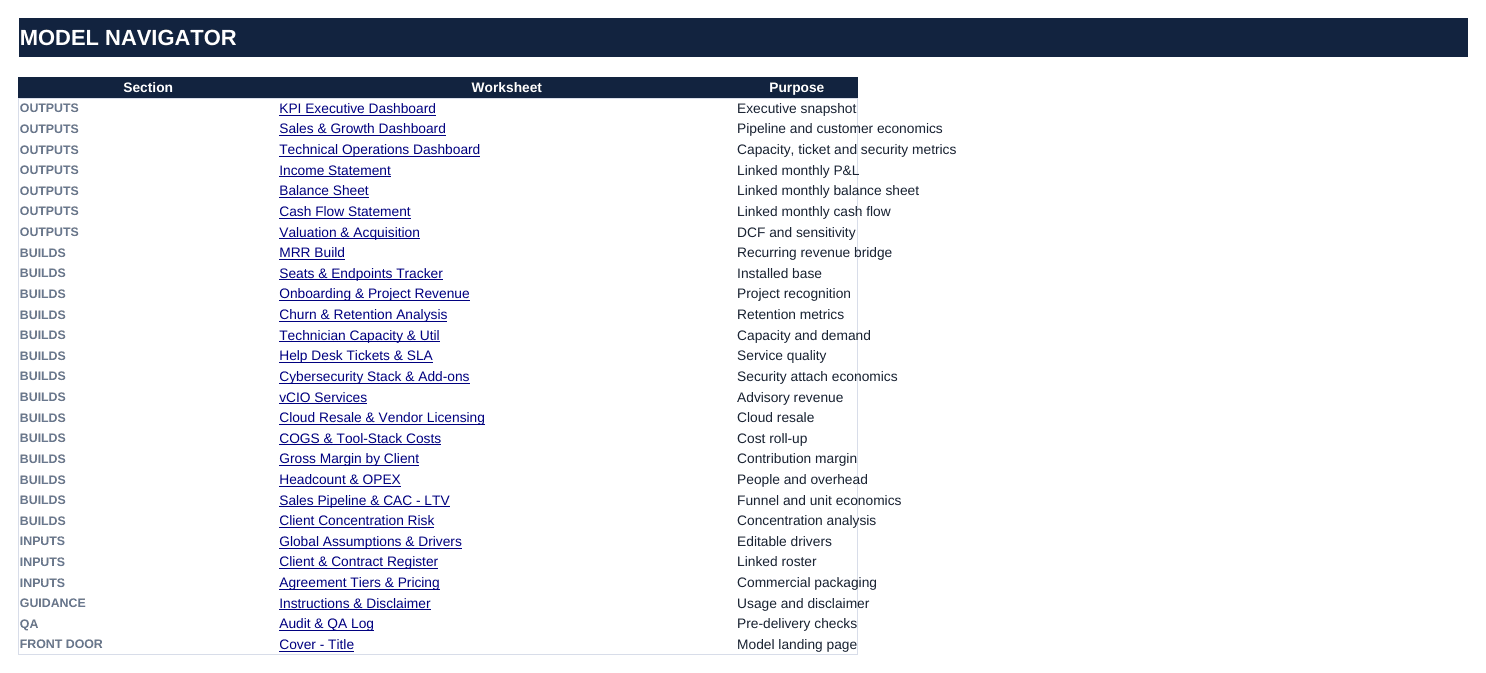
Navigation & guidance: Cover – Title, Instructions & Disclaimer, and Navigator (Table of Contents) provide the front door, usage guidance, and hyperlinks across the model.
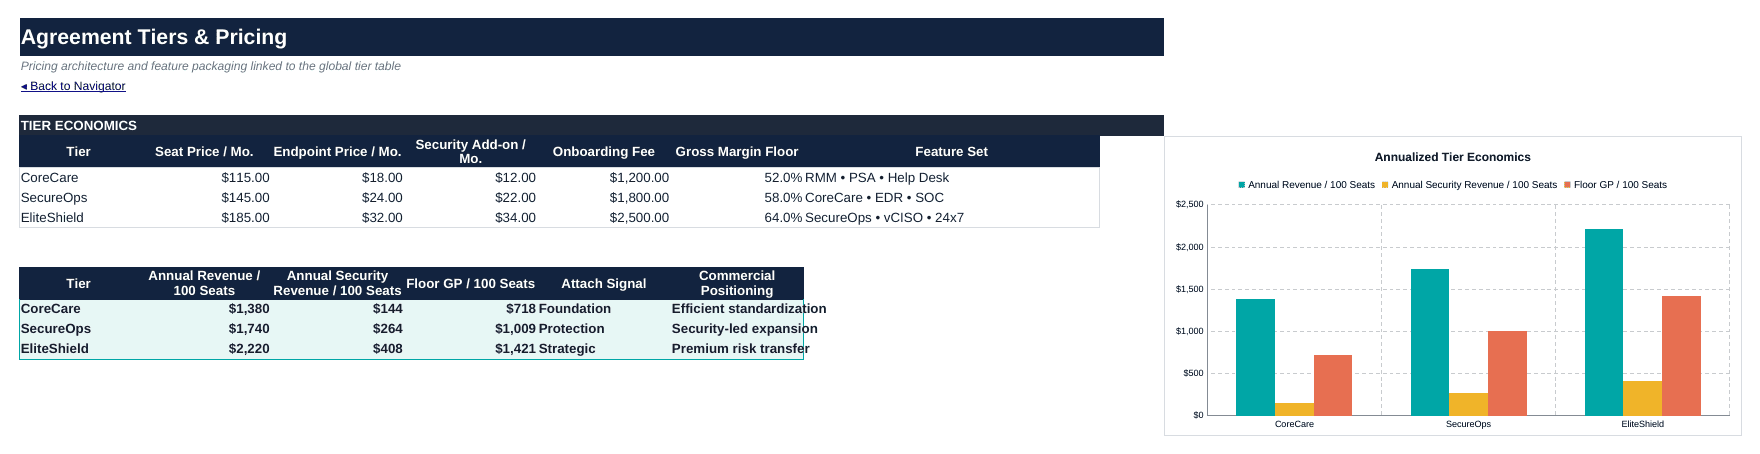
Inputs & commercial architecture: Global Assumptions & Drivers centralizes editable drivers; Client & Contract Register holds client-level operating data; Agreement Tiers & Pricing defines CoreCare, SecureOps, and EliteShield commercial packaging with seat, endpoint, security add-on, onboarding, margin-floor, and feature-set fields.
Revenue & retention: MRR Build creates the recurring-revenue bridge; Seats & Endpoints Tracker follows the installed base; Onboarding & Project Revenue schedules one-time/project recognition; Churn & Retention Analysis tracks active logos, revenue churn, net revenue retention, gross revenue retention, and cumulative logo retention; vCIO Services models advisory-retainer economics; Cloud Resale & Vendor Licensing models resale revenue, vendor cost, and gross margin.
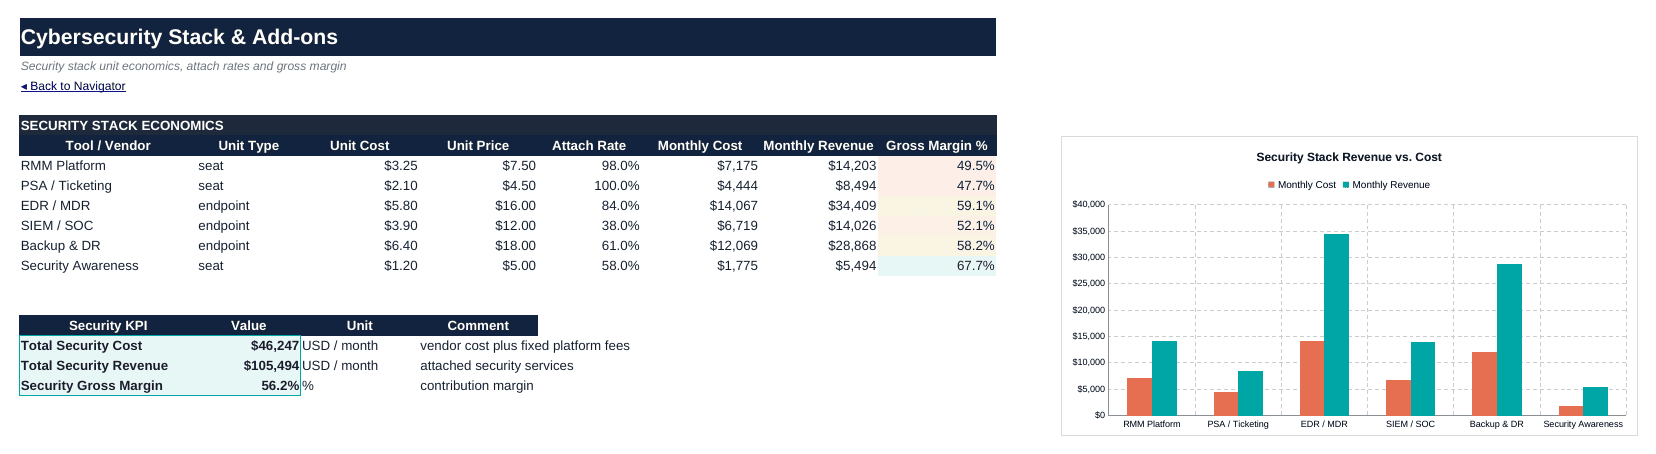
Service delivery & security economics: Technician Capacity & Util links headcount, available hours, demand hours, utilization, and headroom; Help Desk Tickets & SLA connects ticket volumes, resolution effort, SLA performance, breach gap, and penalty exposure; Cybersecurity Stack & Add-ons models RMM, PSA/ticketing, EDR/MDR, SIEM/SOC, backup/DR, and security-awareness unit economics and attach rates.
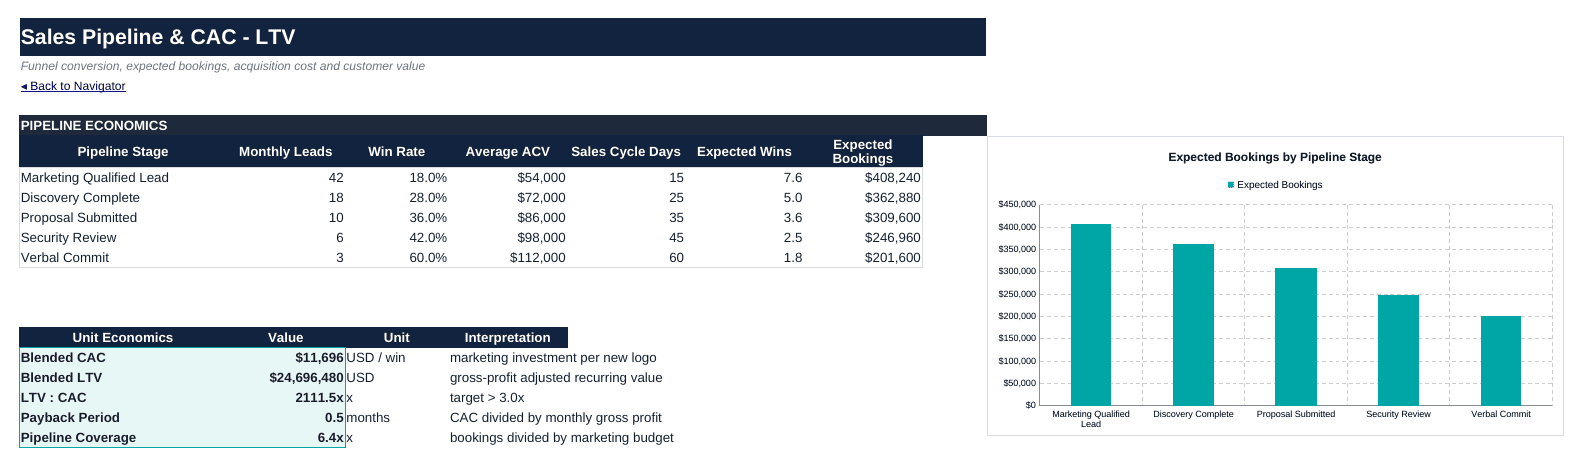
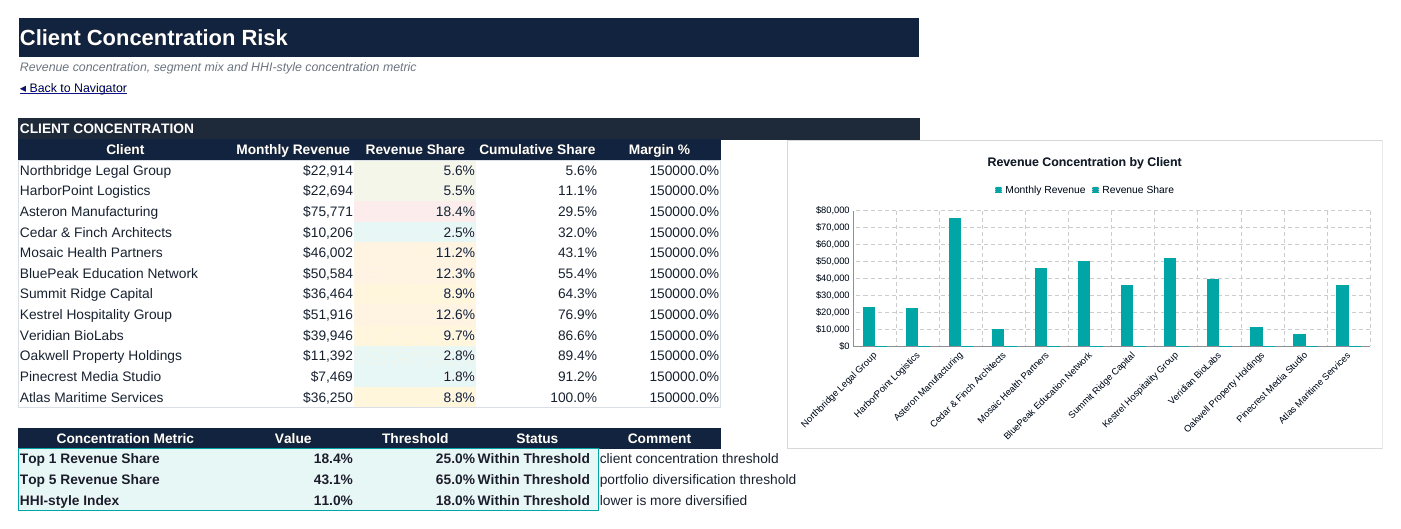
Cost, profitability & risk: COGS & Tool-Stack Costs rolls recurring vendor, cloud, and technical-delivery costs into gross profit and margin; Gross Margin by Client provides client-level contribution analysis; Headcount & OPEX summarizes loaded payroll and operating expenses; Sales Pipeline & CAC – LTV converts funnel stages into expected wins/bookings and acquisition economics; Client Concentration Risk tracks revenue share, cumulative concentration, top-client exposure, and an HHI-style metric.
Financial statements: Income Statement, Balance Sheet, and Cash Flow Statement provide linked monthly financial statements across the model horizon, including revenue streams, COGS, gross profit, EBITDA, working capital, debt, retained earnings, operating cash flow, investing cash flow, financing cash flow, and ending cash.
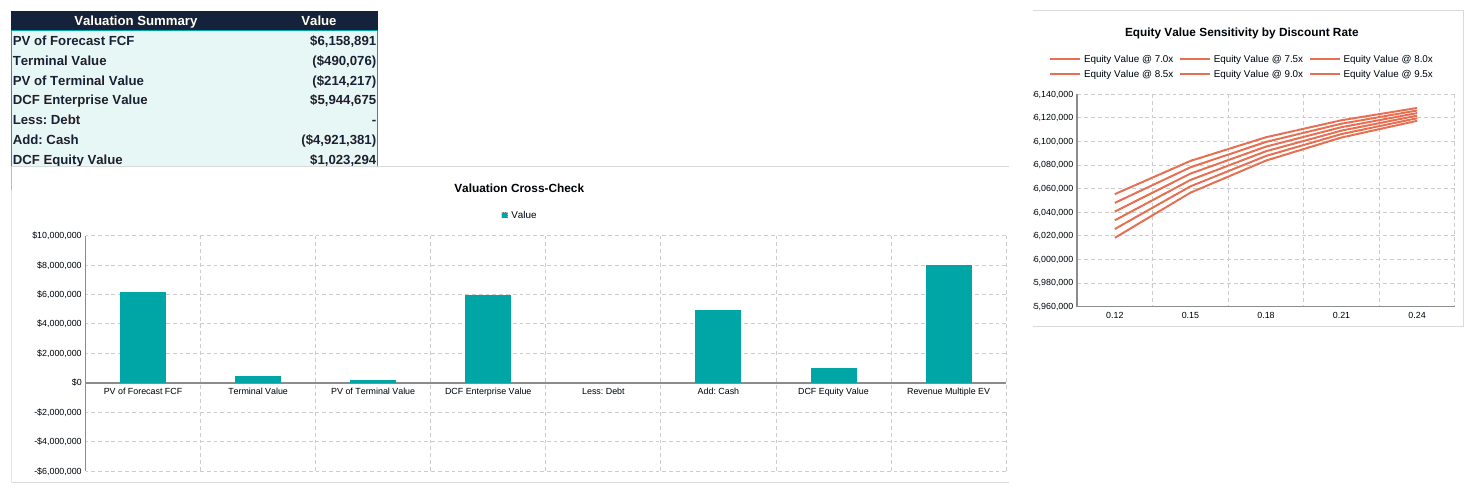
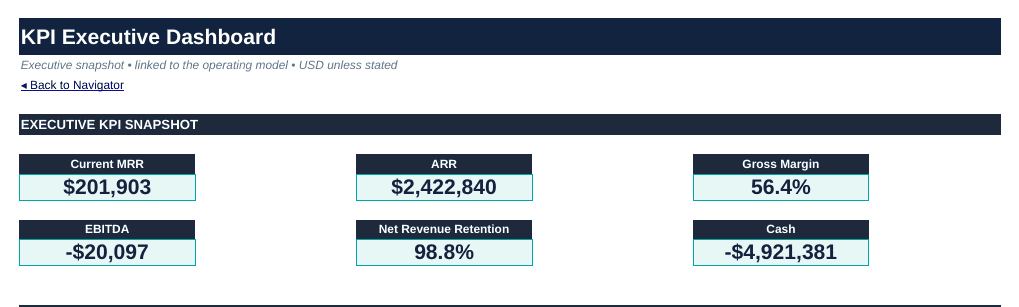
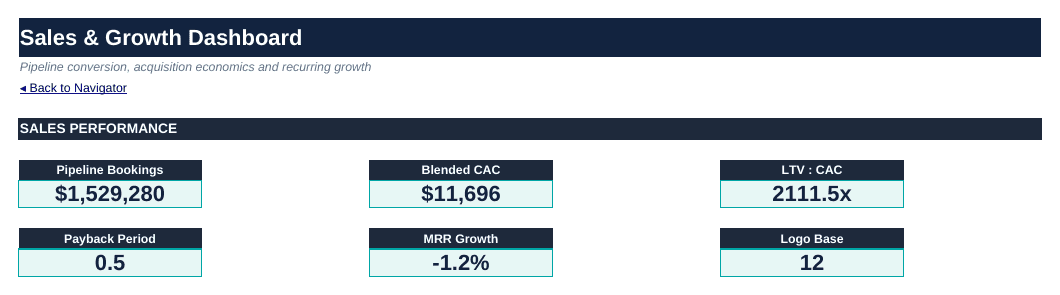
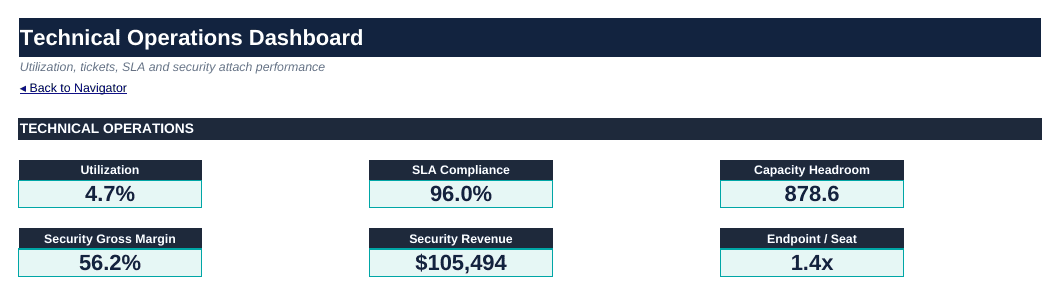
Valuation & dashboards: Valuation & Acquisition converts annual operating outputs into DCF and revenue-multiple cross-checks and includes a two-dimensional equity-value sensitivity table using discount rate and exit EBITDA multiple. KPI Executive Dashboard summarizes MRR, ARR, gross margin, EBITDA, net revenue retention, cash, and multi-year trends. Sales & Growth Dashboard focuses on bookings, CAC, LTV:CAC, payback, MRR growth, logo base, and funnel performance. Technical Operations Dashboard focuses on utilization, SLA compliance, capacity headroom, security gross margin/revenue, endpoint-to-seat metrics, ticket volume, and technical trends.
The workbook also contains a seller-supplied Audit & QA Log as part of its own documentation. It is not a Studio audit.
🔄 Scenario and sensitivity analysis
There is no separate named scenario switch in the workbook. Scenario-style what-if analysis is performed by changing the editable assumptions – for example pricing, churn, capacity, staffing costs, vendor escalation, marketing, working-capital days, or valuation inputs – and following the linked schedules and dashboards. For valuation, the workbook provides a dedicated DCF equity-value sensitivity matrix across discount rates and exit EBITDA multiples. A cloud sensitivity helper is also present in the assumptions sheet.
📊 Key management outputs
The model surfaces recurring-revenue and operating KPIs including MRR, ARR, gross margin, EBITDA, NRR/GRR, active logos, seat/endpoint base, technician utilization, capacity headroom, ticket demand, SLA compliance, security revenue and margin, cloud-resale economics, pipeline bookings, CAC, LTV:CAC, payback period, client concentration, cash, and DCF/acquisition value cross-checks.
✅ Practical use cases
- Build a 60-month operating and financial forecast for an MSP or MSSP.
- Plan MRR and ARR from client, seat, endpoint, security, vCIO, project, and cloud drivers.
- Test pricing and service-tier economics before changing commercial packages.
- Analyze client-level profitability and portfolio gross-margin mix.
- Forecast cash flow and working capital using A/R, A/P, capex, debt, and opening-balance assumptions.
- Plan technician capacity, utilization, and hiring needs against ticket-driven service demand.
- Evaluate help-desk SLA economics and potential penalty exposure.
- Model cybersecurity add-on profitability and vendor/tool-stack economics.
- Analyze cloud-resale revenue and gross margin as a separate service stream.
- Evaluate sales pipeline, bookings, CAC, LTV:CAC, and payback for growth planning.
- Stress churn, retention, pricing, cost, and operating assumptions through linked what-if analysis.
- Monitor client concentration risk and dependence on top accounts.
- Support acquisition, diligence, and valuation discussions with DCF, revenue-multiple cross-checks, and discount-rate/exit-multiple sensitivity.
👥 Intended users
This model is relevant for MSP/MSSP founders and owners, CFOs and finance managers, FP&A teams, service-delivery leaders, cybersecurity-service operators, sales leaders, fractional CFOs, consultants, independent sponsors, search-fund teams, and buyers evaluating an IT-services platform or add-on acquisition.
📦 Files in the upload package
- Editable Excel workbook (.xlsx): 28 worksheets and a 60-month monthly model with linked operating, financial, valuation, and dashboard sections.
- Full-sheet PDF preview: 28 pages, one page per worksheet, for marketplace preview and review.
- Buyer-facing PNG screenshots: curated views of the cover, navigator, assumptions, client register, pricing, security economics, pipeline, concentration, valuation, and dashboards.
The editable Excel workbook is the primary product. All client names and sample operating data shown in the workbook are illustrative and intended to be replaced with buyer-specific information.
Similar ProductsOther customers were also interested in...



 eFinancialModels
Electric Vehicle (EV) Charging Station Financial M...
With this comprehensive 5- or 10-year monthly tool, investors can assess the viability of setting up... Read more

Financial Model for Mobile App | Mobile App Busine...
The Mobile App Financial Plan Template in Excel allows you to develop financial projections when lau... Read more

 HenrySheykin
Food Truck Financial Model Excel Template
The Food Truck Financial Model helps entrepreneurs, founders, business owners, consultants, and anal... Read more

Green Hydrogen Production from Wind Energy Financi...
The Green Hydrogen from Wind Financial Model aims to comprehensively forecast a horizon of 40 years ... Read more

Simple Mutual Non-Disclosure Agreement Template
Protect your business secrets with ease using our Simple Mutual Non-Disclosure Agreement Template. S... Read more

Solar Energy Financial Model
The Solar Energy Financial Model Spreadsheet Template in Excel assists you in preparing a sophistica... Read more

 Peter Graf
The Customer-Centric Financial Model for Restauran...
Starting a restaurant without a financial plan is like driving a car blindfolded. You wouldn´t do i... Read more
You must log in to submit a review.