
0 ITEMS

Medical Equipment Manufacturing Business Plan Financial Model Excel Template
The Medical Equipment Manufacturing Financial Model helps entrepreneurs, founders, consultants, analysts, and business owners turn a complex manufacturing concept into a structured financial forecast. Instead of starting with a blank spreadsheet, users can work from a ready-to-use financial model template built around the realities of medical device production, including product revenue assumptions, capital investment, operating expenses, payroll, cash flow, and profitability. It is designed to support business planning, investor conversations, lender reviews, internal budgeting, and strategic decision-making for a medical equipment manufacturing venture. This template is especially useful for teams preparing a business plan, pitch deck, funding application, or expansion strategy. Medical equipment manufacturing often involves high upfront investment, specialized facilities, regulatory and quality requirements, technical staff, component costs, and long-term production planning. The model helps organize those assumptions into a connected forecast so users can estimate startup costs, map revenue potential, review operating expenses, evaluate payroll needs, and understand how changes in pricing, volume, margins, or hiring plans affect financial outcomes. The Medical Equipment Manufacturing Financial Model includes editable assumptions and automated outputs that help users evaluate revenue growth, cash flow requirements, profitability, and break-even timing. It allows users to test low, base, and high scenarios, review investor-friendly financial outputs, and present performance metrics through dashboards and charts. This makes it easier to compare strategic options, identify funding gaps, assess whether the business can support planned production capacity, and communicate the financial story clearly to stakeholders. Built for practical use in Microsoft Excel and Google Sheets, the template gives users a flexible planning tool that can be customized for different medical device categories, production schedules, pricing strategies, cost structures, and staffing plans. Whether you are launching a medical device startup, expanding an existing manufacturing operation, advising a client, or preparing financial documents for investors or banks, this financial model template provides a professional framework for more confident planning and better business decisions.

| Financial Model, Health Care, Manufacturing |
| 5-year Financial Projections, Excel, Financial Model, Financial Projections, Startup Financial Models, Three Statement Model | Three Financial Statements |


Financial Model Overview
The Medical Equipment Manufacturing Financial Model is a ready-to-use financial model template designed to help founders, business owners, consultants, analysts, and planning teams evaluate the economics of a medical equipment production business. Medical device manufacturing can involve large capital expenditures, specialized equipment, cleanroom requirements, component sourcing, regulatory quality processes, technical staffing, and a long path from product development to scalable sales. This template brings those moving parts into one structured model so users can forecast revenue, estimate startup and operating costs, analyze cash flow, measure profitability, and prepare investor-ready financial outputs. It is useful for new ventures planning a launch, established companies evaluating expansion, consultants preparing client deliverables, and founders building business plans or funding documents. With editable assumptions, pre-built calculations, and professional formatting, the model helps replace spreadsheet guesswork with a clearer planning process for pricing, production volumes, cost of goods sold, payroll, capital needs, and long-term financial performance.
All-in-One Dashboard
The all-in-one dashboard gives users a centralized view of the most important inputs and outputs in the Medical Equipment Manufacturing Financial Model. Instead of searching across multiple tabs to understand performance, users can review core assumptions, financial highlights, revenue projections, expense totals, profitability indicators, cash position, and return metrics in one place. This component is especially valuable for medical equipment manufacturing because decision-makers need to understand how production volumes, product pricing, component costs, capital spending, and staffing plans work together. Inputs may include forecast period, product launch timing, sales volume assumptions, average selling prices, gross margin assumptions, operating expenses, payroll, and capital expenditure plans. Outputs may include revenue, EBITDA, net income, cash balance, funding needs, and key financial ratios. The dashboard is useful for quick planning reviews, investor meetings, lender discussions, and internal decision-making because it turns a detailed financial model into a practical executive summary. Users can update assumptions and immediately see how the overall business outlook changes, making it easier to identify the drivers that matter most and communicate the financial story clearly to stakeholders.
Low, Base, and High Scenario Analysis
The low, base, and high scenario analysis section helps users compare different business outcomes by adjusting the assumptions that drive revenue, costs, profitability, and cash flow. In medical equipment manufacturing, even small changes in market adoption, product launch timing, unit sales, component prices, production efficiency, or regulatory delays can have a major impact on financial results. This component allows users to model conservative, expected, and optimistic cases without rebuilding the forecast from scratch. Inputs may include different sales volumes, pricing levels, gross margin assumptions, operating expense budgets, hiring schedules, capital expenditure timing, and working capital requirements. Outputs can show how each scenario affects revenue growth, EBITDA, cash balance, funding needs, break-even timing, and return metrics. This is useful for planning and risk management because it gives founders and analysts a clearer range of possible outcomes rather than relying on one fixed forecast. Investors and lenders often want to understand downside protection and upside potential, and the scenario analysis gives users a structured way to explain what happens if sales ramp more slowly, production costs rise, or the business scales faster than expected. It supports more realistic planning and better strategic decision-making.
Professional Charts
The professional charts section turns the financial forecast into presentation-ready visuals that help users communicate performance trends clearly. A medical equipment manufacturing forecast can include many detailed assumptions, from product-level revenue to manufacturing costs, payroll, capital investment, cash flow, and profitability. Charts make these outputs easier to understand for investors, lenders, board members, advisors, and internal teams. Inputs flow from the broader model, including revenue forecasts, cost of goods sold, operating expenses, EBITDA, net income, cash balance, gross margin, and growth rates. Outputs may include line charts, bar charts, margin visuals, cash flow graphs, revenue mix displays, and profitability trend views. This component is useful because it helps translate complex spreadsheet calculations into concise visual evidence. For example, users can show how revenue scales as new equipment lines are introduced, how margins improve as production volume increases, or how cash reserves change as the business funds capital expenditures and working capital. The charts can support pitch decks, business plans, funding applications, management reviews, and strategic updates. They also help users spot patterns quickly, such as whether expenses are growing faster than revenue or whether cash flow remains strong enough to support expansion.
ROE Components and DuPont Analysis
The ROE components and DuPont analysis section helps users understand what is driving return on equity and overall financial performance. Rather than looking only at a single return percentage, this component breaks performance into underlying drivers such as profit margin, asset efficiency, and financial leverage. For a medical equipment manufacturing business, this is valuable because profitability depends not only on sales but also on production costs, capital intensity, inventory levels, fixed assets, and the way the company is financed. Inputs may include net income, revenue, total assets, shareholders’ equity, debt balances, asset purchases, depreciation, and other balance sheet items. Outputs help users evaluate how operational performance, asset utilization, and capital structure combine to influence return on equity. This section is useful for investors and stakeholders who want to assess whether returns are being generated through healthy operating margins, efficient use of manufacturing assets, or increased leverage. It can also help management identify improvement areas, such as increasing gross margin through better supplier terms, improving asset turnover through higher production utilization, or reviewing whether debt financing is being used responsibly. By connecting performance to its financial drivers, the DuPont analysis supports deeper decision-making than a simple profit summary.
Revenue Inputs
The revenue inputs section is where users define the commercial assumptions that drive the top line of the Medical Equipment Manufacturing Financial Model. Medical equipment manufacturers often sell multiple product categories at different price points, launch products in phases, and serve customers such as hospitals, clinics, distributors, procurement groups, or healthcare systems. This component allows users to enter product names, launch dates, unit sales volumes, average selling prices, pricing growth, customer adoption assumptions, and ramp-up schedules. It can accommodate revenue streams such as smart infusion pumps, remote patient monitors, diagnostic systems, robotic equipment, service contracts, warranties, accessories, or replacement components, depending on the user’s business plan. Outputs from this section feed directly into monthly and annual revenue forecasts, revenue growth calculations, gross profit projections, cash flow planning, and investor summaries. This component is useful because revenue assumptions are often the most scrutinized part of a medical device manufacturing forecast. By structuring those assumptions clearly, the model helps users explain how sales are expected to grow, when new product lines are introduced, what pricing strategy is being used, and how market penetration is expected to develop over time. It also makes it easier to test changes in sales volume or pricing and see the financial impact immediately.
Bank-Ready Reports
The bank-ready reports section provides lender-friendly financial outputs designed to support financing discussions, credit applications, and stakeholder reviews. Medical equipment manufacturing can require significant upfront capital for production lines, tooling, cleanroom buildout, lab equipment, inventory, regulatory systems, and working capital. Banks and financing partners typically want to review structured financial statements, cash flow projections, debt service capacity, profitability, and the assumptions behind the forecast. This component organizes the model’s outputs into professional reports that may include profit and loss statements, cash flow statements, balance sheet projections, debt schedules, funding summaries, and financial ratios. Inputs come from revenue assumptions, cost forecasts, payroll, capital expenditures, financing terms, depreciation schedules, and working capital assumptions. Outputs help users demonstrate whether the business can generate enough cash to service debt, maintain liquidity, and support planned growth. This section is useful because it reduces the time needed to prepare formal financial documents and helps present the business in a format that lenders and stakeholders can review more easily. For founders seeking equipment financing, working capital lines, term loans, or expansion funding, bank-ready reports provide a clearer and more credible view of the company’s expected financial performance.
Revenue Breakdown
The revenue breakdown section gives users a detailed view of how total revenue is generated across different products, product lines, customer segments, or revenue streams. This is important for medical equipment manufacturing because the business may have a mix of high-volume lower-priced devices, specialized high-value equipment, recurring service income, warranties, consumables, replacement parts, or future product launches. Inputs may include unit sales by product, average selling price, launch timing, sales growth rates, revenue stream categories, and channel assumptions. Outputs can show monthly and annual revenue by category, percentage contribution by product, growth by revenue stream, and total sales composition over time. This component is useful for understanding whether the forecast depends too heavily on one product or whether revenue becomes more diversified as the company expands. It also helps users evaluate the impact of staggered launches, such as starting with core devices and later adding advanced equipment with higher selling prices and stronger margins. Investors and lenders often want to know where revenue comes from and how defensible each stream may be. The revenue breakdown helps answer those questions with a clear, organized view that supports pricing decisions, production planning, market strategy, and funding presentations.
KPI Dashboard
The KPI dashboard tracks the key performance indicators that help users evaluate the health and progress of a medical equipment manufacturing business. While the all-in-one dashboard provides a broad financial summary, the KPI dashboard focuses more directly on performance metrics that can be monitored over time and compared against internal goals or industry benchmarks. Inputs may include revenue, gross profit, EBITDA, operating expenses, cash flow, production volume, cost of goods sold, payroll, capital expenditures, and balance sheet data. Outputs may include gross margin, EBITDA margin, net profit margin, revenue growth, cash runway, break-even timing, return metrics, liquidity ratios, expense ratios, and other financial indicators. This component is useful because medical equipment manufacturing requires disciplined tracking of both growth and efficiency. A company may increase sales but still struggle if component costs rise, production utilization is low, or payroll expands too quickly. The KPI dashboard helps decision-makers identify whether the business is moving toward sustainable profitability and whether performance is aligned with investor expectations. It is also useful for monthly reviews, board reporting, strategic planning, and operational decision-making because it presents the most important metrics in a format that is easier to interpret than raw spreadsheet data.
Break-Even Analysis
The break-even analysis section helps users determine when the medical equipment manufacturing business may become profitable and what level of sales is required to cover fixed and variable costs. This is a critical planning tool for a capital-intensive business where upfront spending on equipment, facilities, regulatory preparation, technical staff, and inventory can create significant financial pressure before revenue scales. Inputs may include average selling prices, unit sales volumes, cost of goods sold, gross margins, fixed operating expenses, payroll, marketing costs, production overhead, and financing costs. Outputs may include break-even revenue, break-even units, monthly break-even timing, cumulative profit or loss, and the relationship between sales volume and profitability. This component is useful because it helps users understand whether the business model can support its cost structure and how sensitive profitability is to changes in volume or margin. For example, if component costs increase or sales ramp more slowly than expected, the break-even point may move later and require additional funding. If production efficiency improves or pricing is stronger, profitability may be reached sooner. The break-even analysis supports investor discussions, funding planning, pricing strategy, and management decisions by showing the practical sales threshold needed to move from launch investment to sustainable operations.
Funding Requirements and Startup Capital Planning
The funding requirements and startup capital planning section helps users estimate how much money may be needed to launch, operate, and scale a medical equipment manufacturing business before it becomes self-sustaining. Medical device production often requires investment in manufacturing lines, cleanroom buildout, research and development equipment, regulatory and quality systems, initial inventory, tooling, supplier deposits, staff hiring, product testing, insurance, and working capital. Inputs may include capital expenditures, pre-opening costs, operating losses before profitability, inventory requirements, accounts receivable timing, debt terms, equity contributions, and minimum cash reserve targets. Outputs may include total funding required, use of funds, startup cost breakdown, cash runway, financing gap, debt requirements, and equity funding needs.
File types:
Excel – Single-User: .xlsx
Excel – Multi-User: .xlsx
Similar ProductsOther customers were also interested in...


 HenrySheykin
Medical Equipment Manufacturing Business Plan Fina...
The Medical Equipment Manufacturing Financial Model helps entrepreneurs, founders, consultants, anal... Read more

 Jason Varner
Industry Based Financial Models (Variety Bundle)
There are currently 52 unique financial models included in this bundle. Nearly all of that include a... Read more

 eFinancialModels
Manufacturing Financial Model Templates Bundle
This is a collection of financial model templates in Excel for businesses in the Manufacturing indus... Read more
Medical Practice Financial Model Excel Template
The Medical Practice Financial Model helps users turn a clinic concept, expansion plan, or healthcar... Read more
Outpatient Clinic Financial Model Excel Template
The Outpatient Clinic Financial Model helps users turn a clinic business concept into a structured, ... Read more
Clinical Lab Financial Model Excel Template
The Clinical Laboratory Financial Model helps users turn a diagnostic lab concept into a structured ... Read more
Dental Practice Financial Model Excel Template
The Dental Clinic Financial Model helps users turn a dental practice concept, launch plan, or expans... Read more

Food Production Financial Model Excel Template
The Food Manufacturing Financial Model helps entrepreneurs, founders, consultants, analysts, and bus... Read more
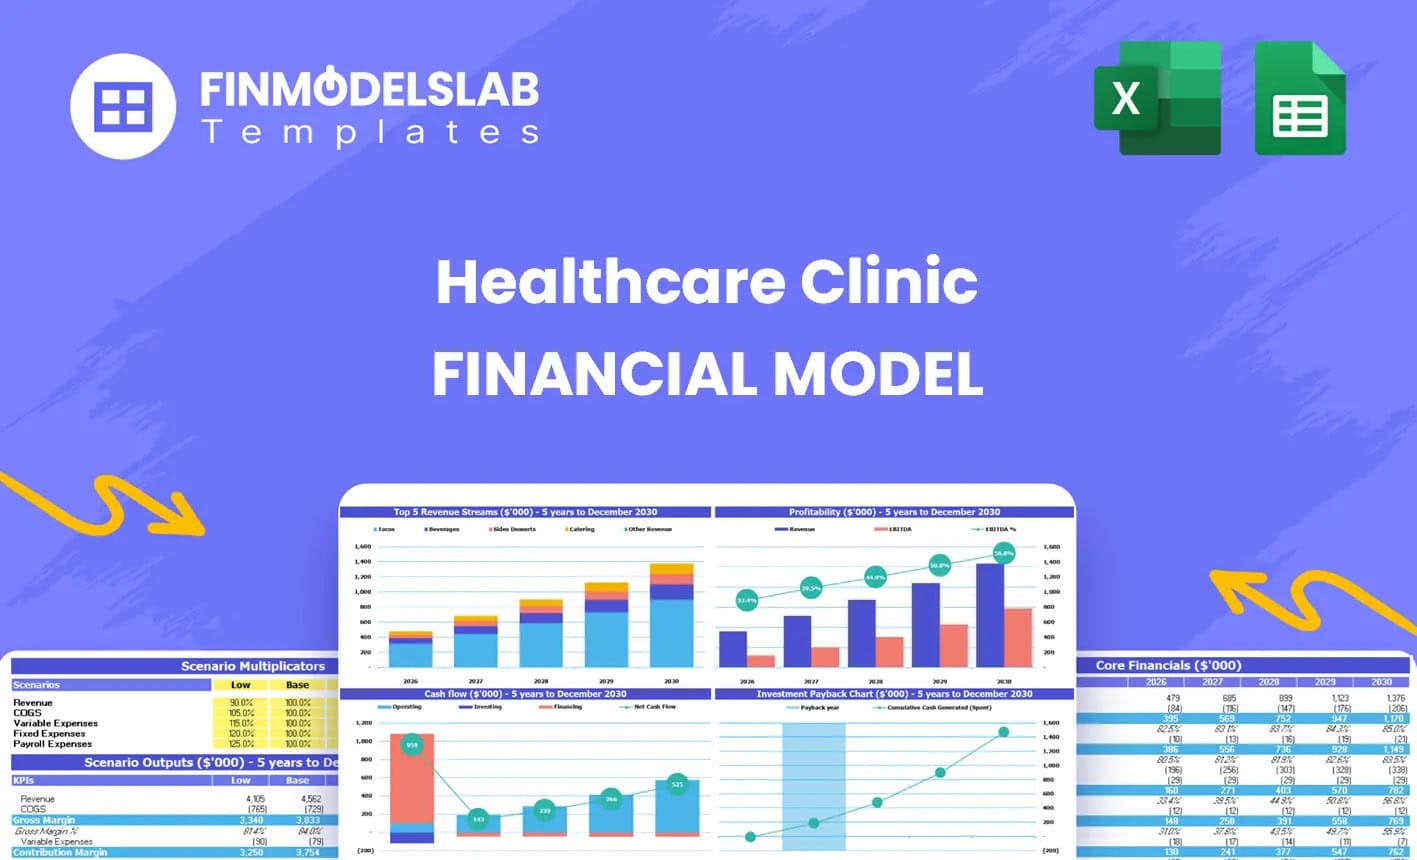
Clinic Financial Model Excel Template
The Healthcare Clinic Financial Model helps founders, clinic owners, consultants, analysts, and busi... Read more
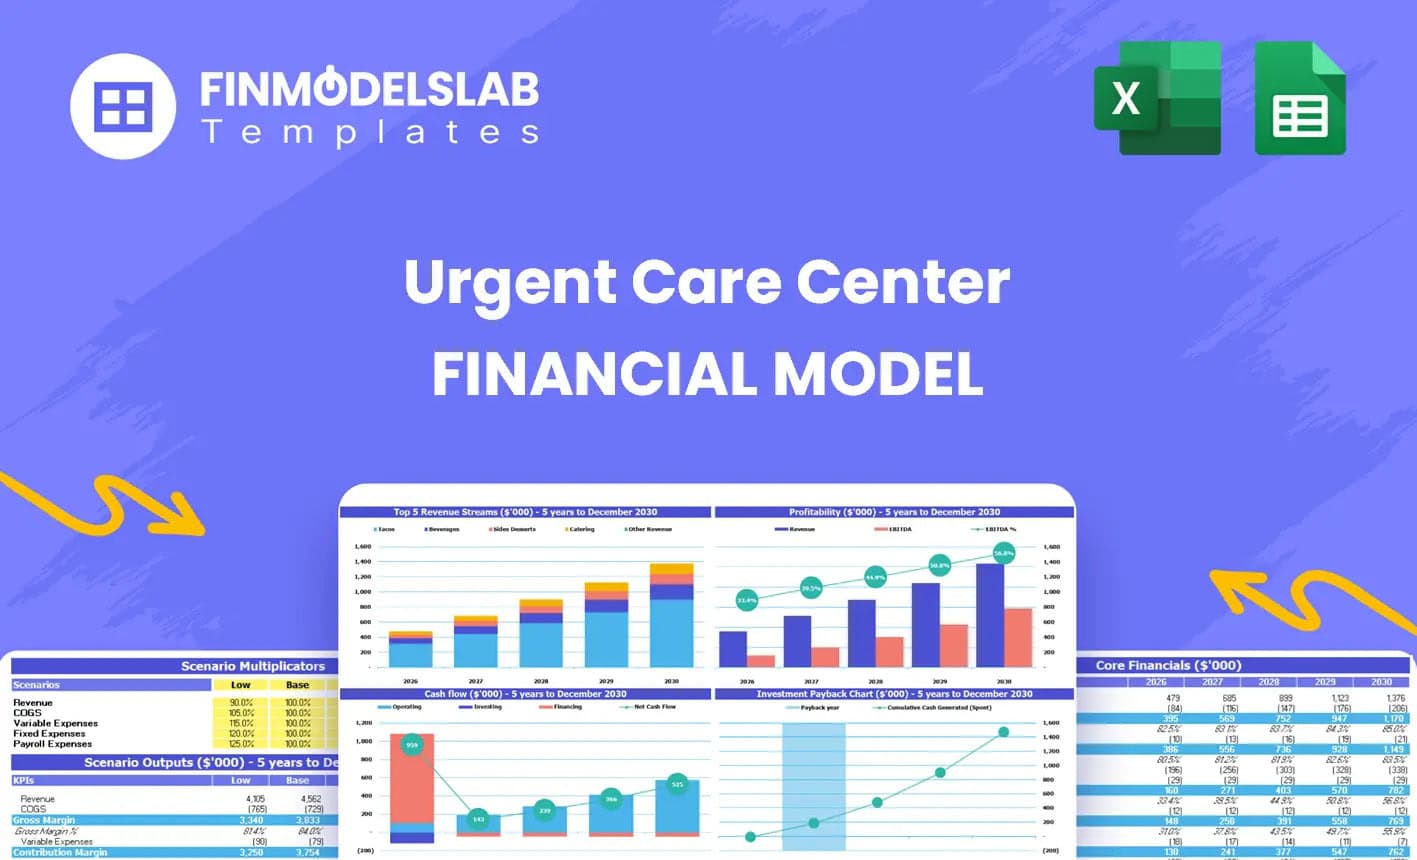
Urgent Care Center Financial Model Excel Template
The Urgent Care Center Financial Model helps users turn a walk-in clinic concept into a structured f... Read more
You must log in to submit a review.