
0 ITEMS

Jam Manufacturing Business Plan Financial Model Excel Template
The Jam Manufacturing Financial Model Financial Model Template helps entrepreneurs, food business owners, consultants, analysts, and founders turn a jam production idea into a structured five-year financial forecast. Instead of starting with a blank spreadsheet, users can work from a ready-to-use model designed around the economics of a fruit jam and preserves business, including product pricing, unit sales, cost of goods sold, startup costs, operating expenses, payroll, cash flow, and profitability. It is built to support practical financial planning for small batch producers, artisan jam brands, commercial kitchens, wholesale suppliers, and growing food manufacturing businesses. This template gives users a clear way to test whether a jam manufacturing business can generate enough revenue to cover production costs, fixed overhead, staffing, marketing, equipment, and working capital needs. Revenue assumptions can be adjusted by product line, pricing, and sales volume, while cost assumptions can be tailored to raw ingredients, jars, labels, packaging, kitchen rent, labor, delivery, and other operating expenses. The model helps users understand how changes in fruit costs, production capacity, pricing strategy, and customer demand may affect gross margin, EBITDA, cash flow, and long-term profitability. Built for business planning, funding preparation, lender discussions, and internal decision-making, the Jam Manufacturing Financial Model provides organized financial statements and visual outputs that make the forecast easier to review and share. Users can evaluate startup investment needs, forecast monthly and annual cash flow, review profit and loss performance, assess return potential, and analyze when the business may reach break-even. The editable structure makes it suitable for both new founders preparing a business plan and existing jam producers planning expansion into new flavors, retail channels, wholesale accounts, farmers markets, online sales, or private label production. The model is designed to save time while improving the quality of financial decisions. It helps users compare low, base, and high scenarios, review revenue streams in detail, monitor key performance indicators, and prepare professional reports for investors, banks, partners, or internal management. With customizable assumptions and pre-built formulas, the template gives users a practical financial planning tool for estimating profitability, managing cash, validating strategy, and presenting a credible financial case for a jam manufacturing business.
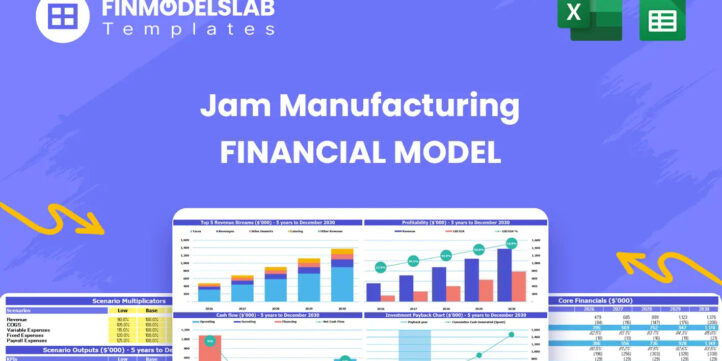


Financial Model Overview
The Jam Manufacturing Financial Model Financial Model Template gives entrepreneurs, food manufacturers, consultants, analysts, and business planners a structured way to evaluate the financial potential of a jam production business. It is designed for users who need to forecast revenue, ingredient costs, packaging costs, startup investment, operating expenses, payroll, cash flow, profitability, and funding needs without building a spreadsheet from scratch. The model is especially useful for artisan jam producers, small batch food brands, commercial kitchen operators, wholesale preserve manufacturers, farmers market vendors, online jam sellers, and founders preparing a fruit preserves business plan. By organizing the major assumptions behind a jam manufacturing operation, the template helps users connect production volume, product pricing, cost of goods sold, staffing, capital investment, and sales growth into a clear five-year financial forecast. It can support funding applications, investor presentations, loan discussions, internal budgeting, expansion planning, and day-to-day decision-making. Because the inputs are editable, users can adapt the model to their own flavor portfolio, supplier quotes, equipment needs, rent assumptions, sales channels, and operating strategy.
All-in-One Dashboard
The all-in-one dashboard brings the most important inputs and outputs of the Jam Manufacturing Financial Model into one central planning view. This component helps users quickly understand how the business is expected to perform by connecting core assumptions such as product pricing, unit sales, production volume, cost structure, payroll, capital spending, and operating expenses with forecast outputs such as revenue, gross profit, EBITDA, net income, cash balance, and return metrics. For a jam manufacturing business, this is useful because many financial decisions depend on several connected drivers, including fruit sourcing costs, jar and label costs, recipe yields, wholesale pricing, direct-to-consumer sales, and production capacity. The dashboard gives users a fast way to review the overall model before going deeper into detailed sheets, making it easier to spot whether the plan is realistic, whether margins are strong enough, and whether cash flow can support growth. It is also valuable for presentations because it summarizes the financial story in a format that owners, investors, lenders, and advisors can understand quickly.
Low, Base, and High Scenario Analysis
The low, base, and high scenario analysis component allows users to compare different versions of the jam manufacturing forecast side by side. Instead of relying on one fixed projection, the model helps users test how performance changes under conservative, expected, and optimistic assumptions. For example, a low scenario may reflect slower wholesale account growth, higher fruit costs, weaker farmers market demand, or lower average selling prices. A base scenario may reflect the most realistic operating plan, while a high scenario may include stronger retail distribution, higher premium product pricing, improved production efficiency, or larger online sales volume. The inputs may include changes to revenue growth, cost of goods sold, payroll levels, marketing spend, production capacity, and overhead. The outputs help show the impact on revenue, profit margins, cash flow, funding needs, and return metrics. This component is important for decision-making because it helps founders and managers understand risk before committing capital, hiring staff, purchasing equipment, or approaching investors and lenders.
Professional Charts
The professional charts component turns the financial forecast into visual reports that are easier to review, explain, and present. Rather than forcing users to interpret only rows of spreadsheet data, the Jam Manufacturing Financial Model includes presentation-ready charts that can show trends in revenue growth, gross margin, EBITDA, cash flow, expenses, product mix, profitability, and other important financial measures. For a jam manufacturing business, charts can be especially useful when comparing the contribution of different product lines, showing seasonal sales movement, explaining how startup investment turns into future cash generation, or demonstrating how profitability improves as production volume increases. These visual outputs support pitch decks, business plan appendices, bank meetings, board discussions, and internal planning sessions. Users can update assumptions and see the charts reflect the revised forecast, making them useful not only for final presentations but also for ongoing financial analysis. Clear visuals help stakeholders understand the model faster and make the financial plan feel more credible, organized, and investor-ready.
ROE Components and DuPont Analysis
The ROE components section uses DuPont analysis to help users understand the drivers behind return on equity rather than looking at profitability in isolation. This component breaks return performance into underlying factors such as profit margin, asset efficiency, and leverage, helping users see how operational decisions influence overall investor returns. In a jam manufacturing business, return on equity can be affected by pricing strategy, ingredient cost control, production efficiency, equipment utilization, inventory management, debt financing, and the amount of capital required to launch or expand. By analyzing ROE components, users can identify whether returns are being driven by strong operating margins, efficient use of assets, or financial structure. This is useful for founders seeking investment because it gives a clearer explanation of how the business creates value over time. It also helps managers evaluate whether purchasing new equipment, increasing debt, expanding production, or improving margins is likely to strengthen or weaken the financial performance of the company.
Revenue Inputs
The revenue inputs component provides a structured area for entering the assumptions that drive sales for the jam manufacturing business. Users can model revenue by product line, unit volume, selling price, growth rate, and sales channel, allowing the forecast to reflect a realistic mix of products such as strawberry jam, raspberry preserve, blueberry spread, peach ginger jam, fig cardamom jam, or other custom flavors. This section may include assumptions for wholesale pricing, direct-to-consumer sales, retail placement, online orders, farmers market activity, seasonal promotions, and premium product positioning. By separating the key revenue drivers, the model helps users see how pricing and volume decisions affect the top line and gross margin. It is useful for planning because jam businesses often need to balance affordable core flavors with higher-margin specialty products. The revenue inputs also make it easier to test different strategies, such as increasing premium pricing, adding new flavors, pursuing large retail accounts, or focusing on local direct sales before scaling into broader distribution.
Bank-Ready Reports
The bank-ready reports component organizes the model’s financial outputs into a format suitable for lenders, funding applications, and professional review. This section can include forecast financial statements, profit and loss summaries, cash flow projections, balance sheet outputs, debt service considerations, and key performance measures that help banks evaluate whether the jam manufacturing business can repay financing. For users seeking a loan to purchase commercial cookers, filling equipment, capping and labeling machines, delivery vehicles, inventory, or working capital, lender-friendly reporting is essential. The model helps translate operating assumptions into clear financial evidence, showing expected revenue, margins, expenses, cash generation, and capital requirements. This component is useful because lenders typically want to understand not only the business idea, but also the borrower’s ability to manage costs, maintain liquidity, and generate consistent cash flow. Well-organized reports can make funding discussions more efficient and help users present a more credible, prepared, and financially disciplined business plan.
Revenue Breakdown
The revenue breakdown component gives users a detailed view of how each product line, flavor, or sales stream contributes to total sales. In a jam manufacturing business, revenue may come from multiple sources, including direct retail jars, wholesale cases, specialty preserves, premium flavors, seasonal gift packs, online orders, farmers market sales, private label production, and local store accounts. This component helps users separate these streams so they can understand which parts of the business generate the most revenue and which may deliver the strongest margins. Inputs may include unit volumes, price per jar, sales growth, product mix percentages, and channel-specific assumptions. Outputs can show total revenue by category, share of revenue by product, and the impact of changing pricing or sales volume across different items. This is important for decision-making because not every jam product contributes equally to profit. A detailed revenue breakdown helps users focus marketing, production, and inventory planning on the products and channels that support sustainable growth.
KPI Dashboard and Performance Benchmarks
The KPI dashboard and performance benchmark component helps users monitor the most important performance indicators for the jam manufacturing business. It can track financial and operational metrics such as revenue growth, gross margin, EBITDA margin, net profit margin, cash balance, cost of goods sold, operating expense ratio, payback period, return metrics, production efficiency, and revenue per product line. Benchmarks are useful because they allow users to compare forecast performance against reasonable expectations for food processing, specialty food production, or small manufacturing operations. For a jam producer, KPIs help identify whether ingredient costs are too high, whether packaging expenses are eroding margins, whether payroll is aligned with production volume, or whether pricing needs to be adjusted. This component supports both strategic planning and ongoing management because it turns the forecast into a measurable performance framework. Investors, lenders, and internal teams can use the KPI dashboard to quickly understand the health of the business and assess whether the plan is on track.
Startup Costs and Capital Requirements
The startup costs and capital requirements component helps users estimate how much money is needed to launch or expand the jam manufacturing operation before it becomes self-sustaining. This section can include commercial kitchen setup, production equipment, cookers, filling equipment, capping and labeling machines, refrigeration, storage, initial raw materials, jars, lids, labels, packaging, licensing, permits, branding, website setup, insurance deposits, rent deposits, initial marketing, delivery vehicle costs, and working capital reserves. For a jam manufacturing business, startup cost planning is critical because equipment and inventory purchases can create cash pressure before sales begin. The model helps users separate one-time investments from ongoing operating expenses, giving a clearer picture of funding needs and launch readiness. Outputs may include total startup investment, financing requirement, use of funds, and the amount of cash needed to cover early operating months. This component is useful for business plans, loan requests, investor discussions, and practical budgeting because it helps users avoid underestimating the true cost of getting the business operational.
Break-Even and Cash Flow Planning
The break-even and cash flow planning component helps users understand when the jam manufacturing business may begin covering its costs and generating positive financial results. Break-even analysis can estimate the level of sales volume or revenue needed to cover fixed costs, variable costs, production expenses, payroll, rent, marketing, and other overhead. Cash flow planning goes further by showing how money moves through the business over time, including customer receipts, supplier payments, payroll, equipment spending, loan payments, tax obligations, and working capital needs. This is especially important for jam producers because inventory purchases, seasonal fruit sourcing, wholesale payment terms, and production cycles can create timing differences between expenses and cash receipts. The model helps users identify potential cash gaps, plan financing needs, and make better decisions about pricing, production volume, supplier terms, and sales channel mix. By combining break-even analysis with cash flow forecasting, users can evaluate not only whether the business can become profitable, but also whether it can remain liquid while growing.
File types:
Excel – Single-User: .xlsx
Excel – Multi-User: .xlsx
Similar ProductsOther customers were also interested in...

 HenrySheykin
Food Production Financial Model Excel Template
The Food Manufacturing Financial Model helps entrepreneurs, founders, consultants, analysts, and bus... Read more
Solar Panel Manufacturing Plant Business Plan Fina...
The Solar Panel Manufacturing Financial Model helps users turn a solar factory concept into a struct... Read more

Furniture Manufacturing Business Plan Financial Mo...
The Furniture Manufacturing Financial Model helps turn a furniture production concept into a structu... Read more

Medical Equipment Manufacturing Business Plan Fina...
The Medical Equipment Manufacturing Financial Model helps entrepreneurs, founders, consultants, anal... Read more
Candle Making Business Plan Financial Model Excel ...
The Candle Making Business Financial Model helps entrepreneurs, founders, business owners, consultan... Read more
Soy Production Financial Model Excel Template
The Soy Production Financial Model helps users turn a soybean farming and processing plan into a str... Read more
Coffee Roasting Business Plan Financial Model Exce...
The Coffee Roasting Financial Model helps entrepreneurs, founders, business owners, consultants, and... Read more

Cashew Nut Processing Business Plan Financial Mode...
The Cashew Nut Processing Financial Model helps entrepreneurs, operators, consultants, analysts, and... Read more

Medical Equipment Manufacturing Business Plan Fina...
The Medical Equipment Manufacturing Financial Model helps entrepreneurs, founders, consultants, anal... Read more
Coal Mining Financial Model Excel Template
The Coal Mining Financial Model helps users turn a mining project concept, expansion plan, or invest... Read more
You must log in to submit a review.