
0 ITEMS

Cashew Nut Processing Business Plan Financial Model Excel Template
The Cashew Nut Processing Financial Model helps entrepreneurs, operators, consultants, analysts, and founders turn a cashew processing business idea into a structured financial forecast. Instead of starting with a blank spreadsheet, users can work from a ready-to-use model designed around the economics of a cashew nut processing facility, including production volumes, product grades, pricing, cost of goods sold, staffing, operating expenses, capital investment, and profitability. It supports practical planning for businesses selling whole cashews, premium grades, splits, roasted products, and by-products such as cashew shell oil. This template is built for financial planning, business plan preparation, funding discussions, and internal decision-making. It gives users a clear way to estimate revenue assumptions, startup costs, operating expenses, payroll, cash flow, profitability, and break-even timing before committing capital or approaching lenders and investors. The model is especially useful for people evaluating a new processing plant, expanding an existing food processing operation, preparing a bank loan application, or building an investor-ready financial plan for an agricultural export or nut processing business. The Cashew Nut Processing Financial Model is fully editable, so users can customize assumptions to match their own facility size, equipment requirements, procurement costs, production capacity, sales channels, product mix, and growth expectations. Pre-built formulas connect the assumptions to financial outputs, helping users understand how changes in raw cashew nut costs, processing efficiency, selling prices, payroll, and working capital affect margins and cash availability. This makes it easier to test ideas, compare scenarios, identify funding needs, and avoid relying on guesswork. Designed for Excel and Google Sheets, the template provides a professional framework for reviewing the business from multiple financial angles. Users can analyze projected income, expenses, profit, returns, cash flow movement, and key performance indicators over a multi-year forecast period. Whether used for a startup plan, lender presentation, investor discussion, feasibility study, or operational budget, this financial model template helps make the financial case for a cashew nut processing business clearer, more credible, and easier to communicate.


Financial Model Overview
The Cashew Nut Processing Financial Model is a ready-to-use financial model template designed to help entrepreneurs, food processing operators, exporters, consultants, analysts, and business owners evaluate the financial potential of a cashew nut processing facility. It brings together the core assumptions needed to plan a cashew processing business, including production volumes, product pricing, raw material costs, labor, operating expenses, startup investment, working capital, profitability, and cash flow. Because cashew processing involves multiple product grades, equipment requirements, yield assumptions, and market-driven pricing, a structured model is essential for understanding whether the business can generate attractive margins and sustain liquidity as it scales.
The template is fully editable and compatible with Microsoft Excel and Google Sheets, making it useful for preparing business plans, bank loan applications, investor presentations, internal budgets, feasibility studies, and operational forecasts.
All-in-one Dashboard
The all-in-one dashboard gives users a central view of the most important inputs and outputs in the Cashew Nut Processing Financial Model. Instead of moving through separate sheets to understand the business, users can review the core financial picture from one organized area. This component typically connects key assumptions such as production volume, product pricing, cost of goods sold, operating expenses, payroll, capital expenditure, and financing inputs to outputs such as revenue, EBITDA, net profit, cash position, margins, and investment returns.
For a cashew nut processing business, this is especially useful because management decisions are closely tied to production capacity, raw cashew nut procurement costs, product grade mix, and export pricing. The dashboard helps owners and stakeholders quickly understand whether the forecast is moving in the right direction and whether the business plan supports profitability, funding needs, and growth objectives. It is also valuable for presenting a clear financial summary to lenders, investors, partners, and internal teams.
Low Base High Scenario Analysis
The low, base, and high scenario analysis component helps users test how the cashew processing business may perform under different market and operating conditions. A single forecast can be misleading if it assumes that sales volume, procurement costs, pricing, and production efficiency will all unfold exactly as planned. This section allows users to model a downside case, a realistic base case, and an upside case using different assumptions for variables such as raw cashew nut prices, output volume, selling prices, product mix, customer demand, operating costs, and expansion timing.
The outputs show how changes in assumptions affect revenue, gross margin, EBITDA, cash flow, profit, and funding requirements. This is particularly important in cashew processing because commodity prices, seasonal supply, export demand, labor availability, and processing yields can shift significantly. By comparing scenarios, users can identify risk exposure, prepare contingency plans, evaluate whether the business can withstand weaker market conditions, and present investors or lenders with a more defensible forecast range rather than a single optimistic projection.
Professional Charts
The professional charts component turns the financial model’s calculations into clear visual reports that are easier to review, explain, and present. Financial forecasts can contain many rows of detailed assumptions and outputs, but charts help users quickly see trends in revenue growth, profitability, expense behavior, margins, cash flow movement, and investment performance. For a cashew nut processing facility, these visuals can show how revenue develops across years, how EBITDA improves as production scales, how operating expenses compare to sales, or how cash balances change during launch and growth phases.
The charts are useful for pitch decks, business plans, management meetings, lender discussions, and investor updates because they make complex financial information more accessible. Users can adjust the underlying assumptions in the model, and the charts update to reflect the revised forecast. This saves time and helps business owners communicate financial results in a polished, stakeholder-friendly way. It also supports decision-making by making financial patterns easier to identify than they would be in raw spreadsheet tables alone.
ROE Components and DuPont Analysis
The ROE components section uses DuPont-style analysis to help users understand what is driving return on equity in the cashew nut processing business. Return on equity is an important investor metric because it shows how effectively the business uses shareholder capital to generate profit. Rather than showing only one final ROE figure, this component breaks the result into underlying drivers such as profit margin, asset efficiency, and financial leverage. For a cashew processing company, this can reveal whether returns are being driven by strong selling margins, efficient use of processing equipment and working capital, or the structure of debt and equity financing.
Inputs may include net income, revenue, total assets, equity, debt levels, and profitability assumptions. Outputs help users assess whether the business is creating attractive returns and where improvements can be made. For example, if ROE is weak because asset turnover is low, the owner may need to improve capacity utilization. If margins are weak, the focus may shift to procurement costs, product mix, or value-added roasted cashews. This component is useful for investor conversations and strategic financial planning.
Revenue Inputs
The revenue inputs component is where users define the commercial assumptions that drive the sales forecast for the cashew nut processing business. It allows the model to reflect the specific revenue logic of the operation, including product categories such as premium whole cashew W240, standard whole cashew W320, cashew splits, roasted cashews, and cashew shell oil as a by-product. Users can adjust annual production volumes, selling prices, growth rates, customer demand assumptions, capacity utilization, and product mix to match their business plan. These inputs feed directly into the revenue forecast and influence downstream outputs such as gross profit, operating margin, EBITDA, cash flow, and break-even timing.
This section is critical because revenue in cashew processing depends not only on total processing volume but also on the grade mix and the price achieved for each product line. A shift toward higher-margin premium or value-added products can meaningfully improve profitability. By organizing the revenue assumptions in one clear area, the model helps users test market strategies, evaluate pricing decisions, and build a more credible forecast for funding or planning purposes.
Bank-Ready Reports
The bank-ready reports component organizes the financial outputs in a format suitable for lenders, investors, advisors, and other stakeholders who need to assess the viability of the cashew nut processing project. Banks and funding partners typically want to review clear financial statements, cash flow forecasts, debt service capacity, profitability, capital expenditure, startup costs, and key performance indicators before making a decision.
This section helps users present the model’s outputs in a structured and professional way, reducing the time required to prepare funding documents from scratch. The reports may include projected income statements, cash flow summaries, balance sheet outputs, investment return metrics, and financing assumptions.
For a cashew processing facility, this is particularly valuable because lenders often want to understand how equipment purchases, raw material procurement, inventory cycles, working capital needs, and operating margins affect repayment capacity. The bank-ready structure helps users communicate their numbers clearly and supports a more credible financing discussion. It also gives business owners a disciplined way to review whether the forecast can support loans, equity funding, or phased expansion.
Revenue Breakdown
The revenue breakdown component provides a detailed view of how total sales are generated across the different revenue streams in the cashew nut processing business. Instead of showing only one total revenue figure, this section separates the contribution from each product line, such as premium whole kernels, standard whole kernels, splits, roasted cashews, and cashew shell oil. Users can see how volume and pricing assumptions combine to create total revenue and how changes in product mix affect overall performance.
This is important because cashew processing businesses often rely on several grades and value-added products with different selling prices, margins, and market demand. A detailed revenue breakdown helps users identify which products are most important to growth and which may need pricing, marketing, or operational adjustments. It also helps validate the business plan by showing whether projected sales are realistic based on capacity and market positioning. For decision-making, this component can support choices about which product categories to prioritize, whether to invest in roasting or packaging capabilities, and how to balance bulk export sales against higher-margin processed products.
KPI Dashboard
The KPI dashboard focuses on performance metrics and benchmarks that help users evaluate the health of the cashew nut processing business beyond basic revenue and profit figures. Key performance indicators may include gross margin, EBITDA margin, net profit margin, cash balance, revenue growth, cost of goods sold as a percentage of sales, operating expense ratio, payback period, return on equity, and other operational or financial measures.
For a processing facility, KPIs are useful because they show whether the business is improving efficiency, maintaining healthy margins, and converting sales into cash. This section may also support comparison against food processing or agricultural industry benchmarks, helping users test whether their assumptions are reasonable and competitive.
The KPI dashboard is especially valuable for ongoing monitoring after launch because it gives management a concise way to track performance against plan. It can also be used in investor or lender updates to show progress in a consistent format. By presenting the most important metrics in one place, this component helps users make faster decisions and focus attention on the variables that matter most.
Startup Costs and Capital Expenditure Planning
The startup costs and capital expenditure planning component helps users estimate the upfront investment required to launch or expand a cashew nut processing facility. Cashew processing can require significant initial spending on shelling equipment, peeling and sorting machinery, drying systems, roasting equipment, packaging lines, facility setup, storage, utilities, licenses, deposits, initial marketing, and working capital. This section organizes those costs so users can see the total funding requirement before operations begin. Inputs may include equipment cost, installation cost, building improvements, pre-opening expenses, inventory purchases, professional fees, contingency allowances, and initial cash reserve requirements.
Outputs can show total startup capital needed, timing of investment, depreciation inputs, and the relationship between initial funding and future cash flow. This component is useful for business planning because underestimating startup costs can create liquidity problems before the business reaches stable operations. It also supports lender and investor discussions by clearly explaining how requested funds will be used. For founders and operators, it provides a practical checklist for budgeting the launch and comparing different facility sizes or equipment configurations.
Cash Flow and Break-Even Planning
The cash flow and break-even planning component helps users understand when the cashew nut processing business can cover its costs and maintain sufficient liquidity. Profitability on paper does not always mean the company has enough cash, especially when the business must purchase raw cashew nuts, hold inventory, pay labor, manage receivables, and fund equipment or facility costs. This section connects revenue, cost of goods sold, payroll, operating expenses, capital expenditure, financing, taxes, and working capital assumptions to monthly and annual cash flow outputs. It also helps identify the break-even point by showing when revenue is sufficient to cover fixed and variable costs.
For decision-making, this is one of the most important parts of the model because it highlights potential cash shortfalls, minimum funding requirements, and the timing of profitability. Users can test whether changes in payment terms, supplier costs, sales growth, or staffing plans improve or weaken the cash position. This component is useful for bank loan applications, investor presentations, internal budgeting, and operational planning because it shows whether the business can remain solvent while scaling production and sales.
File types:
Excel – Single-User: .xlsx
Excel – Multi-User: .xlsx
Similar ProductsOther customers were also interested in...


 HenrySheykin
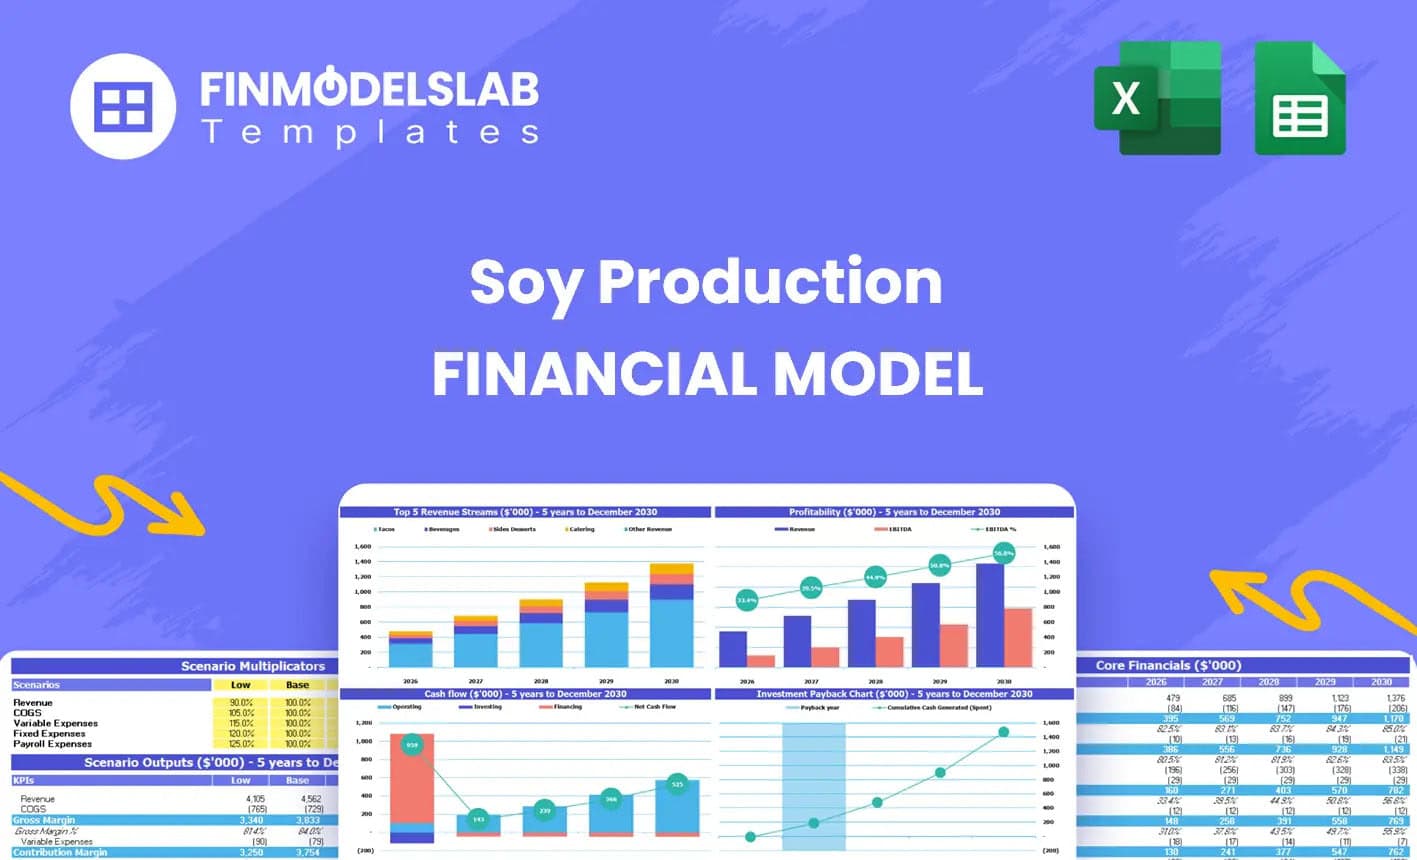
Soy Production Financial Model Excel Template
The Soy Production Financial Model helps users turn a soybean farming and processing plan into a str... Read more
 Pushkar
Ethanol and Sugar Production Plant Financial Model
Fin-wiser’s Ethanol and Sugar Plant PPP project model helps users to assess the financial viabilit... Read more
 Giorgos
Fruit Processing Facility – 10 Year Financia...
Financial Model providing a dynamic up to 10-year financial forecast for a startup Fruit Processing ... Read more
 Luigi R.
Financial Model for AGROINDUSTRY
The financial model I have built contains all the advanced corporate finance concepts referring to a... Read more
Solar Panel Manufacturing Plant Business Plan Fina...
The Solar Panel Manufacturing Financial Model helps users turn a solar factory concept into a struct... Read more
Food Production Financial Model Excel Template
The Food Manufacturing Financial Model helps entrepreneurs, founders, consultants, analysts, and bus... Read more
Cattle Farming Financial Model Excel Template
The Cattle Farming Financial Model helps users turn a cattle farm concept, expansion plan, or fundin... Read more
Greenhouse Farming Financial Model Excel Template
The Greenhouse Farming Financial Model helps users evaluate the economics of a controlled environmen... Read more
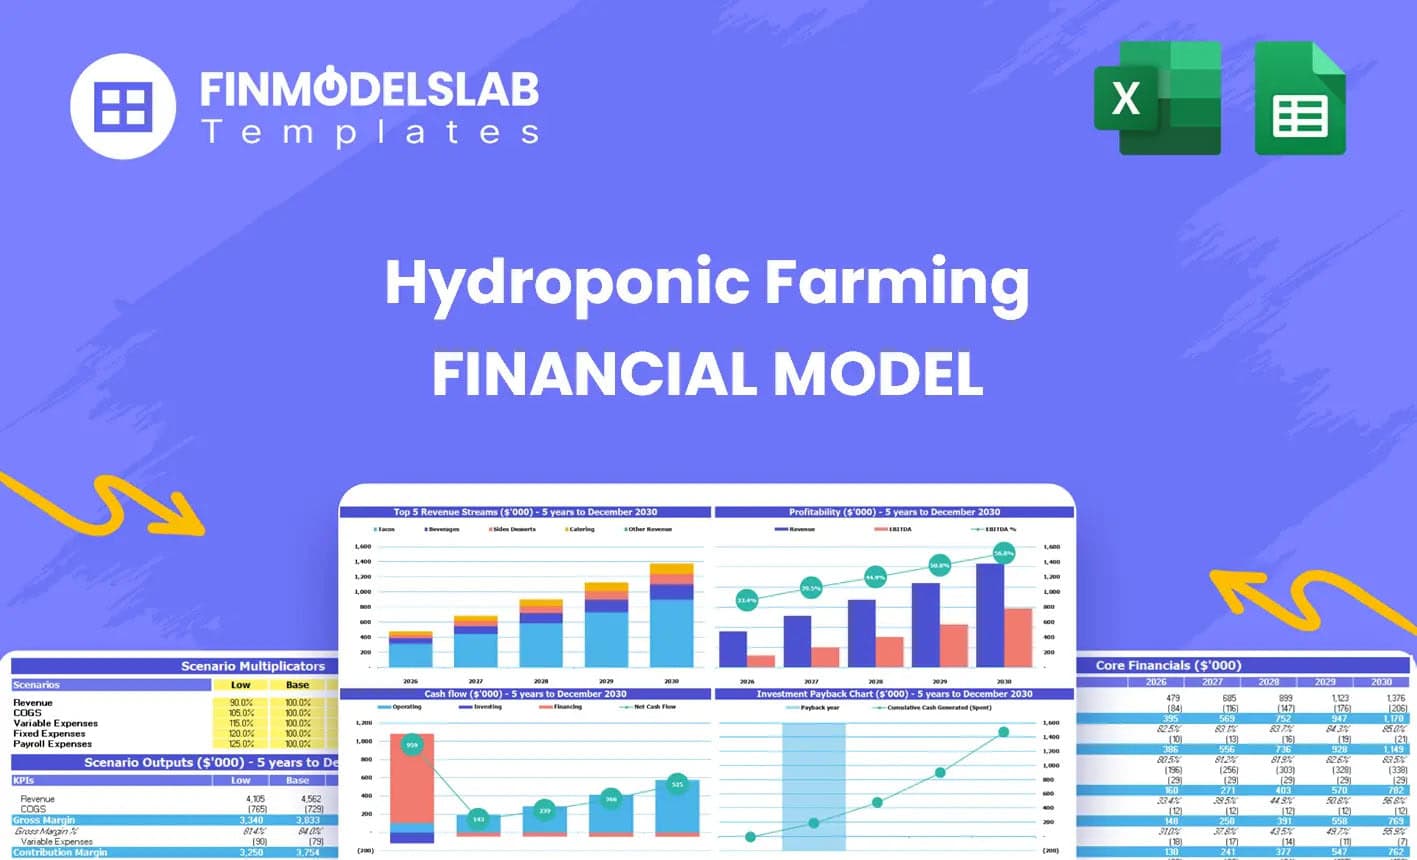
Hydroponics Financial Model Excel Template
The Hydroponic Farming Financial Model helps entrepreneurs, growers, consultants, analysts, and busi... Read more

Coal Mining Financial Model Excel Template
The Coal Mining Financial Model helps users turn a mining project concept, expansion plan, or invest... Read more
You must log in to submit a review.