
0 ITEMS

IT Compliance and Governance Financial Model Excel Template
The IT Compliance and Governance Financial Model helps users turn an IT compliance, governance, risk, and advisory business concept into a structured five-year financial forecast. Instead of relying on scattered estimates, the template brings together revenue assumptions, startup costs, operating expenses, payroll, cash flow, profitability, and break-even analysis in one editable model. It is designed for businesses offering services such as compliance subscriptions, audit assessments, policy development, IT governance consulting, risk management support, and related advisory services. This financial model template is especially useful for entrepreneurs, founders, consultants, business owners, analysts, and advisors preparing a business plan, funding request, investor presentation, loan application, or internal growth plan. Users can input their own assumptions for client acquisition, billable hours, pricing, consultant utilization, marketing spend, staffing, software tools, infrastructure costs, and recurring overhead. The model then helps translate those assumptions into practical financial outputs, making it easier to understand how the business may perform over time. Built for planning and decision-making, the template helps users evaluate whether an IT compliance and governance business can generate enough revenue to support its team, technology, marketing, and operating structure. It supports scenario planning, cash flow forecasting, profitability review, and break-even visibility so users can test how changes in customer acquisition cost, service mix, pricing, or payroll affect financial results. This makes it useful not only before launch, but also when expanding an existing consulting practice or refining an operating budget. Because the model is fully customizable and compatible with Microsoft Excel and Google Sheets, buyers can adapt it to their specific market, currency, service offering, and growth strategy. The ready-made structure saves time compared with building a spreadsheet from scratch while still allowing detailed personalization. For users who need a professional and investor-ready way to present the financial logic behind an IT compliance and governance venture, this template provides a clear framework for forecasting, budgeting, reviewing risk, and making better financial decisions.
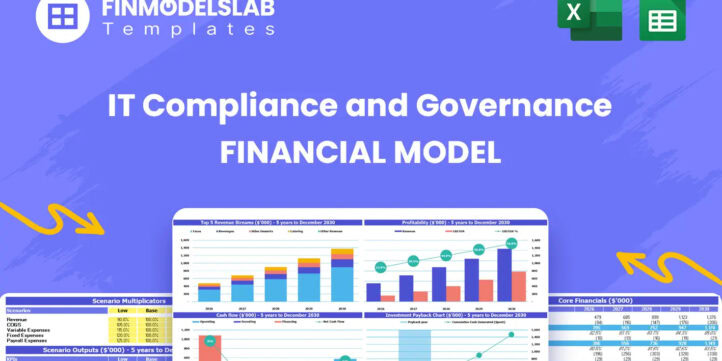


Financial Model Overview
The IT Compliance and Governance Financial Model is a ready-to-use financial planning template built for businesses that provide IT compliance, governance, risk management, data governance, audit readiness, policy development, and related advisory services. It helps users organize the financial logic behind a consulting-style business model where revenue is driven by client acquisition, billable hours, recurring compliance support, audit assessments, policy projects, and specialist consulting engagements. Instead of building a forecast from a blank spreadsheet, users can work from a structured model with editable assumptions, pre-built calculations, and professional outputs designed for planning, budgeting, funding discussions, and stakeholder presentations. The template connects core business drivers such as pricing, customer acquisition cost, consultant utilization, payroll, software tools, startup investment, operating expenses, cash flow, and profitability. This makes it useful for founders launching a new IT compliance practice, business owners expanding a governance service line, consultants preparing client deliverables, and analysts creating financial projections for an investor-ready business plan.
All-in-One Dashboard
The all-in-one dashboard gives users a central view of the most important inputs and outputs in the IT Compliance and Governance Financial Model. It is designed to reduce the need to move across multiple tabs just to understand the direction of the forecast. Users can review high-level revenue, expenses, profitability, cash flow, break-even timing, and key assumptions from one organized area, making the model easier to navigate and easier to explain to partners, lenders, investors, or internal decision-makers. The dashboard may include editable drivers such as forecast period, client growth assumptions, average pricing, service mix, payroll structure, marketing spend, and operating cost assumptions, while showing the resulting financial outputs in a summarized format. For an IT compliance and governance business, this is especially useful because commercial performance depends on several connected variables, including billable hours, recurring subscription clients, audit projects, policy development engagements, and consultant capacity. The dashboard helps users quickly see whether the business plan is financially coherent, whether cash reserves are sufficient, and whether profitability improves as the client base scales.
Low, Base, and High Scenario Analysis
The low, base, and high scenario analysis section helps users test how the business performs under different operating conditions. Instead of relying on a single forecast, users can compare a conservative case, a most likely case, and an upside case based on changes to core assumptions such as client acquisition cost, marketing budget, pricing, client conversion, consultant billable hours, service adoption rates, payroll expansion, and operating expenses. For an IT compliance and governance firm, this is important because growth can vary significantly depending on regulatory demand, sales cycle length, client retention, competition, and consultant utilization. A low scenario may show what happens if customer acquisition is slower or costs are higher than expected, while a high scenario can demonstrate the impact of stronger demand, better pricing, or higher utilization. The outputs help users evaluate revenue, margins, cash flow, EBITDA, and funding needs across multiple possibilities. This component is valuable for risk management, investor conversations, loan applications, and strategic decision-making because it shows how resilient the business model may be when assumptions change.
Professional Charts
The professional charts section turns financial projections into clear visual outputs that are easier to understand and present. Rather than forcing users to interpret rows of numbers, the model can display revenue growth, expense trends, cash flow movement, EBITDA progression, profitability improvement, and other key metrics through charts and graphs. For an IT compliance and governance business, visual reporting is helpful because stakeholders often need to understand the ramp-up pattern of a consulting model, where early investment in people, marketing, tools, and infrastructure may lead to losses before the business reaches scale. Charts can show how recurring compliance subscriptions, audit assessments, policy development work, and other services contribute to total revenue over time. They can also illustrate when operating leverage begins to appear as revenue grows faster than fixed costs. These outputs are useful for board discussions, investor decks, management meetings, funding packages, and internal reviews. They help communicate the financial story of the business in a professional and presentation-ready way without requiring users to manually create charts from scratch.
ROE Components and DuPont Analysis
The ROE components and DuPont analysis section helps users understand the drivers behind return on equity rather than looking at profitability in isolation. This component breaks return performance into underlying factors such as profit margin, asset efficiency, and financial leverage, allowing users to see what is actually influencing shareholder returns. In an IT compliance and governance business, return on equity may be affected by pricing strategy, consultant utilization, payroll efficiency, software and infrastructure investment, receivables collection, and the amount of equity or debt used to fund the company. By reviewing these components together, users can identify whether returns are being improved by stronger margins, better use of assets, or changes in the capital structure. This is useful for founders and investors because it provides a more analytical view of business performance than a simple net income number. It also supports better decision-making around hiring, investment in tools, use of financing, and growth planning. For users preparing investor or lender materials, this section adds credibility by showing how operational decisions translate into financial return metrics.
Revenue Inputs
The revenue inputs section is where users define the core commercial assumptions that drive the IT Compliance and Governance Financial Model. This may include the number of new clients acquired, marketing spend, customer acquisition cost, service adoption rates, billable hours per client, hourly rates, monthly subscription fees, audit assessment pricing, policy development fees, and other revenue drivers relevant to the business. Because IT compliance and governance firms often generate income from a mix of recurring advisory services and project-based work, this section helps users model each revenue source in a structured way. Users can adjust assumptions to reflect their own target market, pricing strategy, sales capacity, and service delivery model. The outputs then flow through to revenue forecasts, profitability calculations, cash flow projections, and scenario analysis. This component is essential for planning because revenue is not entered as a single flat number. It is built from the real drivers of the business, allowing users to test whether their expected marketing budget, client conversion, and consultant capacity can realistically support the desired level of sales.
Bank-Ready Reports
The bank-ready reports section provides organized financial outputs that can support loan applications, funding requests, and formal stakeholder review. These reports typically include projected profit and loss, cash flow, balance sheet, and key financial summaries that lenders and professional reviewers expect to see when assessing a business plan. For an IT compliance and governance business, bank-ready reporting is important because lenders need to understand not only expected profitability, but also whether the company can maintain liquidity, cover payroll, manage software and infrastructure costs, and service any debt obligations. This section helps users present financial projections in a clean and structured format without manually assembling reports from separate calculations. Inputs from revenue, expenses, payroll, startup costs, working capital, and financing assumptions are consolidated into outputs that show the expected financial position of the business over time. This makes the model useful for entrepreneurs seeking startup capital, established firms planning expansion, and consultants preparing professional financial documents for clients. It also helps ensure that the financial story is consistent across all major statements.
Revenue Breakdown
The revenue breakdown section gives users a detailed view of how different services contribute to total income. Instead of treating the IT compliance and governance business as one general revenue line, this component separates streams such as compliance subscriptions, audit assessments, policy development, governance consulting, risk management advisory, and other service categories the user chooses to include. Users can input assumptions for pricing, volume, client adoption, billing frequency, hours per engagement, and growth over time. The model then helps show which revenue streams are the strongest contributors, which services may have higher margins, and how the overall revenue mix changes as the business grows. This is useful for strategic planning because not all services behave the same way. Recurring compliance subscriptions may provide stable monthly revenue, while audit and policy projects may create larger but less predictable revenue spikes. By reviewing revenue at a more detailed level, users can make better decisions about sales focus, staffing needs, pricing, marketing priorities, and client segmentation. This section also helps investors and stakeholders understand the business model more clearly.
KPI Dashboard
The KPI dashboard focuses on the performance metrics that matter most for managing an IT compliance and governance business. It may track indicators such as revenue growth, gross margin, EBITDA margin, cash balance, customer acquisition cost, payback period, client count, average revenue per client, consultant utilization, billable hours, payroll as a percentage of revenue, and other operating benchmarks. The purpose of this section is to convert the forecast into measurable management signals that users can review regularly. For a consulting and advisory business, financial success depends on more than total revenue. The business must acquire clients efficiently, price services correctly, keep consultants productive, manage recurring costs, and maintain sufficient cash. The KPI dashboard helps users compare planned performance against internal targets or industry benchmarks, making it easier to identify gaps and adjust assumptions. It is useful for monthly review, investor updates, board reporting, and internal planning meetings. By presenting performance metrics in one place, the dashboard supports faster decision-making and helps users focus on the levers that have the greatest impact on profitability and cash flow.
Startup Cost Planning
The startup cost planning section helps users estimate the initial investment required to launch or prepare an IT compliance and governance business for operations. This may include office furniture and equipment, initial IT infrastructure, consulting tools, compliance software, cybersecurity platforms, professional licenses, website development, branding, legal setup, insurance deposits, initial marketing, recruitment costs, training, and working capital reserves. For a service-based business, startup costs are often underestimated because the company may not require large physical inventory, but it still needs strong technology, qualified staff, operational systems, and enough cash to support the early ramp-up period. This component helps users separate one-time launch expenses from ongoing operating costs, making funding requirements clearer and more realistic. The outputs can feed into cash flow projections, funding needs, balance sheet forecasts, and investor or lender discussions. By organizing startup investment in detail, the model helps users understand how much capital is needed before revenue becomes reliable. It also supports better launch planning by showing which costs are essential immediately and which may be phased over time.
Break-Even Analysis
The break-even analysis section helps users identify when the IT compliance and governance business is expected to cover its costs and begin generating profit. It connects revenue assumptions, fixed costs, variable costs, payroll, service pricing, margins, and client growth to determine the point at which cumulative or period-based income is sufficient to support the cost structure. For a consulting-style business, break-even is a critical milestone because the early period often includes investment in staff, marketing, tools, and infrastructure before the client base reaches full scale. This section allows users to understand how many clients, billable hours, subscriptions, or project engagements may be needed to reach profitability. It also helps test how changes in pricing, consultant utilization, customer acquisition cost, or operating expenses can accelerate or delay the break-even point. The output is useful for business planning, funding preparation, and management decision-making because it gives users a specific financial target to manage toward. Investors, lenders, and founders can use the break-even view to evaluate risk, capital requirements, and the timeline for sustainable operations.
File types:
Excel – Single-User: .xlsx
Excel – Multi-User: .xlsx
Similar ProductsOther customers were also interested in...

 HenrySheykin
Day Care Financial Model Excel Template
The Daycare Center Financial Model helps entrepreneurs, childcare founders, consultants, analysts, a... Read more

Flight School Financial Model Excel Template
The Flight School Financial Model helps users turn an aviation training concept into a structured fi... Read more
Martial Arts School Financial Model Excel Template
The Martial Arts School Financial Model helps founders, school owners, consultants, and business pla... Read more

Driving School Financial Model Excel Template
The Driving School Financial Model Template helps users turn a driving school concept into a structu... Read more

Foreign Languages School Financial Model Excel Tem...
The Language School Financial Model helps users turn a language academy, tutoring center, or languag... Read more

Martial Arts School Financial Model Excel Template
The Martial Arts School Financial Model helps founders, school owners, consultants, and business pla... Read more

Music School Financial Model Excel Template
The Music School Financial Model helps users turn a music education concept into a structured five-y... Read more

Dog Obedience School Financial Model Excel Templat...
The Dog Training Financial Model helps users turn a dog training business concept into a structured ... Read more

Dance School Financial Model Excel Template
The Dance School Financial Model helps users turn a studio concept into a structured financial forec... Read more

Beauty School Financial Model Excel Template
The Beauty School Financial Model helps entrepreneurs, founders, consultants, and business planners ... Read more
You must log in to submit a review.