
0 ITEMS

Dance School Financial Model Excel Template
The Dance School Financial Model helps users turn a studio concept into a structured financial forecast for launch, expansion, funding, or internal planning. Built for the realities of a dance academy, it gives entrepreneurs and planners a practical way to estimate class tuition revenue, enrollment capacity, occupancy rates, workshop income, recital revenue, startup costs, operating expenses, payroll, cash flow, and profitability. Instead of building a forecast from scratch, buyers can work from a ready-to-use financial model template with editable assumptions and automated outputs designed to support better financial planning. This template is useful for dance school founders, studio owners, consultants, analysts, and anyone preparing a business plan, bank application, investor presentation, or operating budget. It connects the key drivers of the business, including class spots, monthly fees, instructor costs, rent, marketing, equipment, studio build-out, and recurring overhead. By adjusting the assumptions, users can test whether their planned pricing, enrollment goals, staffing structure, and cost base are realistic enough to support sustainable growth. The Dance School Financial Model includes a structured approach to revenue assumptions, expense planning, payroll forecasting, cash flow visibility, profitability tracking, scenario analysis, and break-even analysis. Users can review how changes in occupancy, pricing, program mix, or operating costs affect margins and available cash. This is especially important for a dance school, where fixed costs such as rent and salaries can be significant, while profitability often depends on filling classes, managing instructor schedules, and increasing student retention over time. Designed to be editable in Excel and Google Sheets, the model helps users save time while still allowing full customization for a specific location, studio size, pricing strategy, and service offering. It provides a clear financial planning framework that supports decision-making before launch and during operations. Whether the goal is to open a boutique dance studio, expand an existing performing arts school, or present a lender-ready plan, this template helps organize the numbers, evaluate financial feasibility, and communicate the business case with confidence.
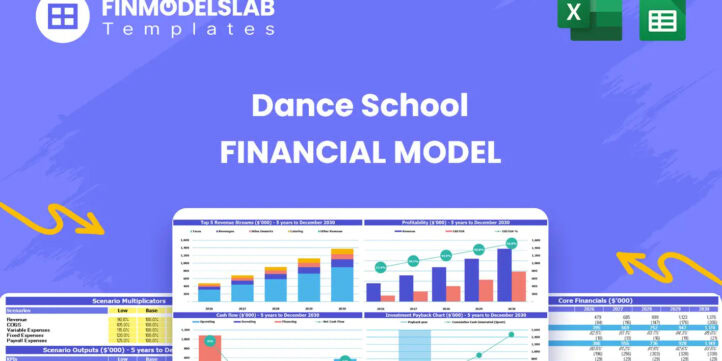


Financial Model Overview
The Dance School Financial Model is a ready-to-use financial model template designed to help founders, studio owners, consultants, and analysts plan the financial performance of a dance school with greater structure and clarity. A dance studio depends on several connected assumptions, including class capacity, enrollment levels, monthly tuition, workshop income, recital revenue, instructor payroll, rent, utilities, marketing, equipment, and startup investment. This model brings those assumptions into one organized planning framework so users can estimate revenue, costs, cash flow, profitability, and funding needs without building a spreadsheet from the ground up. It is especially useful for business plans, loan applications, investor discussions, budget reviews, and internal decision-making. Because the template is editable, users can adapt it to different dance formats, such as ballet, hip-hop, contemporary, fitness-based dance, children’s programs, adult classes, private lessons, summer camps, workshops, and performance events. The model is built to support up to five years of financial projections and gives users a practical way to test whether their pricing, occupancy, payroll, and operating cost assumptions can support a profitable and financially sustainable dance school.
All-in-One Dashboard
The all-in-one dashboard gives users a centralized view of the Dance School Financial Model by combining core inputs and core outputs in one convenient area. This section is designed to help users quickly understand the financial position of the studio without having to move through every underlying schedule. It may summarize key assumptions such as student capacity, class occupancy, tuition pricing, revenue growth, major operating costs, payroll levels, startup funding, and forecast timing. It also helps present outputs such as projected revenue, gross profit, EBITDA, net income, cash balance, margins, and investment performance. For a dance school, this is useful because many planning decisions depend on the relationship between enrollment, pricing, and cost structure. A founder can adjust assumptions such as monthly student fees, occupancy rates, studio rent, instructor wages, or marketing spend and then see how those changes affect the forecast. The dashboard helps support planning conversations with lenders, investors, partners, or internal teams by turning a detailed model into an easy-to-read financial summary. It is also useful for ongoing management because the user can revisit the dashboard as new enrollment data, expense quotes, or strategic priorities become available.
Low, Base, and High Scenario Analysis
The Low, Base, and High scenario analysis component helps users evaluate how the dance school may perform under different operating conditions. Instead of relying on a single forecast, this section gives the user a structured way to compare a conservative case, a realistic expected case, and an optimistic growth case. Inputs may include different class occupancy rates, student enrollment levels, tuition pricing, workshop participation, recital income, payroll assumptions, marketing budgets, rent increases, and operating cost inflation. The output helps show how revenue, profit margins, cash flow, break-even timing, and cash reserves may change depending on whether the studio starts slowly, meets expectations, or grows faster than planned. This is particularly valuable for a dance school because early enrollment can vary significantly based on location, brand awareness, competition, class schedule, and marketing effectiveness. A low scenario can highlight funding risks or months where cash may become tight, while a high scenario can show the impact of strong demand and better class utilization. For business planning and funding preparation, this scenario structure gives lenders and stakeholders confidence that the user has considered risk, not just upside potential. It also supports decision-making by helping the owner choose a pricing strategy, opening budget, staffing plan, and growth path that remain realistic across different market outcomes.
Professional Charts
The professional charts component converts the financial projections into visual reports that are easier to review, explain, and present. This section may include charts for revenue growth, expense trends, EBITDA, net profit, cash flow, cash balance, margin development, revenue mix, or year-by-year financial performance. The inputs come from the model’s forecast schedules, while the outputs are presentation-ready visuals that help users communicate the story behind the numbers. For a dance school, charts are especially useful because they can show how occupancy growth, tuition increases, class expansion, and event income contribute to the studio’s financial trajectory over time. They also make it easier to identify patterns, such as whether expenses are rising faster than revenue, whether cash reserves remain healthy, or whether profitability improves as class capacity becomes more fully utilized. Professional visuals are useful for investor decks, bank meetings, business plans, partner discussions, and management reviews because they reduce the need to interpret dense rows of spreadsheet data. Instead of manually creating charts, users can rely on the pre-built visual structure and focus on refining assumptions. This helps make the Dance School Financial Model more practical for both financial users and non-financial founders who need clear outputs for decision-making and stakeholder communication.
ROE Components and DuPont Analysis
The ROE components and DuPont analysis section helps users understand the drivers behind return on equity rather than looking only at the final percentage. Return on equity is an important investor metric because it shows how effectively the business generates profit from the capital invested by owners or shareholders. The DuPont approach breaks this return into underlying components, typically connecting profitability, asset efficiency, and financial leverage. In the context of a dance school, this can help users see whether returns are being driven by strong net profit margins, efficient use of studio assets, or the way the business is financed. Inputs may include net income, revenue, total assets, equity investment, liabilities, margins, and turnover assumptions. Outputs may include return on equity, profit margin, asset turnover, leverage ratios, and related performance indicators. This component is useful for founders seeking investment because it helps explain why the business may generate attractive returns and where those returns are coming from. It also supports operational decision-making. If returns are weak, the user can investigate whether pricing is too low, occupancy is insufficient, payroll is too high, assets are underused, or the financing structure needs adjustment. By breaking investor returns into practical drivers, this section gives the financial model a more analytical and professional planning layer.
Revenue Inputs
The revenue inputs section is where users define the commercial assumptions that drive the financial forecast. For a dance school, revenue is usually built around class capacity, student enrollment, occupancy rates, monthly tuition fees, private lessons, workshops, camps, recital tickets, registration fees, merchandise, and other ancillary income. This component allows users to edit the core revenue assumptions to match their specific studio concept, location, class schedule, and pricing strategy. Inputs may include the number of available spots in each program, expected utilization, pricing by class type, annual fee increases, program launch timing, event frequency, and student participation levels. These inputs then flow into the revenue forecast and help calculate monthly and annual sales projections. The section is useful because it connects real operating decisions to financial outcomes. For example, changing children’s ballet capacity, increasing adult program pricing, adding a weekend workshop, or improving class occupancy can all affect total revenue and profitability. A dance studio founder can use this component to test whether the planned mix of classes is financially viable and whether the business needs more students, higher pricing, additional services, or improved retention to meet its goals. For consultants and analysts, the revenue input area also provides a clear audit trail of the assumptions behind the forecast, which is important when preparing a business plan or funding document.
Bank-Ready Reports
The bank-ready reports component organizes the key financial outputs that lenders, investors, and stakeholders typically expect to review. This section may include projected profit and loss statements, cash flow forecasts, balance sheet summaries, funding requirements, repayment capacity indicators, profitability measures, and financial summaries suitable for business plan attachments. The purpose is to present the Dance School Financial Model in a lender-friendly format that focuses on startup costs, monthly cash flow, break-even timing, debt service capacity, and the assumptions behind tuition and enrollment. Inputs are drawn from the revenue, expense, payroll, startup cost, financing, and working capital sections of the model, while outputs provide structured statements and summaries that are easier to share. This is useful because a lender will want to see whether the studio can generate enough cash to cover rent, payroll, operating expenses, and any loan repayments. Investors may also want to understand profitability, return potential, and growth assumptions. A professional reporting section helps users avoid disorganized spreadsheets and instead present a clear financial case. It can support loan applications, grant submissions, investor conversations, lease negotiations, and internal approvals. Because the model is editable, users can refine the reports as assumptions change, making the template useful throughout both planning and operating stages.
Revenue Breakdown
The revenue breakdown component provides a detailed view of how total income is generated across different dance school revenue streams. Rather than presenting only one total revenue number, this section separates income by service type so users can understand which programs contribute the most to sales and margins. It may include monthly tuition from children’s classes, adult dance programs, hip-hop classes, ballet programs, contemporary dance, fitness dance, private lessons, workshops, recitals, registration fees, camps, merchandise, or special events. Inputs may include pricing, capacity, expected student numbers, occupancy rates, event frequency, participation rates, and revenue growth assumptions. Outputs may show revenue by category, monthly performance, annual totals, percentage contribution by stream, and changes in revenue mix over time. This is valuable because a dance school often has several ways to earn income, and not every stream has the same growth potential or profitability. The user can see whether the business depends too heavily on one program, whether adult classes are underperforming, whether workshops could become a meaningful revenue source, or whether recital income provides seasonal cash flow support. This component helps with scheduling, marketing, pricing, and program design decisions. It also strengthens funding presentations because stakeholders can see the logic behind total revenue instead of relying on a single broad sales estimate.
KPI Dashboard
The KPI dashboard tracks the operating and financial performance metrics that matter most for a dance school. While the main dashboard summarizes overall financial results, the KPI dashboard focuses on measurable indicators that help users monitor whether the business is performing according to plan. Inputs may include student count, class capacity, occupancy rate, average monthly fee, revenue per student, instructor cost, payroll as a percentage of revenue, marketing spend, rent, gross margin, EBITDA margin, cash balance, customer growth, and retention-related assumptions. Outputs may include key performance indicators, benchmark comparisons, trend summaries, and visual metrics that help users interpret the health of the studio. This is useful because a dance school’s success is not determined by revenue alone. A studio may grow sales but still face pressure if instructor costs are too high, classes are not filled efficiently, rent consumes too much revenue, or marketing spend does not produce enough enrollment. The KPI dashboard helps users connect day-to-day operational metrics with financial outcomes. It can also be used in monthly reviews after the business launches, allowing owners to compare actual performance with forecast expectations. For investors and lenders, KPI tracking demonstrates that the business plan is built around practical operating drivers, not just accounting outputs.
Break-Even Analysis
The break-even analysis component helps users identify when the dance school is expected to cover its costs and begin generating profit. This section compares projected revenue with fixed and variable expenses to determine the level of enrollment, tuition income, or total sales required to reach break-even. Inputs may include monthly rent, instructor payroll, administrative salaries, utilities, insurance, software, marketing, music licensing, cleaning, supplies, payment processing fees, and other operating expenses. Revenue assumptions such as class pricing, student capacity, and occupancy rates are also important because they determine how quickly the business can cover its cost base. Outputs may include break-even month, break-even revenue, required student count, required occupancy rate, and the gap between projected performance and the break-even threshold. This is especially important for a dance school because many costs begin before full enrollment is achieved. Rent, utilities, build-out costs, staff preparation, and marketing commitments can create pressure during the early months. By using the break-even analysis, founders can test whether their launch plan is realistic, whether they need a pre-opening enrollment campaign, whether pricing should be adjusted, or whether expenses should be reduced before opening. For funding documents, this section helps answer one of the most important stakeholder questions: how long it may take before the studio becomes financially self-supporting.
Startup and Operating Cost Planning
The startup and operating cost planning component helps users estimate both the upfront investment required to open the dance school and the recurring expenses needed to keep it running.
Similar ProductsOther customers were also interested in...


 HenrySheykin
Martial Arts School Financial Model Excel Template
The Martial Arts School Financial Model helps founders, school owners, consultants, and business pla... Read more

Martial Arts School Financial Model Excel Template
The Martial Arts School Financial Model helps founders, school owners, consultants, and business pla... Read more

 Giorgos
Scuba Diving Center – 5 Year Financial Model
Scuba diving affords an unparalleled experience with the underwater world. However, safe diving requ... Read more

Dance Studio Financial Model – 5 Year Financial ...
Provides an advanced 5-year financial plan for a startup or operating Dance Studio and is a flexible... Read more

Sky Diving Center – 5 Year Financial Model
Skydiving is the sport of jumping from an aircraft and performing acrobatic maneuvers in the air dur... Read more

Baby Swimming School – Dynamic 10 Year Financial...
Financial model providing a dynamic 10-Year Financial Plan for a Baby Swimming School for children u... Read more

 City Finance
Swimming School Financial Model Excel Template
A comprehensive editable, 5-year 3 statement MS Excel spreadsheet for tracking Swimming School finan... Read more
Day Care Financial Model Excel Template
The Daycare Center Financial Model helps entrepreneurs, childcare founders, consultants, analysts, a... Read more

Driving School Financial Model Excel Template
The Driving School Financial Model Template helps users turn a driving school concept into a structu... Read more

Foreign Languages School Financial Model Excel Tem...
The Language School Financial Model helps users turn a language academy, tutoring center, or languag... Read more
You must log in to submit a review.