
0 ITEMS

Homewares Marketplace Financial Model Excel Template
The Online Homeware Store Financial Model is a ready-to-use financial model template built to help entrepreneurs, founders, consultants, analysts, and business owners evaluate the commercial potential of an e-commerce homeware business. Instead of starting with a blank spreadsheet, users can work from a structured model designed around the realities of selling furniture, decor, and homeware products online. It helps organize financial planning around the core questions that matter most, including how revenue will grow, what startup costs are required, how operating expenses behave, and when the business can move toward profitability. This template is especially useful for anyone preparing a business plan, investor pitch, loan application, internal budget, or expansion forecast for an online homeware store. It connects revenue assumptions such as customer acquisition cost, marketing spend, repeat customer rates, product mix, and average order value with the financial outputs needed for decision-making. Users can adjust assumptions to reflect their own pricing strategy, sales channels, marketing plan, staffing needs, supplier costs, and growth targets, making the model practical for both early-stage startups and existing online retailers planning to scale. The model supports a complete view of startup and ongoing financial performance by bringing together revenue forecasting, startup costs, operating expenses, payroll planning, cost of goods sold, cash flow, profit and loss, and funding needs. It also helps users understand the relationship between customer growth, inventory costs, gross margin, overhead, and working capital. This is important for an online homeware business where cash can be tied up in stock, freight, supplier payments, website operations, paid advertising, and fulfillment before the business reaches stable profitability. By using this financial model template, buyers can test scenarios, review profitability, evaluate break-even analysis, and make better decisions before committing capital. The template is fully editable and suitable for Excel or Google Sheets, allowing users to customize assumptions, update forecasts, and share results with co-founders, investors, lenders, or advisors. It is designed to save time, improve financial clarity, and help users present a professional forecast that explains how the online homeware store can grow, manage cash flow, and become financially sustainable.
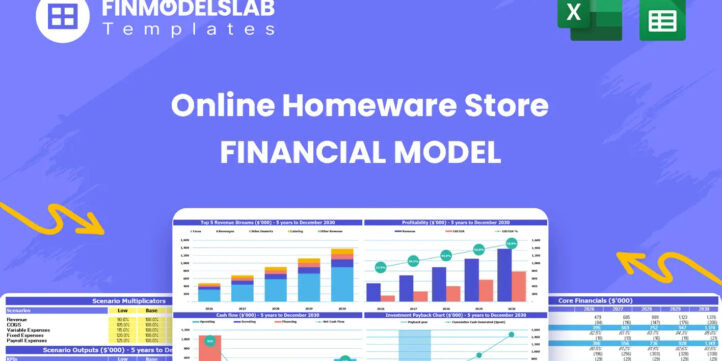


Financial Model Overview
The Online Homeware Store Financial Model is a practical financial model template created for planning, launching, funding, and scaling an e-commerce business that sells homeware, furniture, decor, and related household products. Online homeware stores often face a unique combination of financial challenges, including high customer acquisition costs, supplier and freight expenses, product category margin differences, inventory planning, website and platform costs, fulfillment requirements, and the need to build repeat customer behavior over time.
This model helps bring those moving parts into one structured forecast so users can understand how the business may perform before making major strategic or investment decisions. It is designed for entrepreneurs, founders, consultants, analysts, business owners, and anyone preparing business plans, funding documents, lender submissions, or internal operating budgets. The template is editable, investor-ready, and built to help users replace guesswork with clear assumptions, connected calculations, and professional financial outputs.
All-in-One Dashboard
The all-in-one dashboard acts as the central control panel for the Online Homeware Store Financial Model, bringing together the most important inputs and outputs in one place. Users can review and update key assumptions such as launch timing, marketing budget, customer acquisition cost, repeat customer behavior, average order values, gross margins, operating cost levels, staffing plans, and capital requirements, while also seeing the effect of those assumptions on revenue, profit, cash flow, and business value. For an online homeware store, this is useful because many decisions are interconnected.
A higher marketing spend may increase new customer sales, but it can also put pressure on cash flow. A stronger repeat purchase rate may improve profitability, but it depends on fulfillment quality, customer experience, product assortment, and pricing. The dashboard helps users quickly see whether the overall plan is financially balanced and whether the store has enough sales momentum to support inventory costs, payroll, software, shipping, and overhead. It also gives founders and advisors a faster way to review the business without searching through multiple worksheets, making it ideal for planning sessions, pitch preparation, and ongoing decision-making.
Low, Base, and High Scenario Analysis
The Low, Base, and High scenario analysis section helps users test how the online homeware store performs under different market and operating conditions. Instead of relying on one forecast, the model allows users to compare a conservative case, a realistic base case, and a more optimistic growth case. Inputs may include variations in customer acquisition cost, paid marketing conversion, repeat customer rate, average order value, gross margin, supplier pricing, freight costs, operating expenses, and hiring pace.
This is particularly important for an e-commerce homeware business because growth can be sensitive to advertising efficiency, customer loyalty, supply chain costs, and product mix. A low case may show what happens if marketing is less efficient or repeat purchases build more slowly than expected. A high case may show the upside if brand awareness improves, average order value increases, or customer retention strengthens. The outputs help users compare revenue, EBITDA, profit, cash runway, funding needs, and break-even timing across scenarios. This section is valuable for investors and lenders because it shows that the business plan has been pressure-tested, and it helps founders prepare contingency plans before committing to inventory, staff, or aggressive advertising spend.
Professional Charts
The professional charts section converts the financial model’s calculations into presentation-ready visuals that make the business story easier to communicate. Instead of presenting only rows of numbers, users can show trends in revenue growth, gross profit, EBITDA, net income, cash balance, cost structure, customer growth, and other financial metrics through clear charts and graphs.
For an online homeware store, visual reporting is useful because stakeholders need to understand how the company moves from early investment and cash burn toward scale, repeat customer revenue, and improved profitability. Charts can help show whether revenue growth is supported by sustainable margins, whether operating expenses are becoming more efficient over time, and whether the business is building enough cash to support expansion.
These visuals are especially helpful in investor decks, lender meetings, board updates, and internal planning discussions because they simplify complex financial information without removing the detail behind the forecast. The charts can also make it easier to compare scenarios, identify inflection points, and explain the financial effect of strategic decisions such as increasing paid advertising, adding new product categories, negotiating better supplier terms, or delaying hires until the business reaches stronger revenue levels.
ROE Components and DuPont Analysis
The ROE components and DuPont analysis section breaks return on equity into its underlying drivers so users can better understand what is creating or limiting shareholder returns. Rather than looking only at a single return on equity percentage, the model can separate performance into components such as profit margin, asset turnover, and financial leverage. This is valuable for an online homeware store because profitability is affected by several operational factors, including product margin, fulfillment cost, marketing efficiency, inventory investment, fixed overhead, and the amount of capital required to scale. A business may generate strong sales but weak returns if inventory turns slowly, gross margins are too low, or overhead grows faster than revenue.
Conversely, a store with disciplined product sourcing, efficient customer acquisition, and strong repeat purchases may improve returns even without excessive leverage. The DuPont-style view helps users understand whether returns are being driven by true operating performance or by financing structure. It also supports investor discussions by showing how management can improve returns through better pricing, lower cost of goods sold, improved inventory efficiency, tighter expense control, and more effective use of invested capital. This makes the model more than a basic sales forecast and turns it into a tool for strategic performance analysis.
Revenue Inputs
The revenue inputs section is where users define the commercial assumptions that drive the online homeware store’s sales forecast. Inputs may include marketing budget, customer acquisition cost, number of new customers, repeat customer rate, customer lifetime behavior, average order value, product categories, pricing assumptions, category mix, conversion expectations, and seasonal growth patterns. For an e-commerce homeware business, revenue is not just a simple monthly sales number. It is often driven by paid advertising, brand visibility, conversion quality, customer trust, product selection, and the ability to turn first-time buyers into repeat customers.
This section helps users connect those drivers to forecasted sales in a structured way. It can be used to model new customer sales generated by advertising, repeat sales from an expanding customer base, and product mix across categories such as sofas, coffee tables, decor, lighting, textiles, storage, or other homeware items. By adjusting assumptions, users can see how changes in CAC, repeat purchase behavior, pricing, and product category focus affect total revenue. This is essential for building a realistic business plan because it forces the user to explain where sales come from, how customer growth will be achieved, and whether the marketing plan is financially sustainable.
Bank-Ready Reports
The bank-ready reports section produces structured financial outputs that can support loan applications, investor reviews, stakeholder presentations, and formal business planning. These reports may include profit and loss statements, cash flow projections, balance sheet summaries, funding requirements, debt assumptions, capital expenditure planning, and key financial summaries formatted in a clear and professional way. For an online homeware store, lender-friendly reporting is important because banks and financing partners will want to understand how the business generates revenue, how much cash is needed before profitability, whether the company can manage working capital, and how repayment capacity develops over time.
The reports help users present the numbers in a format that is easier for external reviewers to assess. Instead of sending disconnected assumptions or informal spreadsheets, founders can show a financial model with consistent statements, linked calculations, and transparent assumptions. This improves credibility when discussing startup funding, inventory financing, website development costs, marketing budgets, or growth capital. It also helps internal users review financial performance from a lender’s perspective, including whether projected cash flows are sufficient to support obligations and whether the business has enough runway to reach key milestones.
Revenue Breakdown
The revenue breakdown section provides a detailed view of how total sales are built across customer types, product categories, and revenue streams. In an online homeware store, overall revenue may include sales from new customers acquired through marketing, repeat purchases from existing customers, category-level sales across furniture and decor lines, and possibly different product groups with varying margins and average order values.
This component helps users move beyond a single top-line revenue number and understand which parts of the business are contributing most to growth. Inputs can include category mix, average order value by product type, customer volume, repeat purchase assumptions, conversion rates, and growth expectations. Outputs can show how revenue is distributed across categories and how that distribution changes over time as the business scales.
This is useful for product planning because sofas, tables, lighting, textiles, decorative items, and smaller accessories may each have different pricing, fulfillment costs, margin profiles, and purchase frequency. By reviewing the revenue breakdown, users can identify which categories deserve more marketing attention, which products may improve profitability, and whether the store is too dependent on one sales stream. It also supports better inventory planning and supplier negotiations by clarifying expected demand by product category.
KPI Dashboard
The KPI dashboard section tracks the key performance indicators that matter most for managing an online homeware store. Metrics may include revenue growth, gross margin, EBITDA margin, net profit, cash balance, customer acquisition cost, average order value, repeat customer rate, customer lifetime value, payback period, conversion assumptions, and other operating or financial benchmarks. This dashboard is useful because e-commerce businesses can look healthy at the sales level while still struggling with profitability or cash flow if CAC is too high, margins are too low, or repeat purchases are not strong enough.
By organizing KPIs in one place, the model helps users evaluate the business from both a financial and operating perspective. The dashboard can also support benchmark comparisons, allowing users to assess whether assumptions are realistic relative to common e-commerce standards. For founders and managers, this section helps turn the financial model into an ongoing decision-making tool rather than a one-time forecast. It can highlight whether marketing spend is producing enough customers, whether pricing supports gross margin targets, whether operating expenses are scaling efficiently, and whether cash reserves are adequate. For investors and advisors, it provides a concise view of business health and makes the forecast easier to evaluate.
Startup Costs and Operating Expense Planning
The startup costs and operating expense planning section helps users estimate the investment required to launch and operate the online homeware store before it becomes self-sustaining. Startup costs may include website platform customization, e-commerce technology, branding, legal setup, initial software tools, office equipment, product photography, supplier setup, early marketing, deposits, licenses, and working capital reserves.
Operating expenses may include payroll, rent or office costs, platform subscriptions, payment processing fees, advertising management tools, fulfillment support, customer service, accounting, insurance, logistics administration, and general overhead. This component is important because many online retail businesses underestimate the cash needed before revenue reaches scale. A homeware store may also require upfront investment in product listings, website quality, supplier relationships, and brand presentation before customers begin purchasing consistently.
The model helps users separate one-time launch expenses from recurring monthly costs so they can build a realistic budget and avoid cash flow surprises. It also supports funding discussions by showing exactly where startup capital will be used and how much ongoing cost the business must cover each month. By adjusting payroll, marketing support, software costs, and fixed overhead, users can test lean and growth-oriented operating plans and choose a structure that fits their available capital and risk tolerance.
Break-Even and Cash Flow Runway Analysis
The break-even and cash flow runway analysis section helps users understand when the online homeware store may become profitable and how much cash is needed to reach that point. Break-even analysis compares projected revenue with fixed costs, variable costs, cost of goods sold, marketing expense, payroll, and overhead to estimate the point at which the business covers its total costs. Cash flow runway analysis then shows whether the company has enough funding to survive the early period of investment, customer acquisition, inventory planning, and operational setup.
This is especially important for an e-commerce homeware business because early losses can be normal while the store builds traffic, brand recognition, repeat customers, and supplier efficiency. The section may use inputs such as monthly revenue, gross margin, CAC, operating expenses, capital expenditures, working capital needs, and starting cash balance to calculate the lowest cash point, funding gap, and time to cash-flow stability. These outputs help users decide whether they need outside funding, how much capital to raise, when to control expenses, and whether to delay certain growth initiatives.
Similar ProductsOther customers were also interested in...


 HenrySheykin
Online Services Marketplace Financial Model Excel ...
The Online Services Marketplace Financial Model helps founders, entrepreneurs, consultants, analysts... Read more
Fashion Marketplace Financial Model Excel Template
The Fashion Retail Financial Model helps entrepreneurs, founders, business owners, consultants, and ... Read more

General Marketplace Financial Model Excel Template
The General Marketplace Financial Model Financial Model Template helps users plan, evaluate, and pre... Read more
Etsy & Ebay Store Financial Model Excel Templa...
The Etsy and eBay Store Financial Model helps marketplace sellers, founders, consultants, and busine... Read more

Toys Marketplace Financial Model Excel Template
The Toy Marketplace Financial Model Template helps founders, entrepreneurs, consultants, analysts, a... Read more
Information Marketplace Financial Model Excel Temp...
The Digital Products Marketplace Financial Model helps founders, entrepreneurs, consultants, analyst... Read more

Books Marketplace Financial Model Excel Template
The Bookstore Financial Model helps entrepreneurs, bookstore owners, consultants, analysts, and busi... Read more

Online Coaching Marketplace Financial Model Excel ...
The Online Coaching Platform Financial Model helps founders, entrepreneurs, consultants, analysts, a... Read more

Kickstarter Marketplace Financial Model Excel Temp...
The Crowdfunding Marketplace Financial Model helps founders, entrepreneurs, analysts, consultants, a... Read more

Airbnb Marketplace Financial Model Excel Template
The Airbnb Business Financial Model helps users turn a short-term rental or vacation rental concept ... Read more
You must log in to submit a review.