
0 ITEMS

Engineering Consulting Financial Model Excel Template
The Engineering Consulting Firm Financial Model helps users turn a consulting business plan into a structured five-year financial forecast. Built for engineering consultants, founders, business owners, analysts, and advisors, it provides a practical framework for estimating revenue potential, startup costs, operating expenses, payroll, cash flow, profitability, and funding requirements. Instead of building a model from a blank spreadsheet, users can work from a ready-to-use template designed around the economics of an engineering services business, including billable hours, service pricing, client growth, project mix, staff capacity, subcontractor costs, software expenses, and capital investment needs. This financial model template is useful for new firms preparing to launch, existing engineering consultancies planning expansion, and consultants preparing business plans, loan applications, investor materials, or internal budgets. It helps organize key financial planning assumptions in one place so users can test whether their service mix, pricing strategy, hiring plan, and expense structure support long-term profitability. The model can be customized for different engineering consulting niches, including traditional engineering advisory, project management, and higher-value technical services such as AI digital twin modeling or specialized design support. The template connects assumptions with financial outputs, allowing users to review projected revenue, profit and loss, cash flow, balance sheet movement, and performance metrics over time. It helps show when the firm may move from early-stage losses to sustainable profitability, how much cash may be required before break-even analysis indicates positive results, and where decisions around staffing, utilization, marketing, and pricing may have the greatest impact. This makes it valuable for decision-making before committing capital, hiring employees, purchasing equipment, or entering into major client contracts. Designed to be editable and presentation-ready, the Engineering Consulting Firm Financial Model supports both detailed analysis and stakeholder communication. Users can update the assumptions, compare scenarios, review cash flow pressure points, and present professional outputs to lenders, investors, partners, or management teams. For anyone building a financial plan for an engineering consulting firm, this template provides a clear, time-saving way to evaluate feasibility, funding needs, and growth strategy with more confidence.
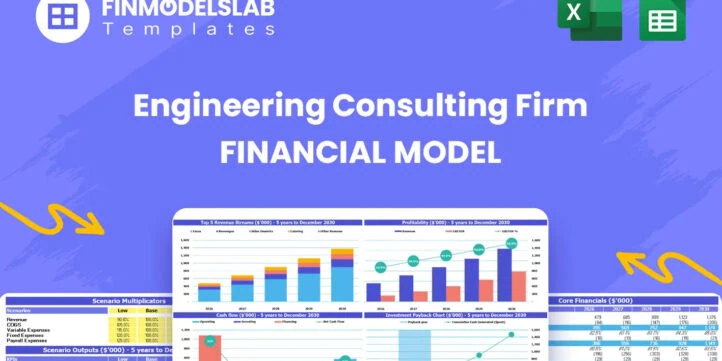


Financial Model Overview
The Engineering Consulting Firm Financial Model is a ready-to-use financial model template designed to help founders, engineering consultants, business owners, analysts, and advisors plan the financial performance of an engineering services business. It brings together the core drivers of a consulting firm, including billable hours, hourly rates, service mix, staffing, project delivery costs, software tools, capital equipment, overhead, working capital, and funding needs.
The model is useful for launching a new engineering consultancy, expanding an existing firm, preparing a business plan, supporting a loan application, or presenting financial projections to investors and stakeholders. Instead of relying on rough estimates, users can enter their own assumptions and review structured outputs covering revenue, expenses, profit and loss, cash flow, balance sheet movement, break-even timing, investor metrics, and key performance indicators. The template is fully editable, compatible with Excel and Google Sheets, and built to support practical decision-making for a professional engineering consulting business.
All-in-One Dashboard
The all-in-one dashboard gives users a central view of the most important inputs and outputs in the Engineering Consulting Firm Financial Model. This component is designed to make the model easier to navigate by showing core assumptions, financial results, and summary metrics in one place. Users can review high-level revenue forecasts, profitability indicators, cash position, break-even timing, and other key outputs without moving through every detailed worksheet.
For an engineering consulting firm, this is especially useful because financial performance depends on many connected variables, such as billable utilization, service pricing, project volume, consultant headcount, subcontractor support, software costs, and overhead. The dashboard helps users quickly understand whether the business plan is financially viable, whether revenue is growing fast enough to support payroll and operating expenses, and whether cash reserves are sufficient during the early scaling period. It also supports stakeholder communication by turning detailed spreadsheet calculations into a clear management view that can be used in planning meetings, funding discussions, and monthly performance reviews.
Low Base High Scenario Analysis
The low, base, and high scenario analysis component allows users to test the Engineering Consulting Firm Financial Model under different business conditions. Instead of relying on a single forecast, users can compare how the firm may perform if client acquisition is slower than expected, if the base plan is achieved, or if demand and pricing exceed expectations. Inputs may include client growth, billable hours, utilization rates, hourly fees, service mix, employee hiring timelines, project costs, marketing spend, and collection assumptions. The outputs help show how revenue, EBITDA, cash flow, profit margins, funding needs, and break-even timing change across scenarios.
This is valuable for engineering consulting because project pipelines can vary based on market conditions, procurement cycles, infrastructure budgets, private sector investment, and the firm’s ability to win recurring client work. Scenario planning helps founders and managers prepare contingency plans, set realistic targets, identify downside risks, and communicate a more balanced financial story to lenders or investors. It also helps users make better decisions about hiring, technology investment, and expansion timing.
Professional Charts
The professional charts component converts the financial forecast into clear visual reports that are easier to interpret and present. This section helps users visualize trends in revenue, gross margin, operating profit, EBITDA, cash flow, break-even progress, and other important metrics across the five-year projection period. For an engineering consulting firm, charts can make complex financial information more understandable by showing how revenue grows as the client base expands, how profitability improves as utilization increases, and how cash balances move during periods of investment and scale-up.
The inputs come from the model’s revenue assumptions, cost structure, payroll plan, capital expenditures, and financial statements, while the outputs are presentation-ready visuals that can support business plans, investor decks, bank discussions, internal reviews, and board updates. This component is useful because many stakeholders prefer to see financial performance in a visual format before reviewing detailed spreadsheets. It helps communicate whether the firm’s growth plan is realistic, where the main turning points occur, and how the business may progress from launch to maturity.
ROE Components and DuPont Analysis
The ROE components and DuPont analysis section helps users understand what drives return on equity within the Engineering Consulting Firm Financial Model. Rather than showing return on equity as a single result, this component breaks performance into underlying drivers such as profitability, asset efficiency, and financial leverage. Inputs may include net income, revenue, total assets, equity, debt levels, margins, and balance sheet assumptions. The outputs help users see whether return on equity is being driven by stronger margins, better use of assets, or higher leverage.
For an engineering consulting firm, this analysis can be useful because the business may require startup investment in office setup, computing equipment, CAD workstations, software systems, and working capital before it reaches stable profitability. DuPont analysis helps founders, investors, and analysts evaluate whether the firm’s capital is being used effectively and whether growth is creating enough financial return relative to the equity invested. It also supports strategic decision-making by highlighting whether the firm should focus on margin improvement, revenue productivity, asset utilization, or capital structure optimization.
Revenue Inputs
The revenue inputs component is where users define the commercial assumptions that drive the financial forecast. In the Engineering Consulting Firm Financial Model, revenue can be built around service categories such as engineering consulting, project management, and AI digital twin modeling or other specialized technical services. Inputs may include hourly billing rates, billable hours, number of clients, project frequency, consultant utilization, service mix, annual growth rates, and changes in pricing over time. This component is especially important because engineering consulting revenue is typically tied to professional capacity, client demand, and the ability to convert expertise into billable work.
By adjusting the revenue inputs, users can test how different pricing strategies, client acquisition plans, and service offerings affect total sales and profitability. The outputs feed into the income statement, cash flow forecast, profitability analysis, dashboard, charts, and investor metrics. A well-structured revenue input section helps users avoid vague top-down estimates and instead build a forecast based on practical operating assumptions that can be explained to lenders, investors, partners, or internal decision-makers.
Bank-Ready Reports
The bank-ready reports component provides lender-friendly financial outputs that can support funding applications and credit discussions. This section is designed to organize the firm’s projected financial performance in a format that is clear, structured, and practical for banks or financing partners. Outputs may include projected profit and loss statements, cash flow statements, balance sheets, debt service considerations, funding requirements, profitability trends, and liquidity indicators.
For an engineering consulting firm, bank-ready reporting is useful because early-stage funding may be needed to cover startup costs, specialized equipment, office setup, payroll, software subscriptions, working capital, and delayed client payments. The reports help lenders understand how the business expects to generate revenue, manage expenses, reach break-even, and maintain enough cash to operate. Inputs are drawn from the model’s assumptions around revenue, operating expenses, payroll, capital expenditures, debt financing, and working capital. This component helps users present a more credible financial plan, reduce the time required to prepare loan documentation, and answer common lender questions about repayment capacity, cash runway, and financial stability.
Revenue Breakdown
The revenue breakdown component gives users a more detailed view of how total revenue is generated across service lines and business activities. Instead of showing only one consolidated revenue number, this section separates income by revenue stream, such as traditional engineering consulting, project management, and specialized technical services. Inputs may include hourly rates, billable hours, number of projects, project duration, client categories, growth assumptions, and service mix percentages. The outputs help users see which services contribute the most revenue, which offerings may have stronger growth potential, and how a shift toward higher-value services could improve the firm’s financial results.
For an engineering consulting firm, this component is valuable because not all services have the same margin profile, staffing requirement, technology cost, or sales cycle. A detailed revenue breakdown helps users evaluate whether the firm is too dependent on one service line, whether new offerings can improve long-term profitability, and whether staffing plans align with expected demand. It also supports more informed pricing decisions, sales planning, resource allocation, and investor communication.
KPI Dashboard
The KPI dashboard component focuses on the key performance indicators that matter most for managing an engineering consulting firm. This section may track metrics such as revenue growth, EBITDA margin, gross margin, cash balance, utilization, revenue per consultant, payroll as a percentage of revenue, client acquisition efficiency, break-even progress, return on equity, and other business health indicators. Inputs come from the model’s revenue assumptions, staffing plan, expense forecast, cash flow schedule, and financial statements. The outputs provide a concise view of performance so users can monitor whether the business is moving toward its goals.
For engineering consultants and firm owners, KPIs are important because profitability depends on the disciplined management of billable capacity, project margins, payroll, overhead, and client pipeline quality. The KPI dashboard helps users identify issues early, such as underutilized staff, rising project costs, weak cash reserves, or a service mix that does not support target margins. It is useful for monthly management reviews, investor updates, internal planning, and benchmarking performance against business objectives or industry standards.
Startup and Operating Cost Planning
The startup and operating cost planning component helps users estimate the investment required to launch and run the engineering consulting firm. This section can include one-time startup costs such as office setup, furnishings, advanced CAD workstations, high-performance computing servers, licenses, initial software implementation, legal setup, branding, website development, deposits, and pre-opening marketing. It can also include recurring operating expenses such as rent, utilities, insurance, professional subscriptions, software licenses, subcontractor fees, travel, sales and marketing, accounting, administrative support, and general overhead.
For an engineering consulting firm, this component is essential because specialized tools, technical software, computing resources, and qualified employees can create meaningful upfront and ongoing costs. Inputs from this section feed into the cash flow forecast, funding requirements, profit and loss statement, and balance sheet. The outputs help users understand how much capital may be needed before the firm generates consistent revenue, how fixed and variable expenses affect profitability, and which costs should be controlled during the early stages. This supports budgeting, funding preparation, launch planning, and operational discipline.
Break-Even and Cash Flow Forecasting
The break-even and cash flow forecasting component helps users determine when the engineering consulting firm may become financially self-sustaining and how much liquidity is needed before that point. Inputs may include revenue by service line, payroll, subcontractor costs, software expenses, rent, overhead, capital expenditures, debt funding, equity funding, invoicing cycles, payment collection timing, and working capital assumptions. The outputs show projected cash inflows and outflows, monthly and annual cash balances, minimum cash requirements, profit milestones, and the point at which total revenue covers total costs.
This is especially important for engineering consulting businesses because revenue may depend on project-based billing, milestone payments, and client collection timing, while payroll and software costs must often be paid regularly regardless of collections. Break-even analysis helps users see the volume of billable work needed to cover expenses, while cash flow forecasting helps identify potential shortfalls before they occur. This component supports better decisions around funding, credit lines, hiring, client payment terms, cost control, and growth pacing, making it a critical planning tool for founders, lenders, and investors.
File types:
Excel – Single-User: .xlsx
Excel – Multi-User: .xlsx
Similar ProductsOther customers were also interested in...


 HenrySheykin
Insurance Agency Financial Model Excel Template
The Insurance Agency Financial Model helps entrepreneurs, agency owners, consultants, analysts, and ... Read more
Architecture Firm Financial Model Excel Template
The Architectural Firm Financial Model Template helps founders, architecture practice owners, consul... Read more

Consulting Agency Financial Model Excel Template
The Consulting Firm Financial Model helps users turn a service-based consulting concept into a struc... Read more
Financial Advisors Agency Financial Model Excel Te...
The Financial Advisor Financial Model is a ready-to-use financial model template built for planning,... Read more

Notary Financial Model Excel Template
The Notary Service Financial Model helps entrepreneurs, business owners, consultants, analysts, and ... Read more

Travel Agency Financial Model Excel Template
The Travel Agency Financial Model helps entrepreneurs, founders, consultants, analysts, and business... Read more

Private Counseling Practice Financial Model Excel ...
The Private Counseling Financial Model helps users turn a therapy practice concept into a structured... Read more

Life Coaching Financial Model Excel Template
The Life Coaching Financial Model helps coaches, entrepreneurs, consultants, founders, and business ... Read more
Recruitment Agency Financial Model Excel Template
The Recruiting Agency Financial Model helps founders, agency owners, consultants, and analysts build... Read more
Bookkeeping Agency Financial Model Excel Template
The Accounting Firm Financial Model Template helps founders, practice owners, consultants, analysts,... Read more
You must log in to submit a review.