
0 ITEMS

Dermatology Center Financial Model Excel Template
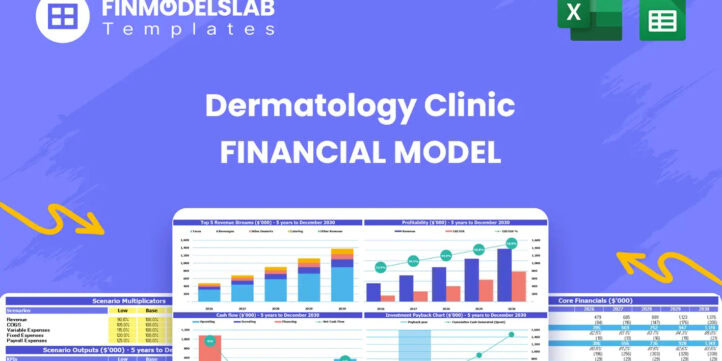
The Dermatology Clinic Financial Model Financial Model Template helps users turn a dermatology practice concept into a structured five-year financial forecast. It is designed to support planning for a clinic that may offer dermatologist consultations, procedures, physician assistant services, nurse treatments, medical aesthetician services, laser treatments, cosmetic dermatology, and other patient-driven revenue streams. Instead of building complex spreadsheets from scratch, users can work from a ready-made model that connects revenue assumptions, startup costs, payroll, operating expenses, cash flow, profitability, and investment returns in one organized planning tool. This template is useful for entrepreneurs, clinic founders, dermatologists, business owners, consultants, analysts, and anyone preparing a business plan, investor presentation, loan application, or internal feasibility study. It gives users a practical way to estimate how many practitioners are needed, how much capacity the clinic can handle, what average treatment pricing may look like, and how utilization rates affect revenue. It also helps organize the cost side of the business, including medical supplies, marketing, rent, administration, technology, staffing, build-out, equipment, and other costs that can significantly affect profitability. The model is built for financial planning and decision-making, with editable assumptions that allow users to test different operating strategies before committing capital. Users can adjust revenue drivers, payroll plans, operating expenses, funding needs, and growth assumptions to see how the clinic may perform under realistic conditions. By reviewing projected profit and loss, cash flow, break-even analysis, and key performance indicators, users can better understand whether the business can reach sustainable profitability and how much working capital may be required along the way. For funding preparation, the Dermatology Clinic Financial Model provides a professional structure that helps communicate the economics of the business clearly to investors, lenders, partners, and stakeholders. It supports scenario planning, visual reporting, and financial statement outputs so users can explain not only the expected results, but also the assumptions behind them. Whether used for a new clinic launch, an expansion plan, or a strategic review of an existing practice, this financial model template helps replace guesswork with a more disciplined, editable, and presentation-ready financial forecast.


Financial Model Overview
The Dermatology Clinic Financial Model Financial Model Template gives entrepreneurs, dermatology practice owners, consultants, analysts, and funding teams a structured way to plan the financial future of a dermatology clinic. A clinic in this sector can have multiple revenue drivers, including medical dermatology visits, cosmetic procedures, laser treatments, physician assistant services, nurse-led treatments, aesthetician services, retail product sales, and recurring patient demand. At the same time, the cost structure can be complex because the business may require medical equipment, clinic build-out, licensed staff, clinical supplies, marketing, insurance, technology, and ongoing working capital. This template brings those assumptions into one editable planning framework so users can estimate revenue, costs, cash flow, profitability, startup investment, and investor returns without starting from a blank spreadsheet. It is designed to support business planning, loan applications, investor discussions, internal budgeting, and strategic decision-making by translating operating assumptions into professional financial outputs over a multi-year forecast period.
All-in-One Dashboard
The all-in-one dashboard is the central control area of the Dermatology Clinic Financial Model, bringing core inputs and core outputs into one practical view. This component helps users quickly understand the overall financial position of the clinic by connecting key assumptions such as practitioner count, treatment capacity, utilization rates, pricing, direct costs, payroll, startup investment, and growth expectations with the resulting revenue, expenses, EBITDA, cash balance, and investment metrics. For a dermatology clinic, this is especially useful because small changes in utilization, appointment volume, or average treatment price can materially affect profitability. The dashboard allows users to review the model without moving through every supporting schedule, making it easier to identify whether the business plan is financially realistic. It can help founders see if the clinic has enough patient demand to support its staffing plan, help consultants summarize the case for a client, and help investors or lenders quickly understand the financial logic behind the forecast. Because the dashboard is editable and linked to the model’s assumptions, it also supports fast updates when new information becomes available, such as revised equipment quotes, updated rent estimates, new staffing plans, or changes to the expected service mix.
Low, Base, and High Scenario Analysis
The low, base, and high scenario analysis component helps users evaluate how the dermatology clinic may perform under different market and operating conditions. A single forecast can be useful, but a medical practice launch often involves uncertainty around patient acquisition, practitioner productivity, treatment pricing, reimbursement timing, local competition, marketing effectiveness, and service mix. This section allows users to compare conservative, expected, and optimistic cases by adjusting assumptions such as patient utilization, treatment volume, pricing, operating expenses, staffing levels, growth rates, and cost percentages. The outputs show how changes in these assumptions affect revenue, profit, cash flow, break-even timing, and investor returns. This is valuable for decision-making because it helps users understand the downside risk before committing to a lease, hiring staff, purchasing expensive dermatology lasers, or raising capital. It also helps prepare for investor or lender questions by showing that the plan has been stress-tested rather than built around only one ideal outcome. For an established clinic considering expansion, scenario analysis can also help compare a slower ramp-up against a higher-growth strategy and determine how much cash reserve may be needed in each case.
Professional Charts
The professional charts component turns the financial model’s outputs into clear visual reports that are easier to interpret and present. Financial projections can become difficult to communicate when they are limited to spreadsheet rows and columns, especially for stakeholders who want to understand the story behind the numbers quickly. This section may visualize revenue growth, expense trends, EBITDA development, cash balance movement, profitability margins, revenue stream mix, and other major metrics over the forecast period. For a dermatology clinic, these visuals can help show how patient capacity, practitioner utilization, and service mix translate into financial performance over time. They are useful in investor presentations, bank meetings, partner discussions, board updates, and internal planning sessions because they make the model more accessible and presentation-ready. A founder can use charts to demonstrate how the clinic scales as practitioners become more productive, while a lender can use them to review whether projected cash flow appears sufficient to support repayment obligations. By providing visual outputs directly within the financial model template, this component reduces the need to manually rebuild graphs in separate presentation files and helps keep the story aligned with the underlying calculations.
ROE Components and DuPont Analysis
The ROE components and DuPont analysis section helps users understand the drivers behind return on equity rather than viewing profitability as a single headline number. Return on equity can be especially relevant when a dermatology clinic is funded by founder capital, investor equity, or a combination of equity and debt. This component breaks performance into the underlying factors that influence shareholder returns, such as profit margin, asset efficiency, and financial leverage. For a clinic, this can reveal whether returns are being driven mainly by strong operating margins, effective use of equipment and clinic space, or the financing structure used to support the launch. Inputs may include net income, revenue, assets, equity, debt levels, and other balance sheet items, while the outputs help users evaluate the quality and sustainability of the clinic’s returns. This is useful for investors who want to understand whether the business can generate attractive returns without relying on unrealistic leverage or overly aggressive revenue assumptions. It also helps clinic owners make better strategic decisions, such as whether to invest in additional treatment rooms, purchase new laser equipment, hire more providers, or improve margins by adjusting pricing and service mix. By including DuPont-style analysis, the model provides a deeper view of financial performance than a standard profit forecast alone.
Revenue Inputs
The revenue inputs section is one of the most important parts of the Dermatology Clinic Financial Model because it defines how the clinic generates income. This component allows users to build revenue assumptions around practical operating drivers such as the number of dermatologists, physician assistants, registered nurses, medical aestheticians, laser technicians, monthly treatment capacity, patient utilization rate, average treatment price, and expected growth over time. For a dermatology clinic, revenue is rarely a single line item. Different practitioner types may provide different services at different price points and capacity levels, so the model needs to reflect how the clinic actually operates. Users can adjust assumptions for each revenue stream to estimate monthly and annual sales, test the impact of increasing utilization, and determine whether the staffing plan is aligned with patient demand. This section is valuable because it connects clinical operations directly to financial performance. If a clinic plans to start with two dermatologists and add nurse-led aesthetic treatments later, the revenue inputs can show how that phased approach affects income. If the clinic wants to focus on higher-margin cosmetic services, users can adjust the service mix and pricing assumptions to evaluate the financial impact. This makes the model practical for both launch planning and ongoing growth strategy.
Bank-Ready Reports
The bank-ready reports component provides lender-friendly financial outputs that help users present the dermatology clinic’s financial plan in a clear and credible format. When applying for a loan, line of credit, equipment financing, or working capital facility, lenders typically want to review revenue forecasts, profit and loss projections, cash flow, balance sheet assumptions, debt service capacity, funding needs, and repayment ability. This section organizes the model’s results into professional reports that can support those discussions. For a dermatology clinic, bank-ready reporting is especially useful because the upfront investment can be significant, with costs related to clinic build-out, exam rooms, diagnostic tools, dermatology lasers, furnishings, technology systems, and initial operating reserves. The reports help show how the requested funding will be used and whether the clinic’s projected operations can support ongoing expenses and debt obligations. Inputs from the operating forecast, capital expenditure plan, payroll schedule, and financing assumptions flow into the outputs, creating a more complete view of the business case. This component can also help founders prepare for questions from lenders about cash flow timing, profitability ramp-up, fixed cost coverage, and sensitivity to lower patient volume. By presenting outputs in a structured format, the template helps users move from rough estimates to a more professional financial package.
Revenue Breakdown
The revenue breakdown section gives users a detailed view of how total clinic revenue is distributed across different services, practitioner types, or revenue streams. This matters because a dermatology clinic may combine medical and aesthetic services with very different pricing, cost, margin, capacity, and growth characteristics. Dermatologist consultations and procedures may behave differently from nurse treatments, laser services, aesthetician appointments, retail skincare products, or recurring cosmetic treatments. This component helps users see which revenue streams contribute most to total income and which areas may offer the strongest opportunity for growth. Inputs may include average pricing, monthly treatment capacity, utilization rates, service categories, practitioner schedules, and growth assumptions. Outputs may show monthly and annual revenue by stream, contribution by category, and changes in mix over time. This is useful for planning because it helps users avoid relying on one broad revenue assumption that hides the economics of the clinic. If a large share of revenue is expected from laser treatments, the clinic can evaluate whether it has enough equipment, staff capacity, and marketing support to achieve that target. If physician assistant services are expected to expand, the model can show how that shift affects overall revenue. This level of detail supports pricing decisions, staffing plans, marketing focus, and service line strategy.
KPI Dashboard and Performance Benchmarks
The KPI dashboard and performance benchmarks section helps users monitor the key metrics that determine whether the dermatology clinic is operating as planned. Rather than focusing only on total revenue or net profit, this component may track practical performance indicators such as patient volume, practitioner utilization, average treatment price, revenue per provider, EBITDA margin, cash balance, gross margin, payback period, return on equity, and other clinic-level financial metrics. The benchmark element helps users compare projections against reasonable performance expectations so the forecast does not exist in isolation. For a dermatology clinic, this can be extremely useful because operational performance and financial outcomes are closely linked. A clinic with strong pricing but low utilization may struggle to cover fixed costs, while a clinic with strong patient volume but poor expense control may miss profitability targets. The KPI dashboard gives users a way to identify these issues quickly and adjust assumptions before making decisions. It can support monthly management reviews, investor updates, loan monitoring, and internal planning meetings. By putting important metrics in one place, the template helps users see whether the business is on track, where performance is most sensitive, and which levers may improve profitability and cash flow. This makes the financial model more useful as a decision-making tool rather than only a one-time forecast.
Startup Costs and Capital Investment Planning
The startup costs and capital investment planning component helps users estimate the initial funding required to launch or expand a dermatology clinic. This section may include clinic build-out, renovation, exam room furnishings, dermatology lasers, diagnostic imaging equipment, medical devices, waiting area setup, technology systems, software, deposits, licenses, legal costs, pre-opening marketing, initial inventory, insurance, and working capital reserves. For a dermatology clinic, understanding these costs is essential because the business may require a substantial investment before it begins generating patient revenue. This component organizes one-time costs separately from recurring operating expenses so users can see the true funding requirement at launch. It can also help compare different startup strategies, such as opening with a smaller number of treatment rooms, leasing equipment instead of purchasing it, or delaying certain aesthetic services until the clinic has more patient demand. The outputs can feed into cash flow projections, funding requirements, lender reports, and investor return calculations. This is useful for budgeting because it reduces the risk of underestimating the cash needed to open the doors and operate through the early ramp-up period. It also supports funding discussions by showing exactly how capital will be allocated and why those investments are required to support the clinic’s revenue plan.
Break-Even Analysis
The break-even analysis component helps users identify when the dermatology clinic may cover its fixed and variable costs and begin generating profit. This section can use inputs such as treatment pricing, patient volume, provider capacity, cost of medical supplies, payroll, rent, marketing, insurance, administrative expenses, and other overhead costs to calculate the level of revenue or volume needed to reach break-even. For a dermatology clinic, this is a critical planning tool because the business may have meaningful fixed costs from the start, including lease payments, staff salaries, equipment expenses, and clinical overhead.
Similar ProductsOther customers were also interested in...

 HenrySheykin
Skin Care Financial Model Excel Template
The Skin Care Clinic Financial Model helps entrepreneurs, clinic owners, consultants, analysts, and ... Read more

Chiropractic Center Financial Model Excel Template
The Chiropractic Clinic Financial Model helps users turn a clinic concept, launch plan, or expansion... Read more

Spa Financial Model Excel Template
The Spa Financial Model helps entrepreneurs, spa owners, consultants, analysts, and business planner... Read more
Mental Health Center Financial Model Excel Templat...
The Mental Health Clinic Financial Model helps users build a structured financial forecast for a the... Read more
Drug Rehab Clinic Financial Model Excel Template
The Drug and Alcohol Rehab Center Financial Model helps users turn a treatment facility concept into... Read more

Orthopedic Center Financial Model Excel Template
The Orthopedic Clinic Financial Model helps users build a structured five-year forecast for a capita... Read more
Drug Treatment Center Financial Model Excel Templa...
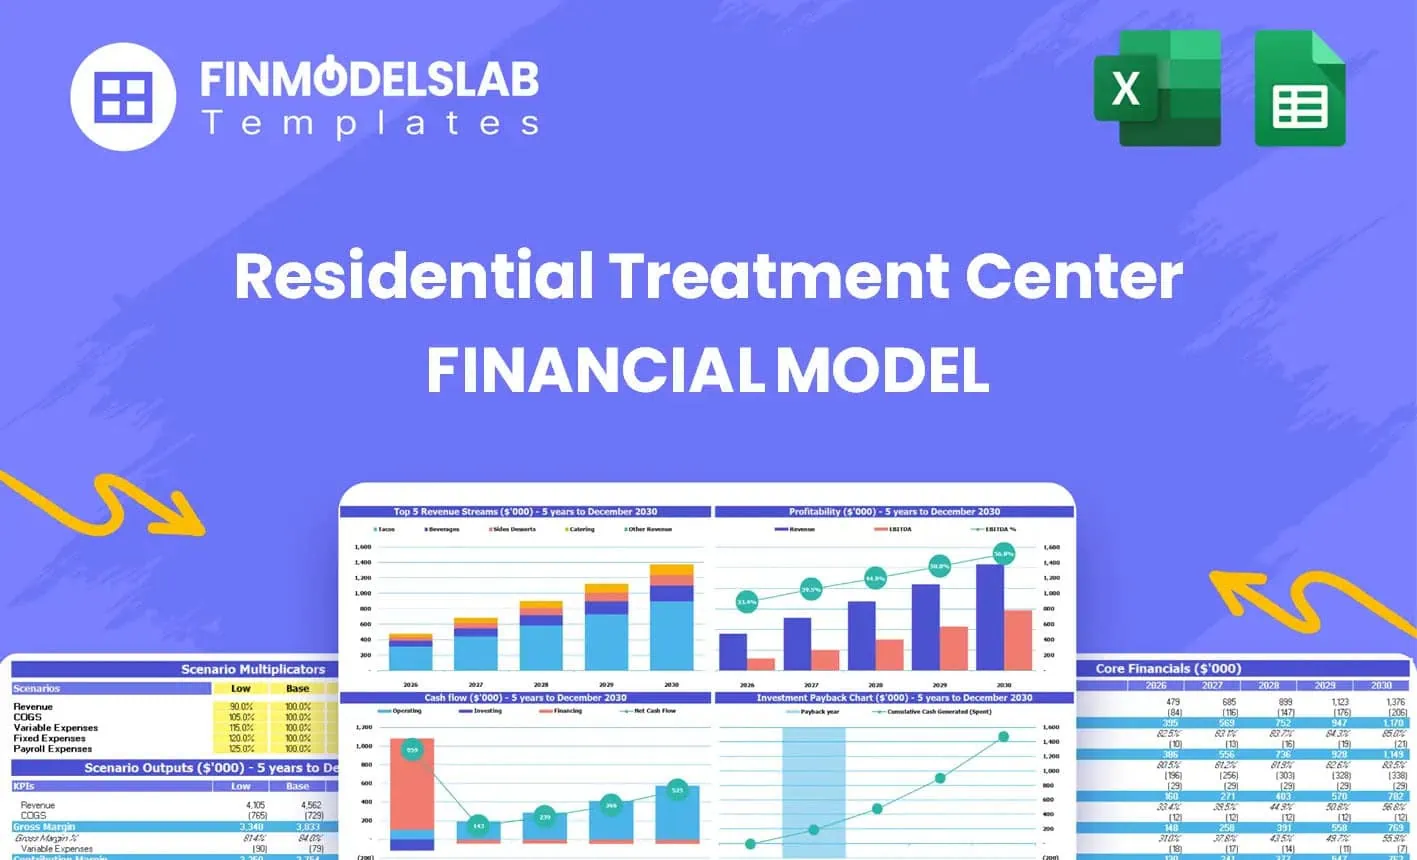
The Residential Treatment Center Financial Model helps users turn a live-in behavioral health, menta... Read more

Hypnotherapy Center Financial Model Excel Template
The Hypnotherapy Practice Financial Model helps users turn a wellness practice concept into a struct... Read more

Yoga Studio Financial Model Excel Template
The Yoga Studio Financial Model helps entrepreneurs, founders, studio owners, consultants, and finan... Read more

Weight Loss Center Financial Model Excel Template
The Weight Loss Center Financial Model helps entrepreneurs, clinic owners, consultants, and analysts... Read more
You must log in to submit a review.