CRM – Sales Pipeline Tracking
Two-way functionality for CRM analysis. This template offers you a stand-alone database building mechanism or you can import your raw sales pipeline data. From the database, monthly/quarterly (drop-down triggers) time-frames can be tracked so you see how your sales pipeline is changing over time.

| Financial Model, General Excel Financial Models |
| Customer Relationship Management (CRM), Excel, Sales Pipeline, Sales Tracking |
Video Tutorial:
This is designed to help any organization, regardless of size, be able to see what is going on with sales pipeline metrics over time as well as track salesmen’s performance. The following functionality is included:
1. Input card for database creation flexibility.
2. Fully monthly/quarterly analysis between added sales leads, won contracts, lost contracts (removal from leads), and ended contracts.
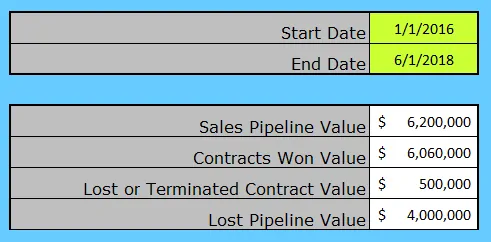
3. Dynamically enter any date range and see what the net effect of each pipeline metric was.
4. Visuals included for both salesmen assessment, net new pipeline/won contract value and an overall summary on the dashboard (annual).
5. View performance by customer over monthly/quarterly basis.
The goal here is to give virtually any business the ability to track their performance with lots of flexibility and vision. Essentially, you have a fully functional CRM all in one file.
Similar Products
Other customers were also interested in...
All My Financial Models, Spreadsheets, Templates, ...
Lifetime access to all future templates as well! Here is a set of spreadsheets that have some of the... Read more
Accounting Financial Model Bundle
This is a combined collection of Excel and Google Sheets financial model templates for Accounting an... Read more
Franchisor Licensing: Financial Model with Cap Tab...
Build up to a 10 year financial forecast with assumptions directly related to the startup and operat... Read more
Joint Venture and Fund Cash Flow Waterfall Templat...
Here are all the spreadsheets I've built that involve cash flow distributions between GP/LP. Include... Read more
Preferred Equity Cash Distribution Model – 2...
A 10-year joint venture model to plan out various scenarios for the way cash is shared between a GP ... Read more
Cost Segregation Study: Estimated Benefit Summary ...
This calculator has inputs for many different asset categories and their resulting recovery periods.... Read more
Investment Fund Preferred Return Tracker: Up to 30...
Track preferred returns for investors in a fund with this template. Premium joint venture tracking t... Read more
Cash Flow Waterfall with GP / Sponsor Catch-up Pro...
Offers logic to demonstrate the option to catch up the GP on their IRR after the LP earns their firs... Read more
Cumulative LP Distribution Joint Venture Waterfall...
A 6 Tier cash flow waterfall template. Plug in the distributable cash flow (+/-) and set the hurdle ... Read more
Investment Metrics to Compare Multiple Stocks / Cr...
A general set of models that come with explainers on how you derive various financial ratios from a ... Read more
You must log in to submit a review.


