
0 ITEMS

Car Accessories Shop Financial Model Excel Template
The Car Accessories Store Financial Model helps entrepreneurs, founders, consultants, analysts, and retail business owners plan a car accessories or automotive aftermarket store with a structured financial forecast. Instead of starting from a blank spreadsheet, users can work from a ready-to-use model designed around the economics of in-store traffic, product sales, repeat customers, inventory investment, payroll, operating expenses, and long-term profitability. It gives users a practical way to estimate revenue potential, understand startup costs, forecast cash flow, and evaluate whether the store can become financially sustainable. This financial model template is especially useful for people preparing a business plan, investor presentation, loan application, or internal budget for an auto accessories shop, car parts retail store, vehicle customization store, or automotive aftermarket concept. The template allows users to adjust key assumptions such as customer volume, conversion rate, product mix, pricing, gross margins, staffing, rent, marketing, and overhead. By linking these assumptions to financial statements and performance metrics, the model helps users see how operational decisions affect revenue, cash flow, profit, and funding needs over time. The model is built to support decision-making before launch, during fundraising, and throughout business growth. Users can test revenue assumptions, review operating expenses, estimate payroll requirements, analyze profitability, and understand when the business may reach break-even. It also helps identify periods when cash reserves may be tight, allowing owners to plan funding, credit lines, inventory purchases, and marketing spend more carefully. For a car accessories store, where upfront inventory, showroom setup, and customer acquisition can create pressure in the early years, this kind of structured planning is essential. Fully editable and compatible with Excel and Google Sheets, the Car Accessories Store Financial Model is designed for both financial and non-financial users. It provides organized assumptions, five-year projections, dashboard views, charts, scenario analysis, bank-ready outputs, and investor-focused reporting. Whether you are opening a new automotive retail shop, expanding an existing accessories business, or advising a client on funding and strategy, this template helps turn assumptions into a clear financial plan that supports smarter budgeting, profitability analysis, and confident business decisions.
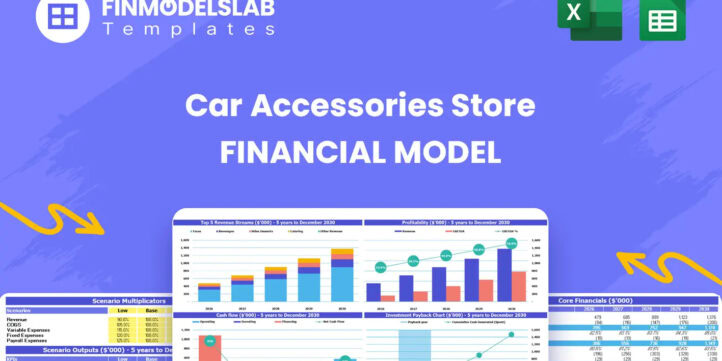


Financial Model Overview
The Car Accessories Store Financial Model is a ready-to-use financial model template built for planning, launching, funding, and managing an automotive aftermarket retail business. It helps users estimate how a car accessories store may perform by connecting key business assumptions such as visitor traffic, buyer conversion, product pricing, sales mix, inventory costs, staffing, rent, marketing, and overhead to a complete financial forecast.
For a business that depends on high-ticket products, repeat buyers, foot traffic, strong margins, and careful inventory management, a structured model is essential. This template gives entrepreneurs, business owners, consultants, analysts, and founders a practical framework for evaluating startup capital needs, revenue potential, cash flow requirements, profitability, and long-term growth. It is fully editable, compatible with Excel and Google Sheets, and designed to support business plans, funding discussions, lender submissions, investor presentations, and internal decision-making.
All-in-One Dashboard
The all-in-one dashboard brings the most important inputs and outputs of the Car Accessories Store Financial Model into one central view, giving users a fast way to understand the overall financial picture without moving through every worksheet manually. This section is useful because a car accessories store has many moving parts, including in-store traffic, product mix, average transaction value, gross margin, payroll, rent, marketing, inventory investment, and financing needs.
The dashboard can summarize key assumptions, projected revenue, cost structure, EBITDA, net profit, cash balance, return metrics, and other high-level outputs in a format that is easy to review. Users can update core assumptions and immediately see how changes affect the forecast, helping them compare different operating plans and make more informed decisions. For founders preparing a business plan or investor conversation, the dashboard acts as an executive summary of the financial model and helps communicate whether the store has a realistic path to growth and profitability.
Low, Base, and High Scenario Analysis
The low, base, and high scenario analysis allows users to test how the car accessories store may perform under different market and operational conditions. This component is especially valuable because retail performance can change significantly based on foot traffic, conversion rates, average order value, inventory availability, product margins, marketing effectiveness, and repeat customer behavior. The base case can represent the most realistic plan, while the low case may reflect slower customer acquisition, weaker conversion, higher expenses, or delayed profitability. The high case can model stronger demand, improved sales productivity, better margins, and faster growth.
By comparing these scenarios, users can understand the range of possible outcomes and identify which assumptions have the biggest impact on cash flow, profitability, and funding needs. This is useful for risk management, investor discussions, lender preparation, and internal planning because it shows that the business plan has been stress-tested rather than built around a single optimistic forecast.
Professional Charts
The professional charts component converts the financial forecast into clear visual reports that make revenue trends, profitability, cash flow, expense movement, and key performance metrics easier to understand. For a car accessories store, charts are useful because they can show the expected transition from early investment and cash burn to operating scale and stronger margins. Users can review visual summaries of monthly or annual revenue growth, gross profit, EBITDA, net income, cash balance, cost categories, funding needs, and other important outputs.
These charts help translate spreadsheet calculations into presentation-ready insights for investors, lenders, partners, and internal teams. They also make it easier for non-financial stakeholders to understand how the store is expected to grow over time, when pressure points may occur, and which areas deserve management attention. A strong visual reporting section saves time when preparing pitch decks, board updates, business plans, or strategy meetings because the core financial story is already organized and easy to explain.
ROE Components and DuPont Analysis
The ROE components and DuPont analysis section helps users evaluate return on equity by breaking performance into the underlying drivers of profitability, asset efficiency, and financial leverage. This is a valuable layer of analysis for a car accessories store because return performance is influenced not only by sales growth but also by margins, inventory usage, asset investment, debt structure, and operating efficiency. The model can help users understand how net profit margin, asset turnover, and leverage contribute to overall return on equity.
Inputs may include net income, revenue, total assets, equity, debt, and related financial statement outputs. The resulting analysis gives investors and business owners a more detailed view of what is driving returns and where improvements may be possible. For example, the store may improve ROE by increasing high-margin product sales, improving inventory turnover, controlling fixed costs, or optimizing the capital structure. This component is useful for strategic planning because it moves beyond a simple profit figure and helps explain the quality and efficiency of the business model.
Revenue Inputs
The revenue inputs section is where users define the commercial assumptions that drive sales in the Car Accessories Store Financial Model. A car accessories business may earn revenue from high-ticket items such as custom wheels, exhaust systems, lighting upgrades, electronics, performance accessories, floor mats, detailing products, and other aftermarket goods. The model can use assumptions such as daily visitor counts, conversion rates, average order value, product prices, sales volume, repeat purchase frequency, customer lifetime, and revenue growth rates.
These inputs are central to the forecast because even small changes in customer traffic or conversion can materially affect revenue, cash flow, and profitability. Users can customize the assumptions to match their location, target customer segment, marketing strategy, product categories, and store size. This section is especially useful when preparing a funding plan because it shows how projected revenue is built from operational drivers rather than unsupported top-down estimates. It helps users explain where sales are expected to come from and what needs to happen operationally to achieve the forecast.
Bank-Ready Reports
The bank-ready reports section provides lender-friendly financial outputs that can support loan applications, credit line requests, equipment financing, or discussions with funding partners. A car accessories store may need outside capital for initial inventory, leasehold improvements, store fixtures, working capital, marketing, technology, delivery vehicles, and early operating losses. Lenders typically want to see a clear set of financial statements, repayment capacity, cash flow projections, profitability outlook, debt service ability, and assumptions behind the forecast.
This component helps organize the model into professional reports that are easier for banks and stakeholders to review. It may include projected income statements, cash flow statements, balance sheets, summary metrics, and funding-related outputs. The value of this section is that it helps users present a credible and structured financial case rather than a collection of disconnected estimates. For business owners seeking financing, bank-ready reporting can make the conversation more efficient and improve confidence that the financial plan has been prepared with the right level of detail.
Revenue Breakdown
The revenue breakdown section provides a detailed view of how total sales are generated across different product categories, customer types, or revenue streams. For a car accessories store, this is important because not all products contribute equally to revenue and profit. High-ticket items such as wheels, tires, audio systems, lighting kits, performance parts, and exhaust systems may generate significant sales per transaction, while lower-priced products such as mats, cleaners, trim accessories, chargers, and small add-ons may create volume and repeat purchases.
The model can help users separate revenue streams, compare category performance, analyze average selling prices, estimate units sold, and understand the mix between premium products and everyday accessories. This level of detail supports better purchasing decisions, margin planning, marketing priorities, and inventory budgeting. It also helps users see whether growth depends on a small number of high-value products or a broader base of recurring retail demand. For investors and lenders, the revenue breakdown makes the forecast more transparent and easier to validate.
KPI Dashboard
The KPI dashboard tracks the performance metrics that matter most for managing a car accessories store over time. Instead of focusing only on total revenue or net profit, this component helps users monitor the operational indicators behind financial performance. Useful KPIs may include visitor traffic, conversion rate, average order value, repeat purchase rate, gross margin, revenue per customer, payroll as a percentage of sales, marketing efficiency, inventory turnover, EBITDA margin, cash balance, and break-even progress.
By reviewing these metrics regularly, owners can identify whether the business is moving toward its plan or whether corrective action is needed. The KPI dashboard is useful for internal management, investor updates, advisor reviews, and performance benchmarking because it turns the financial model into a practical decision-making tool. For example, if revenue is below forecast, the dashboard can help determine whether the issue is low traffic, weak conversion, insufficient average transaction value, or poor repeat customer activity. This makes the template more useful than a static forecast because it supports ongoing performance management.
Startup Cost and Initial Investment Planning
The startup cost and initial investment planning section helps users estimate the capital required to open or prepare a car accessories store for operations. This component may include initial inventory stock, leasehold improvements, store fixtures, signage, point-of-sale systems, display units, licenses, deposits, delivery vehicle costs, launch marketing, professional fees, technology setup, insurance, and working capital reserves. For an automotive aftermarket retail store, startup costs can be significant because the business often needs enough inventory to look credible from day one while also investing in a physical space that attracts customers and supports product demonstrations.
This section helps users separate one-time pre-opening expenses from recurring operating costs, making it easier to understand how much funding is needed before revenue begins. It also supports more accurate discussions with investors, lenders, landlords, and partners by showing the specific uses of capital. A clear startup cost plan reduces the risk of underfunding the business and helps owners prepare for the early months when sales may still be ramping up.
Break-Even Analysis
The break-even analysis section helps users identify when the car accessories store is expected to cover its costs and begin generating sustainable profit. This component can evaluate the relationship between fixed expenses, gross margin, product sales, customer volume, average transaction value, and operating costs. For a retail startup, break-even timing is one of the most important planning questions because the business may require several months or years of investment before it reaches a stable profit position.
The model can help calculate the sales level or time period needed to cover payroll, rent, marketing, utilities, inventory-related costs, and other overhead. It can also show how changes in conversion rate, pricing, margins, or expense control may accelerate or delay profitability. This is useful for funding preparation because owners can estimate how much cash is needed to survive the pre-break-even period. It also supports operational planning by giving management a measurable target for sales, cost control, and customer acquisition. For entrepreneurs and investors, the break-even analysis provides a realistic view of the path from launch to financial sustainability.
File types:
Excel – Single-User: .xlsx
Excel – Multi-User: .xlsx
Free Demo – .xlsx
Similar ProductsOther customers were also interested in...

 HenrySheykin
Grocery Store Financial Model Excel Template
The Grocery Store Financial Model helps entrepreneurs, founders, consultants, analysts, and retail b... Read more
Coffee Shop Financial Model Excel Template
The Coffee Shop Financial Model helps entrepreneurs, founders, business owners, consultants, and ana... Read more
Online Clothing Store Financial Model Excel Templa...
The Online Clothing Store Financial Model helps founders, entrepreneurs, business owners, consultant... Read more
Spa Financial Model Excel Template
The Spa Financial Model helps entrepreneurs, spa owners, consultants, analysts, and business planner... Read more
Bar Financial Model Excel Template
The Bar Financial Model Financial Model Template helps entrepreneurs, bar owners, consultants, analy... Read more
Bakery Financial Model Excel Template
The Bakery Financial Model helps entrepreneurs, bakery owners, consultants, analysts, and business p... Read more
Pizzeria Financial Model Excel Template
The Pizza Restaurant Financial Model Template helps entrepreneurs, restaurant owners, consultants, a... Read more
Clothing Store Financial Model Excel Template
The Clothing Store Financial Model helps turn a retail apparel concept into a structured financial f... Read more
Bike Shop Financial Model Excel Template
The Bicycle Shop Financial Model helps entrepreneurs, business owners, consultants, analysts, and fo... Read more

Car Wash Service Financial Model Excel Template
The Car Wash Financial Model is a ready-to-use financial model template designed to help entrepreneu... Read more
You must log in to submit a review.