
0 ITEMS

Juice Bar Financial Model Excel Template
The Juice Bar Financial Model helps entrepreneurs, founders, consultants, analysts, and business owners turn a juice bar or beverage service concept into a structured financial forecast. Instead of starting with a blank spreadsheet, users can work from a ready-to-use model designed to organize revenue assumptions, startup costs, operating expenses, payroll, cash flow, profitability, and investor-facing outputs in one practical planning tool. It is suitable for a new juice bar, smoothie shop, mobile beverage concept, or an established business evaluating expansion, pricing changes, staffing needs, or funding requirements. This financial model template supports business planning by connecting the main commercial drivers of the business to projected financial results. Users can adjust assumptions such as customer volume, average order value, sales mix, product categories, cost of goods sold, staffing levels, fixed overhead, and capital investments. The model then helps translate those assumptions into revenue forecasts, profit and loss projections, cash flow planning, and key performance indicators. This makes it easier to understand whether the business can generate enough sales, cover its costs, maintain liquidity, and move toward sustainable profitability. The template is especially useful for preparing business plans, investor presentations, bank loan applications, internal budgets, and feasibility studies. It helps users explain how the business is expected to make money, what funding may be required before launch, how expenses may change as the business grows, and when the operation may reach break-even. By presenting financial assumptions and outputs in a clean, organized format, the Juice Bar Financial Model helps improve decision-making and gives stakeholders a clearer view of the opportunity, risks, and financial potential. Because the model is editable and compatible with Excel and Google Sheets, users can personalize it to their own market, menu, pricing, operating model, and growth strategy. Whether the goal is to validate an idea, secure funding, compare scenarios, or manage future performance, this template provides a practical foundation for financial planning without the time and cost of building a full model from scratch.
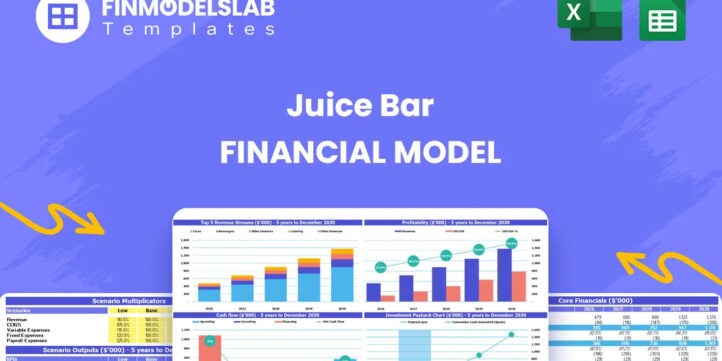


Financial Model Overview
The Juice Bar Financial Model is a ready-to-use financial model template built to help users plan, evaluate, and present the financial outlook of a juice bar, smoothie shop, mobile beverage service, or related beverage business. It brings together the major planning assumptions that affect financial performance, including customer volume, average order value, revenue mix, cost of goods sold, staffing, startup investment, operating expenses, cash flow, profitability, and investor returns. For entrepreneurs and founders, it provides a structured way to test whether a business idea is commercially viable before committing capital. For consultants, analysts, and business owners, it creates a practical framework for preparing business plans, funding documents, bank submissions, internal budgets, and expansion forecasts. The template is designed to save time while still allowing customization, so users can replace the prebuilt assumptions with their own pricing, capacity, cost structure, payroll plan, launch budget, and growth expectations. By turning operating assumptions into financial statements, charts, dashboards, and performance metrics, the model helps users make more informed decisions and communicate their plan clearly to investors, lenders, partners, and stakeholders.
All-in-One Dashboard
The all-in-one dashboard gives users a central view of the most important inputs and outputs in the Juice Bar Financial Model. Instead of navigating through multiple worksheets to understand the financial position of the business, users can review key assumptions, revenue expectations, cost behavior, profitability, cash flow, and investment metrics in one organized summary. This component is useful because juice bar planning often depends on several moving parts at once, such as daily customer traffic, weekday and weekend order values, product mix, staffing levels, ingredient costs, and fixed overhead. The dashboard helps connect those drivers to high-level results, including projected revenue, gross profit, EBITDA, net income, cash balance, payback period, and break-even timing. It is especially valuable for founders preparing investor conversations or lender meetings because it creates a concise overview of the business case. For internal decision-making, the dashboard also helps users quickly see whether adjustments to pricing, traffic, expenses, or capital investment are improving or weakening the overall forecast.
Low, Base, and High Scenario Analysis
The low, base, and high scenario analysis component helps users test how the juice bar may perform under different business conditions. A single forecast can create a false sense of certainty, so this section allows users to compare conservative, expected, and optimistic versions of the plan. Inputs may include lower or higher customer counts, changes in average order value, different revenue mix assumptions, increased ingredient costs, adjusted payroll needs, slower growth, stronger event bookings, or changes in fixed expenses. The outputs help users see how each scenario affects revenue, profitability, cash flow, funding needs, and the ability to cover operating costs. This is useful for planning because beverage businesses can be sensitive to location, seasonality, customer traffic, pricing strategy, and marketing effectiveness. Investors and lenders often want to know what happens if sales are below expectations, while founders need to understand the upside if the concept performs well. Scenario analysis supports more resilient decision-making by showing the financial impact of risk and opportunity before those situations occur.
Professional Charts
The professional charts component turns the financial forecast into visual reports that are easier to understand and present. Financial projections can be difficult to interpret when they are shown only as rows of numbers, so charts help communicate revenue growth, expense trends, gross margin, profitability, cash flow movement, and other key results at a glance. This component may draw from assumptions and outputs across the model, including sales forecasts, cost of goods sold, operating expenses, EBITDA, net income, cash balances, and cumulative investment returns. The resulting visuals are useful for business plans, pitch decks, funding discussions, board updates, and internal strategy reviews. For a juice bar or smoothie business, charts can help show how growth is expected to build over time, whether costs remain controlled as volume increases, and how quickly the business moves toward positive cash flow. Professional visual formatting also makes the model more stakeholder-friendly, helping non-financial readers understand the story behind the numbers without needing to review every formula or worksheet in detail.
ROE Components and DuPont Analysis
The ROE components and DuPont analysis section helps users understand the drivers behind return on equity rather than looking at one return metric in isolation. Return on equity shows how effectively the business generates profit from shareholder capital, but DuPont analysis breaks this result into underlying factors such as profitability, asset efficiency, and leverage. In a juice bar financial model, this can help users evaluate whether returns are coming from strong margins, efficient use of assets, or financing structure. Inputs and outputs may include net income, revenue, total assets, equity, debt levels, margins, asset turnover, and leverage ratios. This component is useful for investors because it provides a more analytical view of financial performance and helps explain why returns are improving or declining over the forecast period. It also helps business owners understand whether they should focus on increasing sales, improving cost control, making better use of equipment and facilities, or adjusting their financing strategy. By showing the components of ROE, the model supports deeper profitability analysis and more credible investment discussions.
Revenue Inputs
The revenue inputs section is where users define the commercial assumptions that drive the top line of the Juice Bar Financial Model. This may include the number of customers served per day or week, weekday versus weekend traffic, average order value, product categories, package pricing, add-on sales, event revenue, seasonal patterns, and expected growth over time. For a juice bar, these assumptions can be tailored to cold-pressed juices, smoothies, wellness shots, bowls, subscriptions, catering, mobile events, or premium beverage packages. The model uses these inputs to calculate monthly and annual revenue projections, helping users see how operational activity translates into financial results. This component is essential because revenue is one of the most sensitive parts of the forecast. Small changes in customer volume or average transaction size can significantly affect profitability and cash flow. By organizing revenue assumptions clearly, the template helps users build a more defensible forecast, test pricing strategies, compare sales channels, and align marketing goals with measurable financial outcomes.
Bank-Ready Reports
The bank-ready reports component provides lender-friendly financial outputs that help users present the business in a structured and professional format. Banks and financing partners typically want to see clear assumptions, projected income statements, cash flow forecasts, balance sheet expectations, startup funding needs, debt service capacity, and evidence that the business can support repayment obligations. This section helps organize the financial model into reports that are easier for lenders, investors, accountants, and advisors to review. Inputs may come from the revenue forecast, startup cost schedule, operating expense plan, payroll assumptions, financing structure, and cash flow projections. Outputs may include summarized financial statements, profitability metrics, liquidity measures, and key performance indicators. For a juice bar business seeking a loan, equipment financing, lease support, or working capital, this component can make the funding conversation more efficient and credible. It shows not only how much money may be required, but also how the business expects to generate enough cash to operate, grow, and meet financial obligations.
Revenue Breakdown
The revenue breakdown section gives users a detailed view of how different revenue streams contribute to total sales. A juice bar or beverage business may earn income from multiple sources, such as fresh juices, smoothies, wellness drinks, snacks, subscriptions, catering, mobile service, premium add-ons, bottled products, or event packages. This component helps users separate those streams and assign assumptions such as sales mix percentages, unit pricing, order volume, frequency, or growth rates. The model then calculates how each stream contributes to monthly and annual revenue, allowing users to identify which products or services are most important to the business plan. This is useful for pricing, menu design, inventory planning, marketing strategy, and profitability analysis. If one category has higher margins or stronger growth potential, the business can focus resources accordingly. If another category is volume-heavy but lower margin, users can assess whether it still supports the overall model. A clear revenue breakdown also helps investors and lenders understand how the business makes money beyond a single total sales figure.
KPI Dashboard
The KPI dashboard helps users monitor the performance metrics that matter most for a juice bar business. While financial statements show the overall results, key performance indicators help explain why those results occur. This section may track metrics such as average order value, customer volume, revenue per customer, gross margin, cost of goods sold percentage, labor cost percentage, EBITDA margin, net profit margin, cash balance, payback period, return on equity, and revenue growth. Users can compare these metrics over time and evaluate whether the business is operating efficiently. This is especially useful for benchmarking performance, setting targets, and identifying areas that need management attention. For example, if revenue is growing but margins are declining, the KPI dashboard may point to rising ingredient costs, discounting, or staffing inefficiencies. If cash flow is tightening despite profitable sales, users can review working capital assumptions or capital spending. By translating detailed financial data into practical performance measures, the KPI dashboard supports faster decision-making and more disciplined business management.
Startup Costs and Capital Expenditure Planning
The startup costs and capital expenditure planning component helps users estimate the funding required before the juice bar begins operating or expands into a new location or service model. This section may include lease deposits, renovation, store build-out, mobile vehicle purchase or customization, juicing and blending equipment, refrigeration, point-of-sale systems, signage, licenses, permits, initial inventory, packaging, furniture, professional fees, pre-opening marketing, and working capital reserves. Users can customize these inputs to reflect their specific concept, whether they are opening a storefront juice bar, launching a smoothie kiosk, adding a mobile beverage unit, or expanding an existing brand. The model uses these assumptions to estimate total launch investment and connect startup spending to cash flow and funding requirements. This is useful because underestimating startup costs can create liquidity pressure early in the business. A clear capital expenditure plan helps founders raise the right amount of money, avoid unnecessary debt, prioritize essential purchases, and explain the use of funds to investors, banks, or partners.
Break-Even Analysis
The break-even analysis component helps users identify when the juice bar is expected to cover its fixed and variable costs and begin generating profit. This section typically draws from revenue assumptions, average order value, sales mix, cost of goods sold, variable labor, payment processing fees, rent, utilities, payroll, marketing, insurance, software, and other recurring expenses. The model can estimate the revenue level, customer volume, or month in which the business reaches break-even. This is one of the most important planning outputs because it gives founders and funders a clear milestone for financial sustainability. For a juice bar, break-even can be influenced by pricing, product margins, traffic levels, operating hours, staffing efficiency, and the balance between fixed overhead and variable costs. Users can adjust assumptions to see how faster customer growth, higher-margin add-ons, lower ingredient costs, or tighter expense control affect the break-even point. This component supports budgeting, launch planning, funding preparation, and day-to-day decision-making by showing the sales target required to move from operating risk toward profitability.
File types:
Excel – Single-User: .xlsx
Excel – Multi-User: .xlsx
Similar ProductsOther customers were also interested in...

 HenrySheykin
Karaoke Bar Business Plan Financial Model Excel Te...
The Karaoke Bar Financial Model helps entrepreneurs, business owners, consultants, founders, and ana... Read more
All Day Bar & Restaurant Financial Model Excel...
The All-Day Restaurant Financial Model helps users turn a food and beverage concept into a structure... Read more
Tea Cafe Financial Model Excel Template
The Tea Room Financial Model helps entrepreneurs, operators, consultants, and business planners turn... Read more
Bar Financial Model Excel Template
The Bar Financial Model Financial Model Template helps entrepreneurs, bar owners, consultants, analy... Read more
Coffee Shop Financial Model Excel Template
The Coffee Shop Financial Model helps entrepreneurs, founders, business owners, consultants, and ana... Read more
Liquor Store Financial Model Excel Template
The Liquor Store Financial Model helps entrepreneurs, store owners, consultants, analysts, and busin... Read more

Cigar Lounge Financial Model Excel Template
The Cigar Lounge Financial Model helps entrepreneurs, business owners, consultants, analysts, and fo... Read more
Gourmet Food Store Financial Model Excel Template
The Gourmet Food Store Financial Model helps entrepreneurs, founders, business owners, consultants, ... Read more
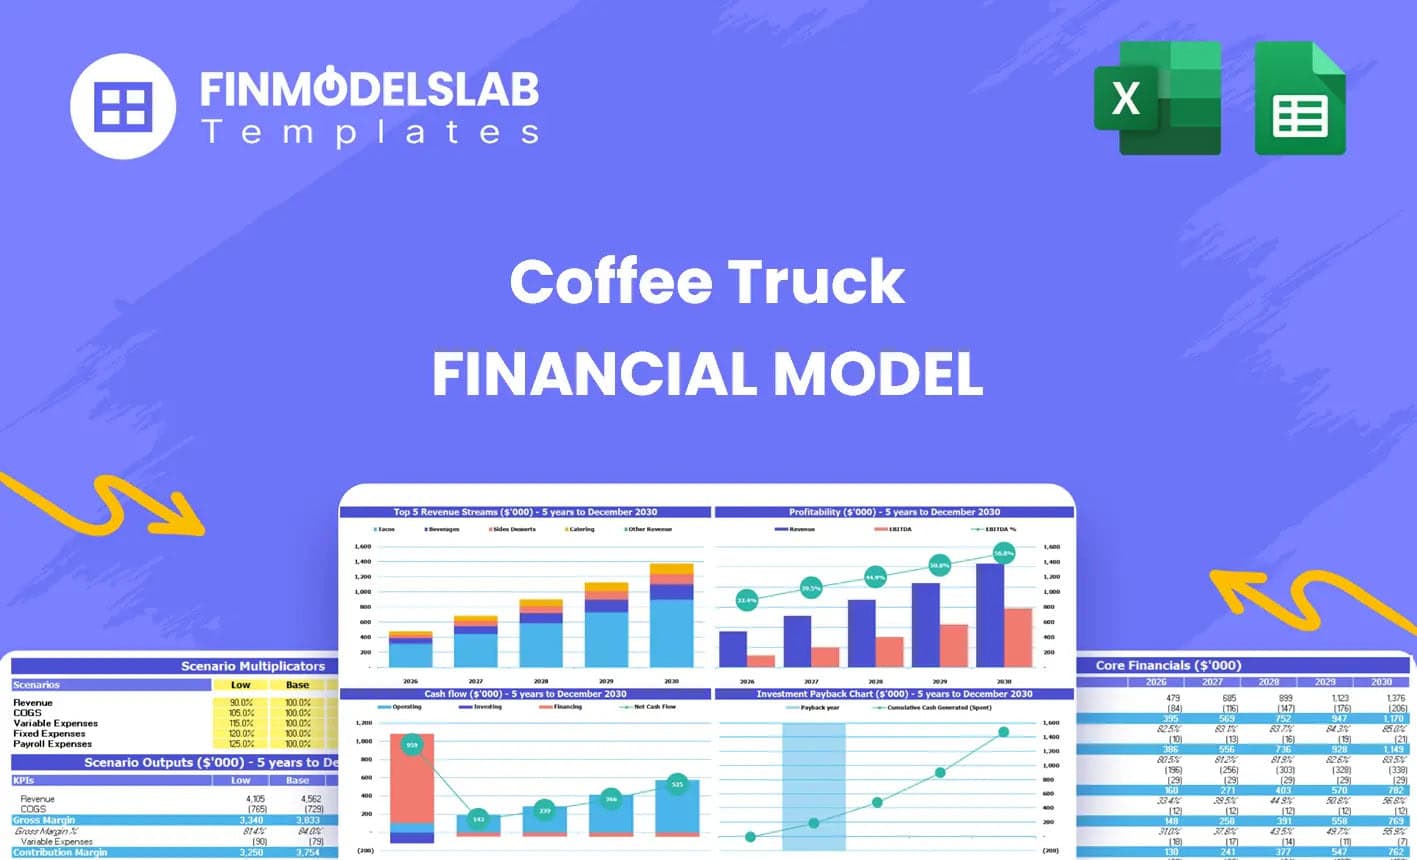
Coffee Truck Financial Model Excel Template
The Coffee Truck Financial Model Template helps entrepreneurs, founders, consultants, and business p... Read more

Wine Bar Financial Model Excel Template
The Wine Bar Financial Model helps entrepreneurs, founders, consultants, analysts, and hospitality b... Read more
You must log in to submit a review.