
0 ITEMS

Pizzeria Financial Model Excel Template
The Pizza Restaurant Financial Model Template helps entrepreneurs, restaurant owners, consultants, analysts, and founders turn a pizza restaurant concept into a structured financial forecast. Instead of building a spreadsheet from scratch, users can work from a ready-made model designed around the operating realities of a pizza business, including customer traffic, average order value, food costs, labor, rent, startup investment, and cash flow timing. The template supports financial planning for new restaurant launches, expansion decisions, funding applications, lender discussions, and internal budgeting. This model gives users a practical way to estimate how the restaurant may perform over time under realistic assumptions. Revenue assumptions can be shaped around midweek and weekend demand, product mix, customer volume, and average check size, while cost sections help organize startup costs, operating expenses, payroll, food ingredients, and other recurring restaurant overhead. By connecting revenue drivers with expenses and profitability outputs, the template helps users see whether the business can support its cost structure, reach break-even, and generate sustainable profit. The Pizza Restaurant Financial Model is useful for preparing business plans, investor presentations, loan applications, and management forecasts. It includes financial outputs that stakeholders typically expect to review, such as profit and loss projections, cash flow forecasts, performance metrics, profitability analysis, and visual summaries. Users can adjust assumptions to reflect their own menu strategy, seating capacity, location, pricing, staffing plan, supplier costs, and growth expectations, making the model flexible for different pizza restaurant formats. For decision-making, the template helps users test different outcomes before committing capital. You can compare conservative, base, and high-growth assumptions, review how changes in traffic or average order value affect profitability, and assess whether the opening budget is sufficient. With editable inputs, built-in calculations, dashboard views, and investor-ready formatting, this financial model template gives buyers a clearer view of funding needs, cash flow dynamics, break-even timing, and long-term financial potential.
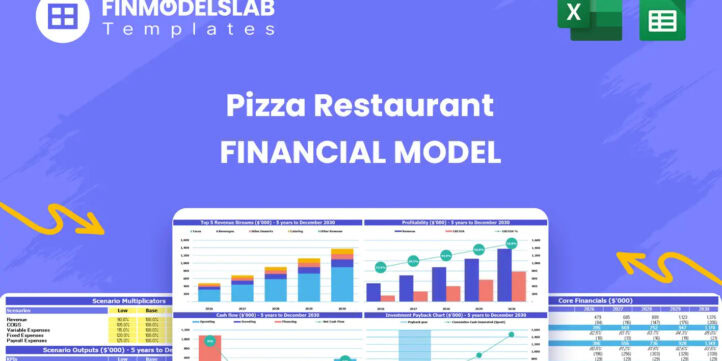


Financial Model Overview
The Pizza Restaurant Financial Model Template is a ready-to-use planning tool designed to help entrepreneurs, restaurant operators, consultants, analysts, and business plan writers evaluate the financial potential of a pizza restaurant before launch, expansion, or funding discussions. A pizza business depends on a mix of daily customer traffic, average check size, menu pricing, food costs, labor scheduling, rent, equipment investment, and working capital management, and this template brings those assumptions into one structured model. Users can customize the inputs to reflect their own concept, whether they are planning a dine-in pizzeria, a quick-service location, a delivery-focused restaurant, a drive-thru format, or a hybrid model. The template helps estimate startup costs, revenue, operating expenses, profitability, cash flow, funding needs, and key investor metrics over a multi-year forecast period. It is especially useful for preparing lender packages, investor presentations, business plans, internal budgets, and decision-making reports because it translates operational assumptions into financial statements and clear performance indicators.
All-in-One Dashboard
The all-in-one dashboard gives users a central view of the core inputs and core outputs of the Pizza Restaurant Financial Model. Instead of moving between disconnected sheets to understand the business, users can review the main assumptions, forecast results, financial summaries, and performance indicators in one place. Typical inputs may include opening date, customer traffic, average check value, menu mix, cost of goods sold, staffing assumptions, rent, startup investment, and financing structure. The outputs help summarize expected revenue, gross profit, EBITDA, cash balance, payback timing, and other key metrics that matter to owners, lenders, and investors. For a pizza restaurant, this is useful because many decisions are connected. A change in weekend covers, delivery demand, food cost percentage, or labor scheduling can quickly affect margin and cash flow. The dashboard helps users see the financial impact of those assumptions without manually rebuilding formulas, making it a practical control center for planning, reviewing, and presenting the business model.
Low Base High Scenario Analysis
The Low Base High scenario analysis section helps users compare multiple versions of the pizza restaurant forecast under different operating conditions. A restaurant plan rarely performs exactly as expected, so this component allows users to test conservative, expected, and optimistic assumptions for customer volume, average order value, revenue growth, cost inflation, food costs, labor efficiency, and other key drivers. The low case can be used to understand what happens if foot traffic is slower, delivery demand is weaker, or opening momentum takes longer than planned. The base case can reflect the most realistic operating plan, while the high case can show the upside if marketing works well, repeat customers grow quickly, or average check size increases through upselling. The outputs help compare revenue, profit margins, cash flow, and funding needs across scenarios. This is useful for planning because it gives entrepreneurs and stakeholders a clearer view of risk, financial guardrails, and the assumptions that have the greatest impact on results.
Professional Charts
The professional charts section turns the financial model’s calculations into visual reports that are easier to review, explain, and present. Pizza restaurant financial planning involves many moving parts, including monthly revenue growth, food and beverage mix, operating expenses, payroll, cash flow, profitability, and returns. Charts help simplify these outputs by showing trends, comparisons, and performance movement over time. Users can use this component to visualize projected sales, gross profit, EBITDA, net income, cash balance, revenue by stream, cost structure, and other key indicators. These visuals are especially useful when preparing investor decks, lender presentations, board updates, or internal management discussions because they make the model more accessible to people who do not want to review every spreadsheet line. For the business owner, charts can also highlight patterns that might otherwise be missed, such as margin compression, seasonal demand changes, rising labor costs, or improving cash generation. This helps support faster and more confident decision-making.
ROE Components and DuPont Analysis
The ROE components and DuPont analysis section helps users evaluate return on equity by breaking performance into the drivers behind investor returns. Instead of looking only at a final return figure, this component helps explain how profitability, asset efficiency, and financial structure contribute to overall return on equity. Inputs may include net income, revenue, total assets, equity investment, retained earnings, debt levels, and balance sheet assumptions. Outputs can show return on equity, margin impact, asset turnover, leverage effect, and related financial performance indicators. For a pizza restaurant seeking outside capital, this is useful because investors may want to understand not only whether the business is profitable, but also how effectively the restaurant converts invested capital into returns. It helps users explain whether returns are being driven by strong operating margins, efficient use of equipment and build-out investment, revenue growth, or financing structure. This makes the model more credible for investor conversations and helps founders understand the quality of projected returns.
Revenue Inputs
The revenue inputs section is where users build the commercial foundation of the pizza restaurant forecast. This component focuses on the assumptions that determine how the restaurant makes money, such as daily customer count, midweek and weekend traffic, average check value, pricing, menu mix, dine-in sales, takeaway orders, delivery demand, beverages, sides, and other add-on purchases. For a pizza restaurant, separating traffic patterns is important because weekday demand and weekend demand often behave differently, and average order values may vary by channel or day type. Users can adjust the inputs to reflect their location, seating capacity, expected table turnover, delivery radius, local competition, marketing strategy, and menu positioning. The outputs generated from this section feed into monthly and annual revenue forecasts, gross sales projections, and profitability calculations. This is useful because revenue assumptions are often the most important part of the business plan. By documenting them clearly, users can test whether their expected volume and pricing are realistic enough to support rent, payroll, ingredients, and other operating expenses.
Bank-Ready Reports
The bank-ready reports section organizes the financial outputs in a format that is suitable for lenders, investors, and other stakeholders reviewing the pizza restaurant plan. Financing partners typically want to see more than a revenue estimate. They often review startup budget, income statement, cash flow, profitability, break-even point, repayment capacity, and key assumptions before making a decision. This component helps compile those outputs into clear summaries that can support loan applications, investor discussions, internal approvals, or business plan submissions. Inputs flow from the wider model, including revenue drivers, cost of goods sold, payroll, operating expenses, capital expenditures, funding sources, and financing terms. Outputs may include profit and loss projections, cash flow forecasts, EBITDA summaries, cash balances, margins, and investment metrics. For a pizza restaurant that requires kitchen equipment, leasehold improvements, initial inventory, deposits, and pre-opening capital, presenting clean financial reports can make the funding process more organized and professional. It helps users show that they understand both launch costs and operating performance.
Revenue Breakdown
The revenue breakdown section gives users a more detailed view of how total restaurant sales are generated across different revenue streams. Rather than relying on one broad revenue line, the model can separate sales by categories such as midweek customer sales, weekend customer sales, main meals, beverages, sides, add-ons, delivery, takeaway, dine-in traffic, or other sales channels depending on how the user customizes the model. Inputs may include customer volume by period, average spend by product type, expected product mix, pricing changes, and growth assumptions. Outputs help show the contribution of each stream to total revenue, allowing users to understand which areas drive the most sales and which may offer the highest margin potential. This is particularly useful for pizza restaurants because profitability may vary significantly between pizza sales, drinks, appetizers, desserts, and delivery orders. A clear breakdown helps users evaluate pricing strategy, promotional offers, menu design, and upselling opportunities. It also makes the revenue forecast easier to defend when presenting the plan to lenders or investors.
KPI Dashboard
The KPI dashboard tracks the performance metrics that help users evaluate whether the pizza restaurant is financially healthy and operating according to plan. This section can summarize key indicators such as revenue growth, gross margin, food cost percentage, labor cost percentage, EBITDA margin, net profit margin, cash balance, break-even timing, customer volume, average check size, payback period, and return metrics. Inputs come from the model’s assumptions and forecast calculations, while outputs are presented as concise performance measures that can be reviewed quickly. For a restaurant operator, these KPIs are useful because day-to-day sales can look strong even when margins are under pressure from ingredient costs, payroll inefficiencies, rent, delivery platform fees, or discounting. The KPI dashboard helps users monitor the relationship between sales and profitability, compare projections against industry benchmarks, and identify areas that need attention. For stakeholders, it provides a simple way to understand the financial story of the business without reviewing every calculation in the model.
Startup Cost Breakdown
The startup cost breakdown section helps users estimate the initial investment required to open the pizza restaurant before revenue begins. A pizza concept often requires significant upfront spending, including kitchen equipment, ovens, refrigeration, prep stations, point-of-sale systems, leasehold improvements, furniture, signage, permits, deposits, opening inventory, professional fees, pre-launch marketing, staff training, and working capital reserves. This component allows users to list those costs in a structured way and adjust them based on location, restaurant size, service model, build-out needs, and supplier quotes. The outputs help estimate total funding required, cash needed at launch, and the amount that may need to be covered by owner investment, loans, or outside investors. This is useful for planning because underestimating startup costs can create cash pressure before the restaurant reaches stable sales volume. A detailed startup cost section also strengthens business plans and funding requests by showing lenders and investors exactly how the opening capital will be used and whether the launch budget is realistic.
Break-Even Analysis
The break-even analysis section helps users understand when the pizza restaurant may begin covering its costs and generating profit. This component uses assumptions from revenue, cost of goods sold, payroll, rent, utilities, marketing, operating expenses, and fixed costs to estimate the sales level or time period required to reach break-even. Inputs may include average check size, customer count, gross margin, food cost percentage, labor cost structure, fixed monthly expenses, and startup timeline. Outputs can show the break-even month, required monthly revenue, required customer volume, and the relationship between margin and fixed cost coverage. For a pizza restaurant, break-even analysis is especially important because the business may have high fixed commitments such as rent, equipment financing, salaried management, and utilities, while profitability depends on consistent order volume and cost control. This section helps owners set realistic sales targets, evaluate whether marketing plans are strong enough, and communicate the path to profitability to funding partners. It also supports decision-making by showing how pricing, traffic, and cost changes can accelerate or delay profitability.
File types:
Excel – Single-User: .xlsx
Excel – Multi-User: .xlsx
Similar ProductsOther customers were also interested in...


 HenrySheykin
Food Truck Financial Model Excel Template
The Food Truck Financial Model helps entrepreneurs, founders, business owners, consultants, and anal... Read more
Gourmet Food Store Financial Model Excel Template
The Gourmet Food Store Financial Model helps entrepreneurs, founders, business owners, consultants, ... Read more
Confectionery Shop Financial Model Excel Template
The Confectionery Shop Financial Model helps turn a candy shop, sweet shop, dessert retail concept, ... Read more
 Pushkar
BAKERY – 3 Statement Financial Model with 5 ...
This Bakery Business Plan Model is a perfect tool for a financial feasibility study on launching a B... Read more
Bakery Financial Model Excel Template
The Bakery Financial Model helps entrepreneurs, bakery owners, consultants, analysts, and business p... Read more
Coffee Shop Financial Model Excel Template
The Coffee Shop Financial Model helps entrepreneurs, founders, business owners, consultants, and ana... Read more
Coffee Truck Financial Model Excel Template
The Coffee Truck Financial Model Template helps entrepreneurs, founders, consultants, and business p... Read more
Pizzeria – 3 Statement Financial Model with ...
This Pizzeria business Plan Model is a perfect tool for a financial feasibility study on launching a... Read more

 Giorgos
Pizzeria Financial Model – 5 Year Financial Fore...
Financial Model providing advanced financial planning & analysis for a Pizzeria business. Suitab... Read more
 Andreas
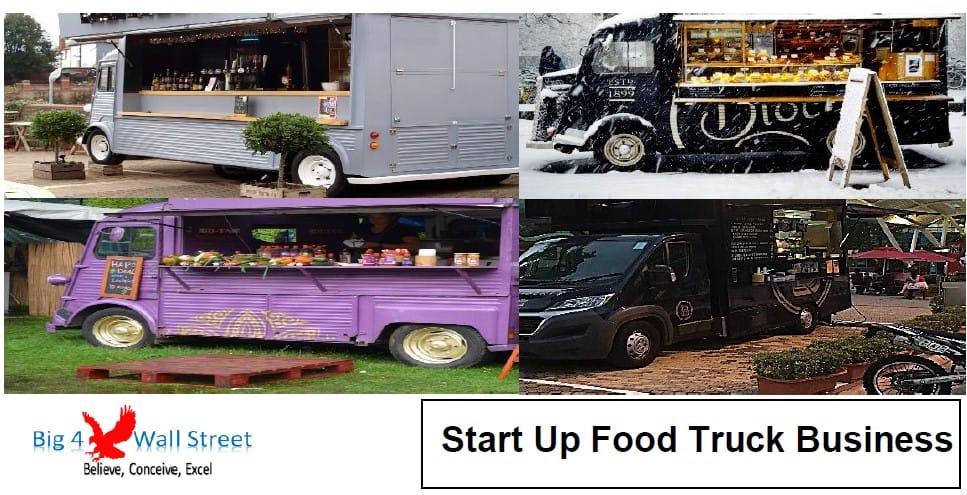
Start Up Food Truck Business Financial Model
Start Up Food Truck Business Financial Model presents the case of an investment in a food truck busi... Read more
You must log in to submit a review.