0 ITEMS

How to Build a Budget in Excel: A Step-by-Step Guide

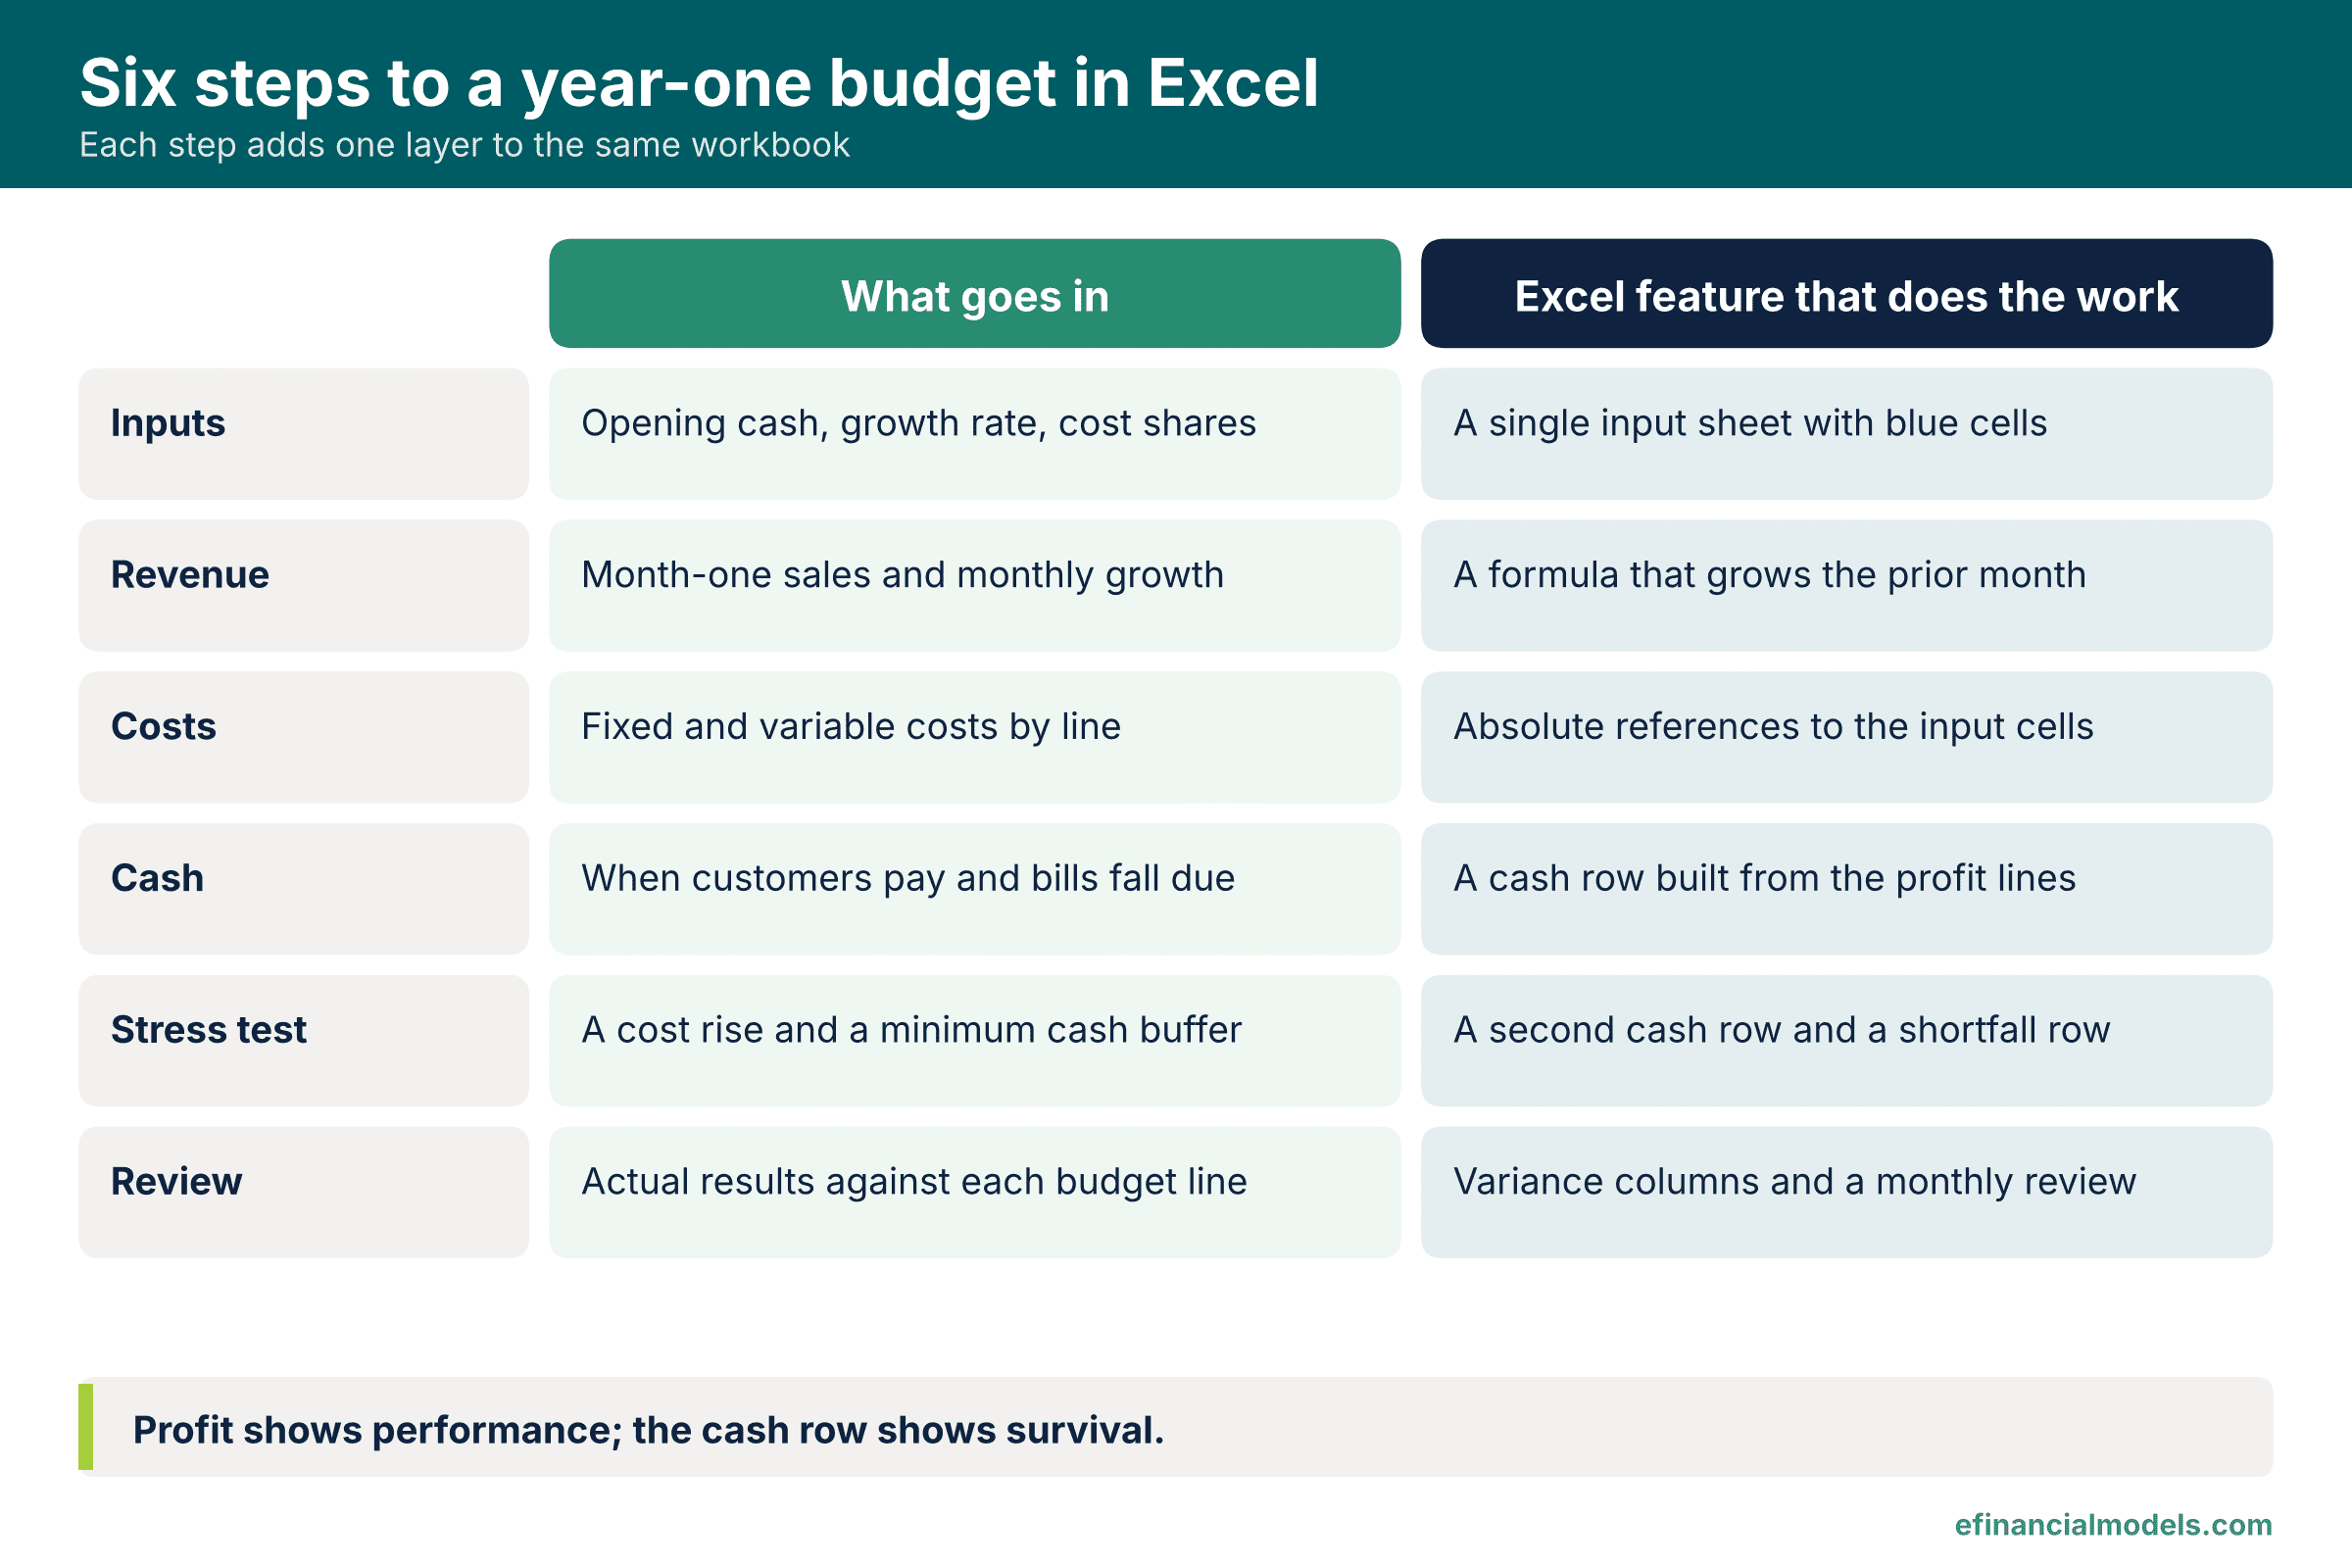
A budget in Excel is built in six steps: list the assumptions, forecast revenue, add costs, convert profit into cash, stress test the cash balance and review actual results each month. This guide follows one hypothetical services company through all six steps, and its cash row shows what a profit-only budget hides.
Key Takeaways
- Put every assumption on one Inputs sheet so a single changed cell updates the whole twelve-month budget.
- Forecast revenue month by month, then split costs into fixed lines and lines that move with revenue.
- A budget that shows profit but not cash can hide a shortfall: the hypothetical example earns USD 14,532 before tax yet cash falls.
- Stress test the cash row with a cost rise and a minimum balance, then act on the months that fall short.
- Compare actual results with budget every month and update a separate forecast before a gap becomes a crisis.
A Year-One Budget Exists to Show When Cash Runs Short
A budget is a month-by-month plan of expected revenue, costs and cash for the next twelve months. For a growth-stage small and medium-sized enterprise (SME), its main job is to show when the bank balance will be lowest, not only whether the year ends in profit.
In the Federal Reserve Banks’ Small Business Credit Survey, run in September to November 2024, 51% of responding firms with fewer than 500 employees cited uneven cash flows as a financial challenge, and 56% cited paying operating expenses (Federal Reserve Banks, 2025 report). The survey is a convenience sample of US employer firms, so the figures describe the respondents, not every business.
Survival data add context. The US Bureau of Labor Statistics reported in January 2024 that 34.7% of US private-sector business establishments born in March 2013 were still operating in March 2023 (Bureau of Labor Statistics, 2024). The figure counts establishments, not firms, and does not show that budgeting prevents closure.
Step 1: Put Every Assumption on One Inputs Sheet
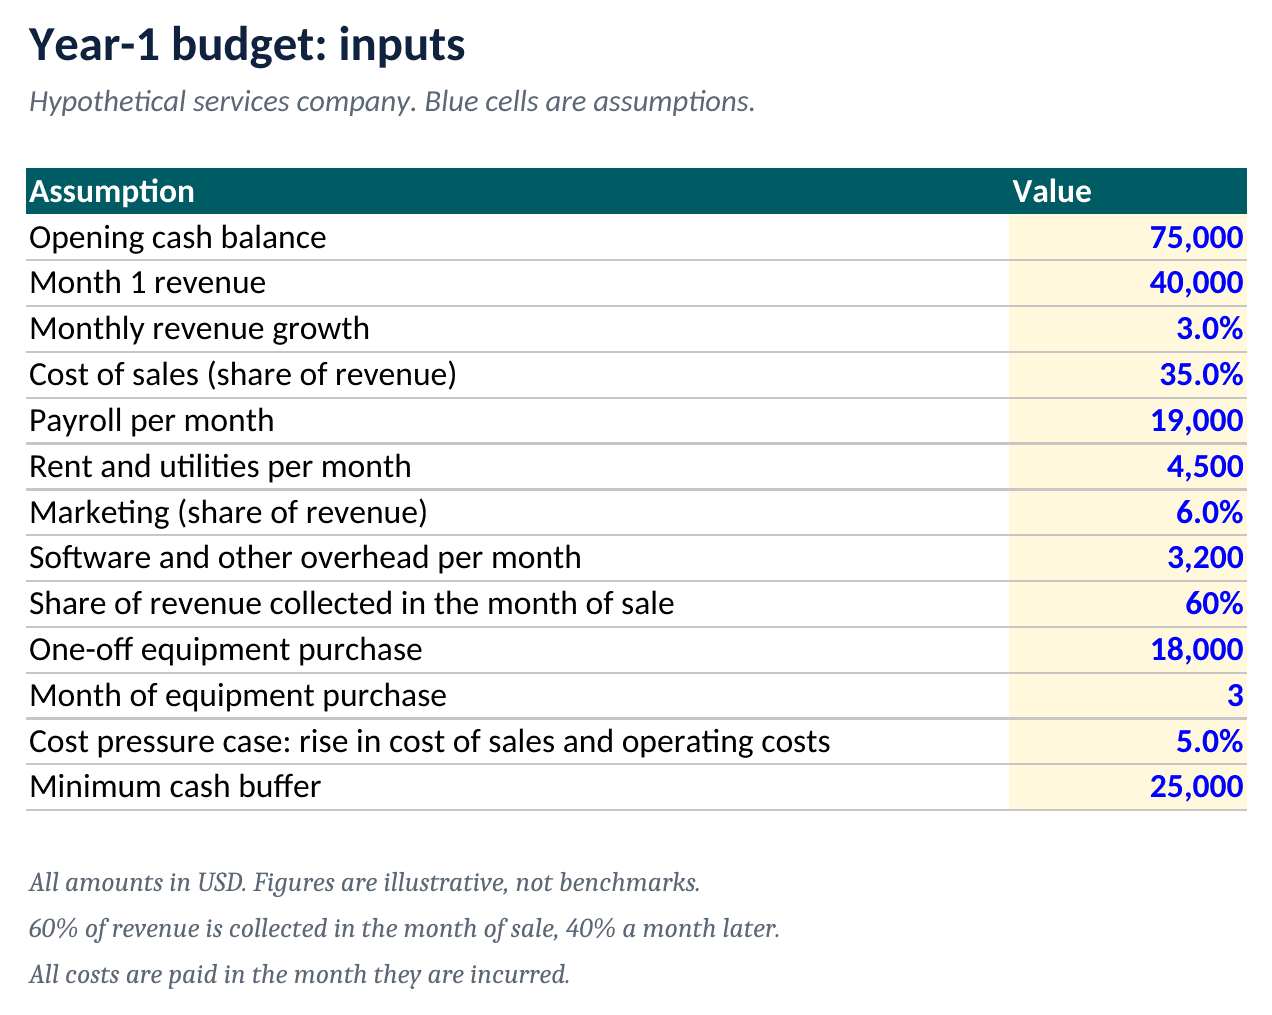
Create three sheets named Inputs, Calculation and Results. Every assumption goes into a blue cell on Inputs, and every formula elsewhere points to those cells with an absolute reference, a cell address locked with dollar signs so it stays fixed when the formula is copied across months.
Assume a hypothetical services company with USD 75,000 of opening cash and month-one revenue of USD 40,000 that grows 3.0% a month. Assume cost of sales, the direct cost of delivering the service, is 35.0% of revenue, payroll is USD 19,000 a month, rent and utilities are USD 4,500 and software is USD 3,200. Assume marketing is 6.0% of revenue, 60% of sales are collected in the month of sale and the rest the month after, and a USD 18,000 equipment purchase falls in month 3.
Product businesses need extra rows for inventory and supplier payment terms, which this example omits. Owners who prefer to start from a finished structure can browse the eFinancialModels budgeting templates.
Step 2: Forecast Revenue One Month At a Time
Month one takes its value from the Inputs sheet, and every later month equals the previous month multiplied by one plus the growth rate. The growth rate should come from contracts, the pipeline or last year’s trend; optimistic guesses belong in a separate scenario.
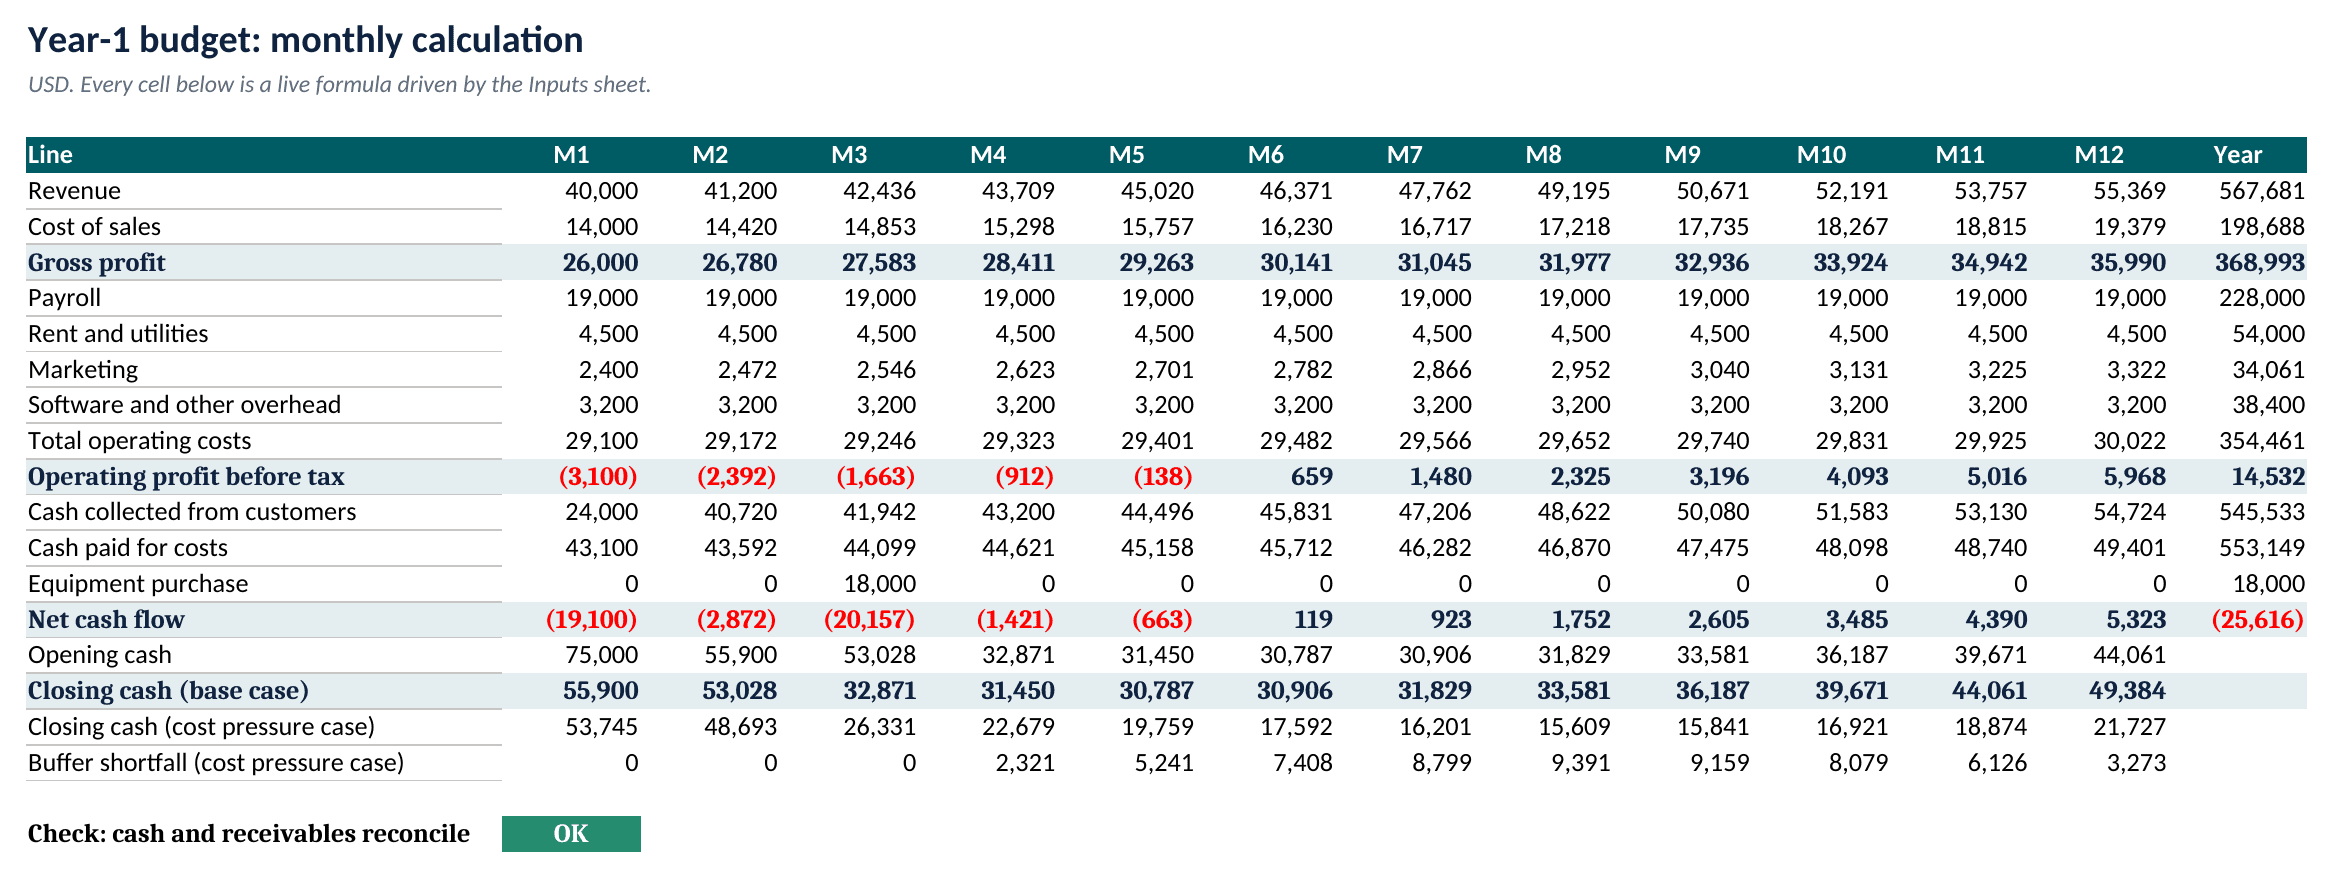
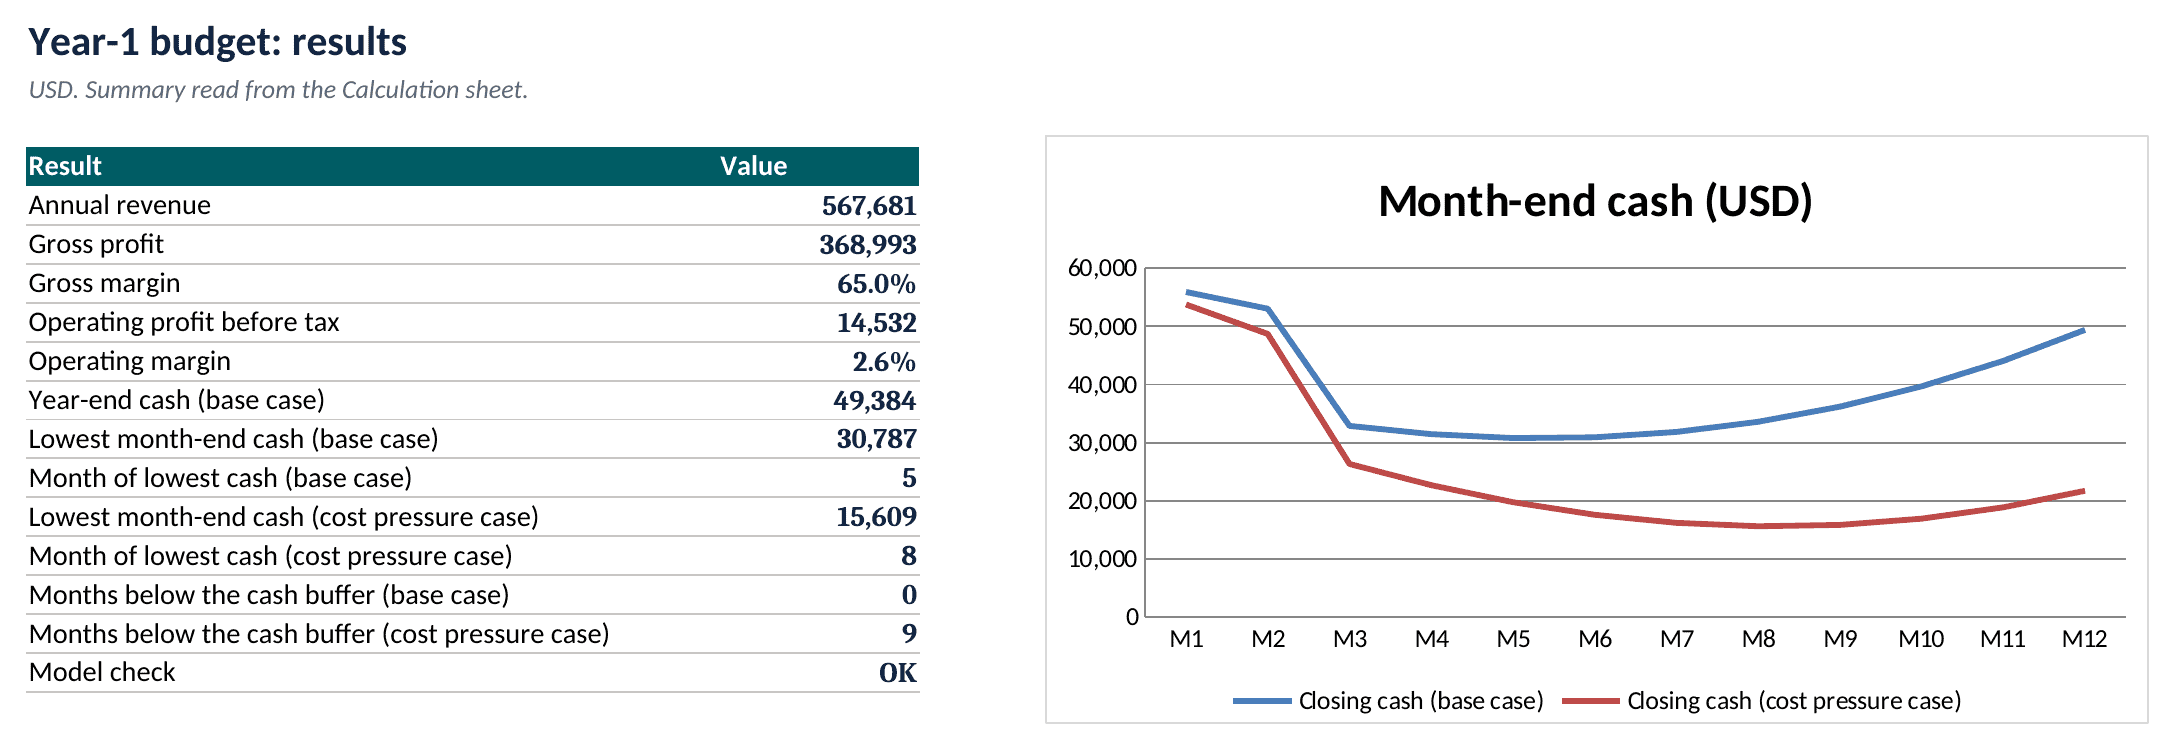
In this example, revenue starts at USD 40,000 in month 1 and grows 3.0% a month to reach USD 55,369 in month 12, which totals USD 567,681 for the year.
Step 3: Add Costs by How They Behave
Costs behave in two ways. Fixed costs such as payroll, rent and software stay the same each month, while variable costs such as cost of sales and marketing move with revenue, so each one needs its own formula row.
In this example, gross profit, which is revenue less cost of sales, is USD 368,993 for the year, a 65.0% margin. Operating costs total USD 354,461, leaving operating profit before tax of USD 14,532, or 2.6% of revenue, before depreciation on the equipment and before interest. Operating profit is negative in months 1 to 5 and turns positive from month 6 as revenue outgrows the fixed costs.
Step 4: Turn Profit Into Cash
Profit and cash are different numbers. Customers pay late, so each month’s cash collected equals the share of that month’s revenue paid at once plus the remaining share of the previous month’s revenue, and equipment is paid for in cash even though it is not an expense in operating profit. This example ignores depreciation and tax, assumes every cost is paid in the month it is incurred, and starts the year with no receivables or payables. The table below traces the base case month by month to year-end cash, using 60% of the month’s revenue plus 40% of the previous month’s.
| Month | Revenue | Operating profit | Cash collected | Net cash flow | Closing cash |
|---|---|---|---|---|---|
| 1 | 40,000 | -3,100 | 24,000 | -19,100 | 55,900 |
| 2 | 41,200 | -2,392 | 40,720 | -2,872 | 53,028 |
| 3 | 42,436 | -1,663 | 41,942 | -20,157 | 32,871 |
| 4 | 43,709 | -912 | 43,200 | -1,421 | 31,450 |
| 5 | 45,020 | -138 | 44,496 | -663 | 30,787 |
| 6 | 46,371 | 659 | 45,831 | 119 | 30,906 |
| 7 | 47,762 | 1,480 | 47,206 | 923 | 31,829 |
| 8 | 49,195 | 2,325 | 48,622 | 1,752 | 33,581 |
| 9 | 50,671 | 3,196 | 50,080 | 2,605 | 36,187 |
| 10 | 52,191 | 4,093 | 51,583 | 3,485 | 39,671 |
| 11 | 53,757 | 5,016 | 53,130 | 4,390 | 44,061 |
| 12 | 55,369 | 5,968 | 54,724 | 5,323 | 49,384 |
| Year | 567,681 | 14,532 | 545,533 | -25,616 | 49,384 |
The year looks profitable, yet cash falls by USD 25,616, from USD 75,000 at the start to USD 49,384 at year end. Two items explain the gap between profit and cash. First, USD 22,148 of month-12 revenue, which is 40% of USD 55,369, is still owed by customers. Second, the USD 18,000 equipment is paid up front. Operating profit of USD 14,532 less those two items gives a net cash flow of minus USD 25,616.
Step 5: Stress Test the Cash Balance Against a Buffer
A stress test reruns the budget with a harsher assumption and compares month-end cash with a minimum balance the owner is willing to hold. In this scenario, cost of sales and operating costs are 5.0% higher, the equipment price is unchanged and the buffer is USD 25,000. In Excel, one scenario input cell holds the 5.0% rise, a second cash row applies it, a minimum function finds the lowest balance and a count-if function counts the months below the buffer.
The base case never falls below the buffer, with its lowest month-end cash of USD 30,787 in month 5. The cost pressure case falls to USD 15,609 in month 8 and stays under the buffer for nine months, from month 4 to month 12, with a peak shortfall of USD 9,391.
The Federal Reserve Banks’ 2026 report, based on a survey fielded in September to November 2025, found that 77% of responding firms reported rising costs of goods, services or wages, tariff-related cost increases, or both (Federal Reserve Banks, 2026 report). The survey is a convenience sample of US employer firms, so the figure describes respondents and is not a forecast for any single business.
A shortfall is a prompt to test responses by changing inputs. Illustrative options include delaying the equipment purchase, collecting a larger share of sales at once, trimming marketing or arranging a credit line before it is needed.
Step 6: Review the Budget Against Actual Results Every Month
A budget only works if it is compared with reality. After each month closes, add an Actual column beside the budget and a Variance column that subtracts budget from actual, then investigate the largest gaps and record a revised forecast for the remaining months in a separate column, leaving the original budget unchanged as the yardstick.
Reviewing money in and money out each month shows whether profit is turning into cash, and one named person should own receivables, payables, cash, bank reconciliation and payroll. Variance templates are listed in the eFinancialModels category of general Excel financial models.
Frequently Asked Questions
How far ahead should a growth-stage business budget?
Twelve months, built monthly, is the usual starting point because it captures a full seasonal cycle and the timing of large payments. After the first quarter closes, many owners roll the budget forward so that twelve future months are always visible. Detail can thin out beyond the first year, with quarterly columns for years two and three, because assumptions that far ahead are less reliable.
What is the difference between a budget and a forecast?
A budget is the target the owner commits to at the start of the year, while a forecast is the current best estimate of where the numbers will land. The budget stays fixed so that variances can be measured against it. The forecast changes each month as actual results arrive, which lets the owner see early whether the target is still reachable.
Which Excel features reduce errors in a budget?
Three habits catch most mistakes. Keep inputs separate from formulas so nothing is typed over a calculation, apply data validation to input cells so a percentage cannot be entered as a whole number, and add a check cell that compares totals calculated two different ways. Colour coding and consistent row formulas across all twelve months make a broken formula easy to spot.
How often should the budget be updated?
Update actual results once a month, within a week of closing the books, so variances are still fresh enough to explain. Revisit the assumptions themselves only when something material changes, such as a lost customer, a price change or a new hire. Changing the budget every month defeats its purpose as a yardstick, so record each assumption change with a date and a reason, and keep the original budget unchanged for comparison.
When should an owner involve an accountant?
An accountant is worth consulting when the budget feeds a loan application, when tax planning affects the cash row, or when depreciation and equipment financing need correct treatment. The example in this guide is illustrative and ignores tax and depreciation, so a professional should review those lines, and the collection and payment timing, before the numbers are shown to a lender or investor.
Conclusion
A year-one budget comes from six habits: one Inputs sheet, a monthly revenue forecast, costs split by behaviour, a cash row built from profit, a stress test against a buffer and a monthly variance review. Growth-stage owners ready to put the six steps into practice can start from the free eFinancialModels Budget Planner Template in Excel for Services Businesses, which includes an inputs section, a yearly budget framework and a budget versus actual report.