
0 ITEMS

SaaS Financial Model Excel Template | 5-Year Forecast, 3-Statement Financials, MRR/ARR, Customer Cohorts & DCF Valuation
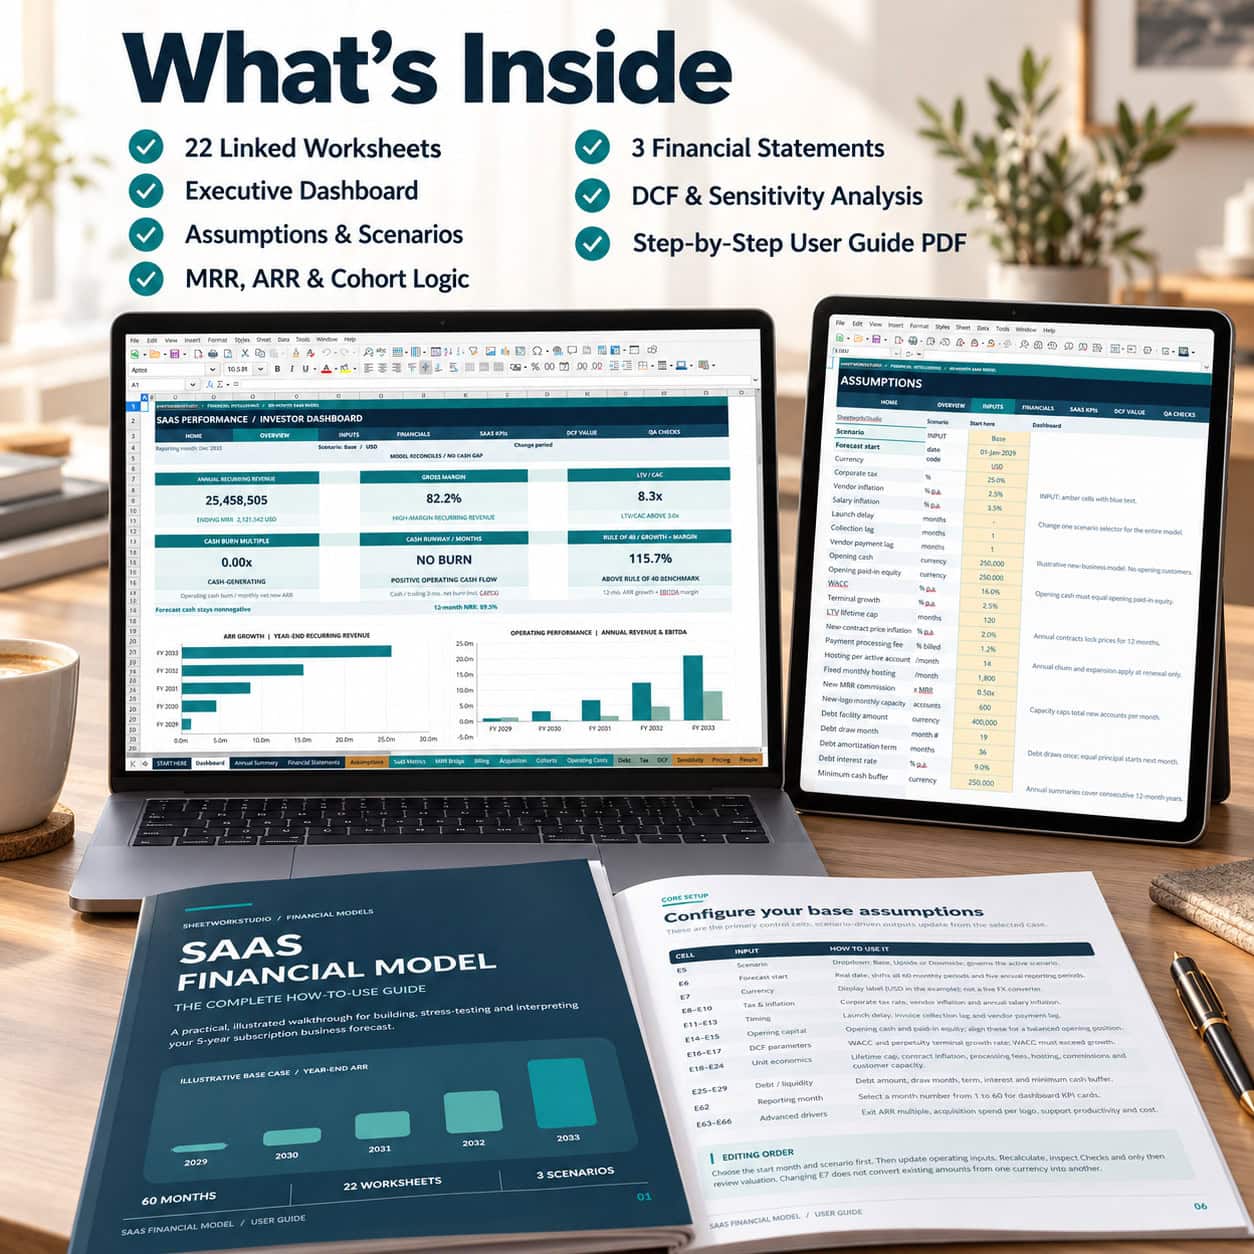
A comprehensive 5-year SaaS financial model with 60 monthly forecasts, 22 linked worksheets, customer cohort analysis, MRR/ARR forecasting, churn and retention, CAC/LTV unit economics, integrated 3-statement financials, cash runway analysis, DCF valuation and Base/Upside/Downside scenarios. Includes a professional executive dashboard, editable sample data and a detailed 26-page PDF user guide.
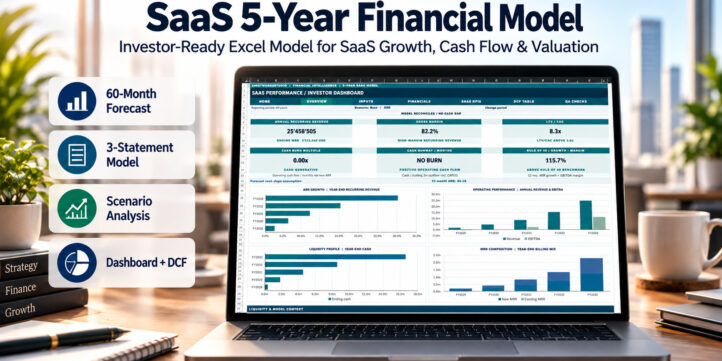

📊 SaaS 5-Year Financial Model – Financial Planning, Forecasting & Valuation
60-Month Forecast | 22 Linked Worksheets | SaaS KPIs | Customer Cohorts | 3-Statement Financials | DCF Valuation
Turn complex SaaS financial planning into a clear, connected and decision-ready forecasting system.
Build, analyze and present your SaaS business projections with a comprehensive financial model designed for founders, CFOs, investors, financial analysts and business consultants.
This premium Excel-based solution connects customer acquisition, recurring revenue, retention, operating expenses, cash flow, financial statements and business valuation into one transparent financial planning framework.
One connected model. Clear financial insights. Better-informed business decisions.
⭐ WHY CHOOSE THIS SAAS FINANCIAL MODEL?
✓ Complete 5-Year Financial Planning
Forecast 60 months of financial performance with automated calculations and connected business drivers.
✓ Powerful SaaS-Specific Analytics
Understand ARR, MRR, churn, retention, CAC, LTV, profitability, cash burn and financial efficiency.
✓ Scenario Planning & Business Valuation
Evaluate different growth assumptions, financing requirements and valuation outcomes using integrated financial models.
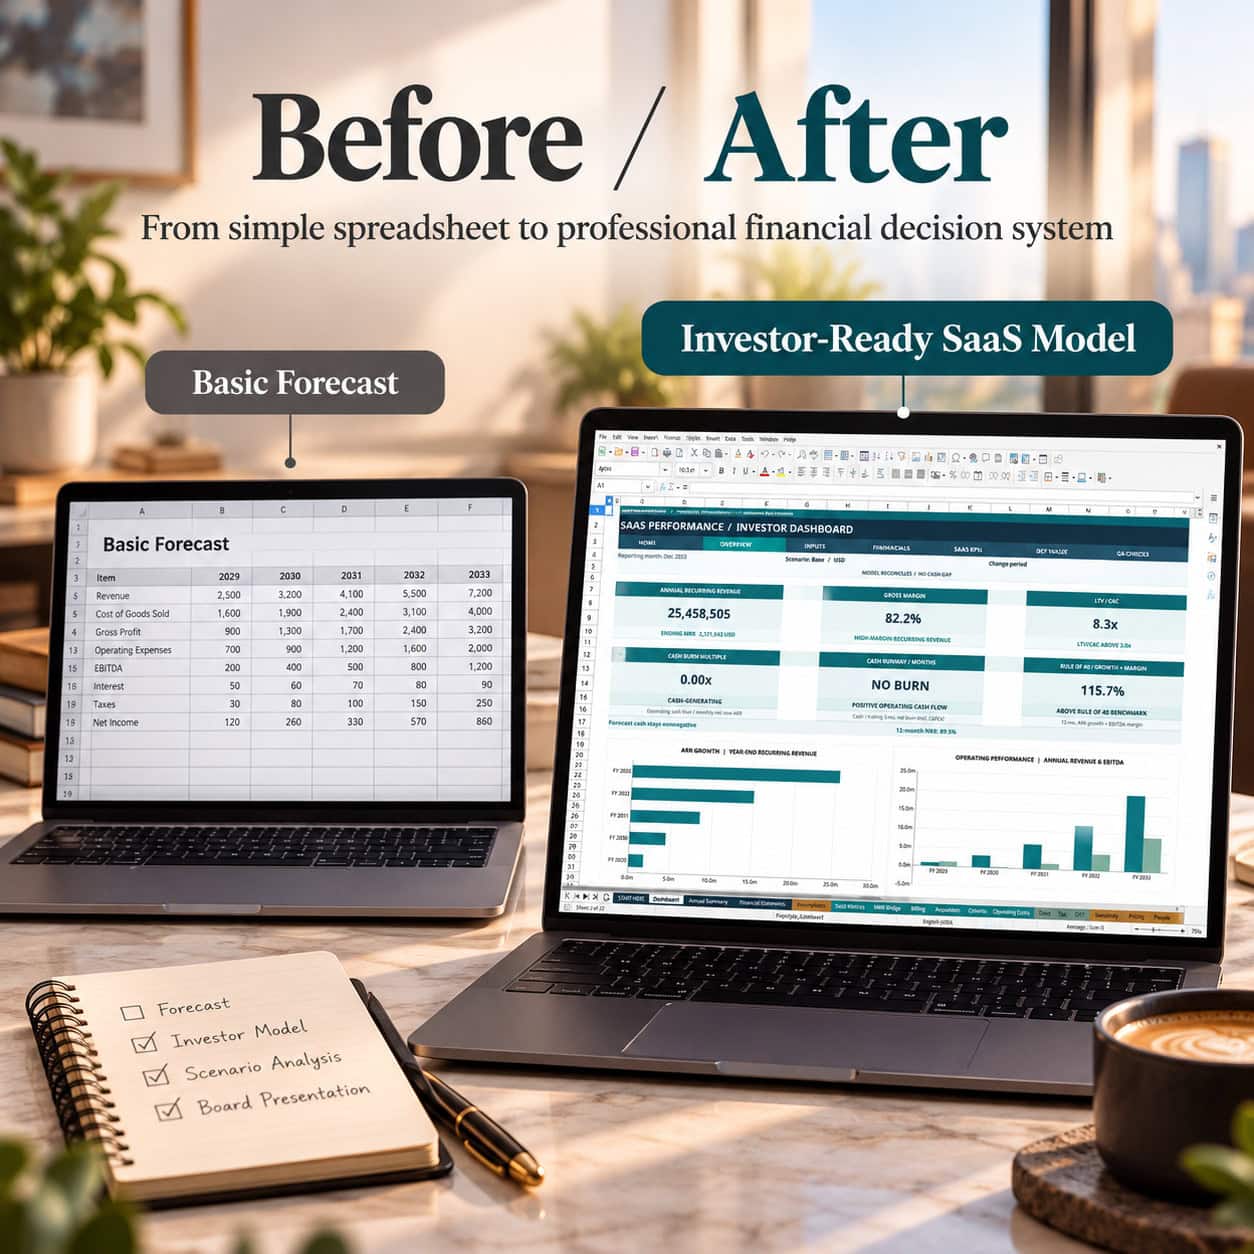
📈 1. EXECUTIVE DASHBOARD – YOUR SAAS COMMAND CENTER
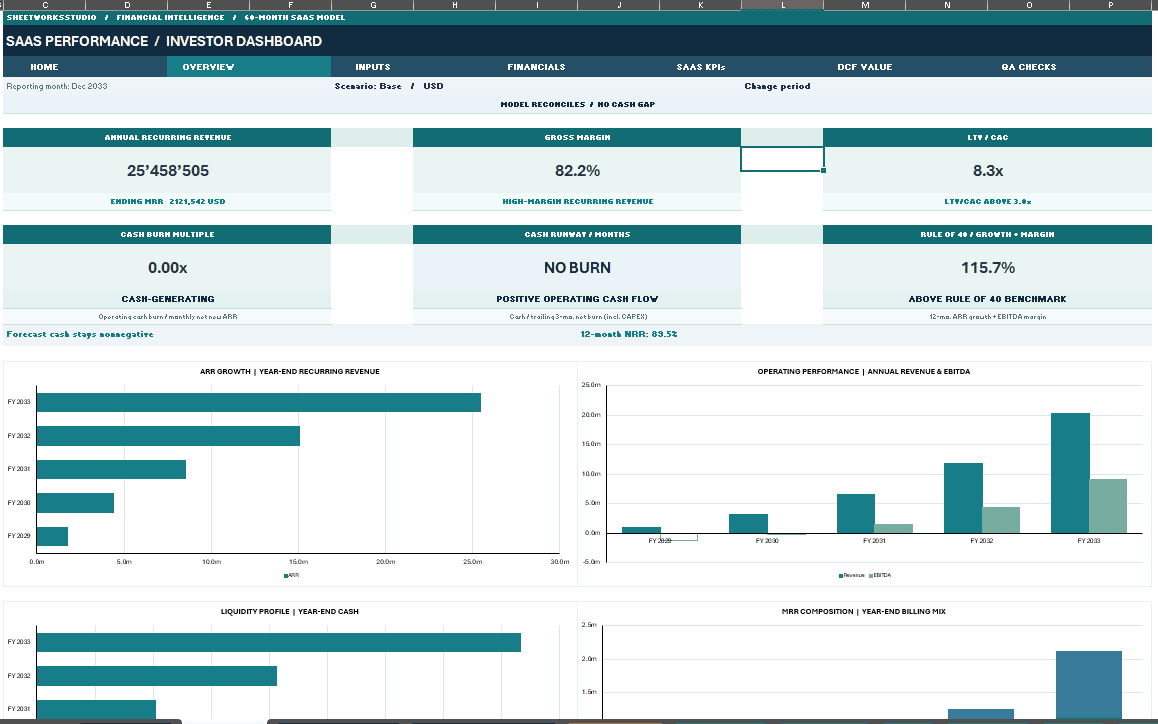
Monitor essential financial performance indicators through a professionally designed dashboard.
Key Performance Indicators:
✓ Annual Recurring Revenue (ARR)
✓ Gross Margin
✓ Lifetime Value / Customer Acquisition Cost (LTV/CAC)
✓ Cash Burn Multiple
✓ Cash Runway
✓ Rule of 40
✓ Revenue & EBITDA Performance
✓ Customer Subscription Revenue Mix
Four native, linked Excel charts visualize:
✓ ARR Growth – Year-End Recurring Revenue
✓ Operating Performance – Revenue vs. EBITDA
✓ Liquidity Profile – Year-End Cash Position
✓ MRR Composition – Monthly vs. Annual Plans
The benefit: Understand your SaaS business performance without navigating dozens of disconnected spreadsheets.
👥 2. CUSTOMER ACQUISITION & COHORT ANALYSIS
Forecast customer acquisition and retention using business-specific assumptions.
Included capabilities:
✓ Multiple Pricing Tiers & Acquisition Channels
✓ Lead Generation & Conversion Assumptions
✓ Monthly Customer Acquisition Growth
✓ Customer Capacity Constraints
✓ Monthly and Annual Subscription Cohorts
✓ Customer Retention & Logo Churn
✓ Expansion and Contraction MRR
✓ Annual Subscription Renewals
Customer cohorts connect acquisition assumptions to active customer counts and recurring revenue development throughout the forecast.
The benefit: Understand how customer behavior drives sustainable SaaS growth.
💳 3. MRR, ARR & SUBSCRIPTION REVENUE ENGINE
Move beyond simple sales forecasts with a structured recurring revenue calculation system.
The monthly MRR Bridge tracks:
✓ Opening MRR
✓ New MRR
✓ Churned MRR
✓ Contracted MRR
✓ Expansion MRR
✓ Closing MRR
✓ Annual Recurring Revenue (ARR)
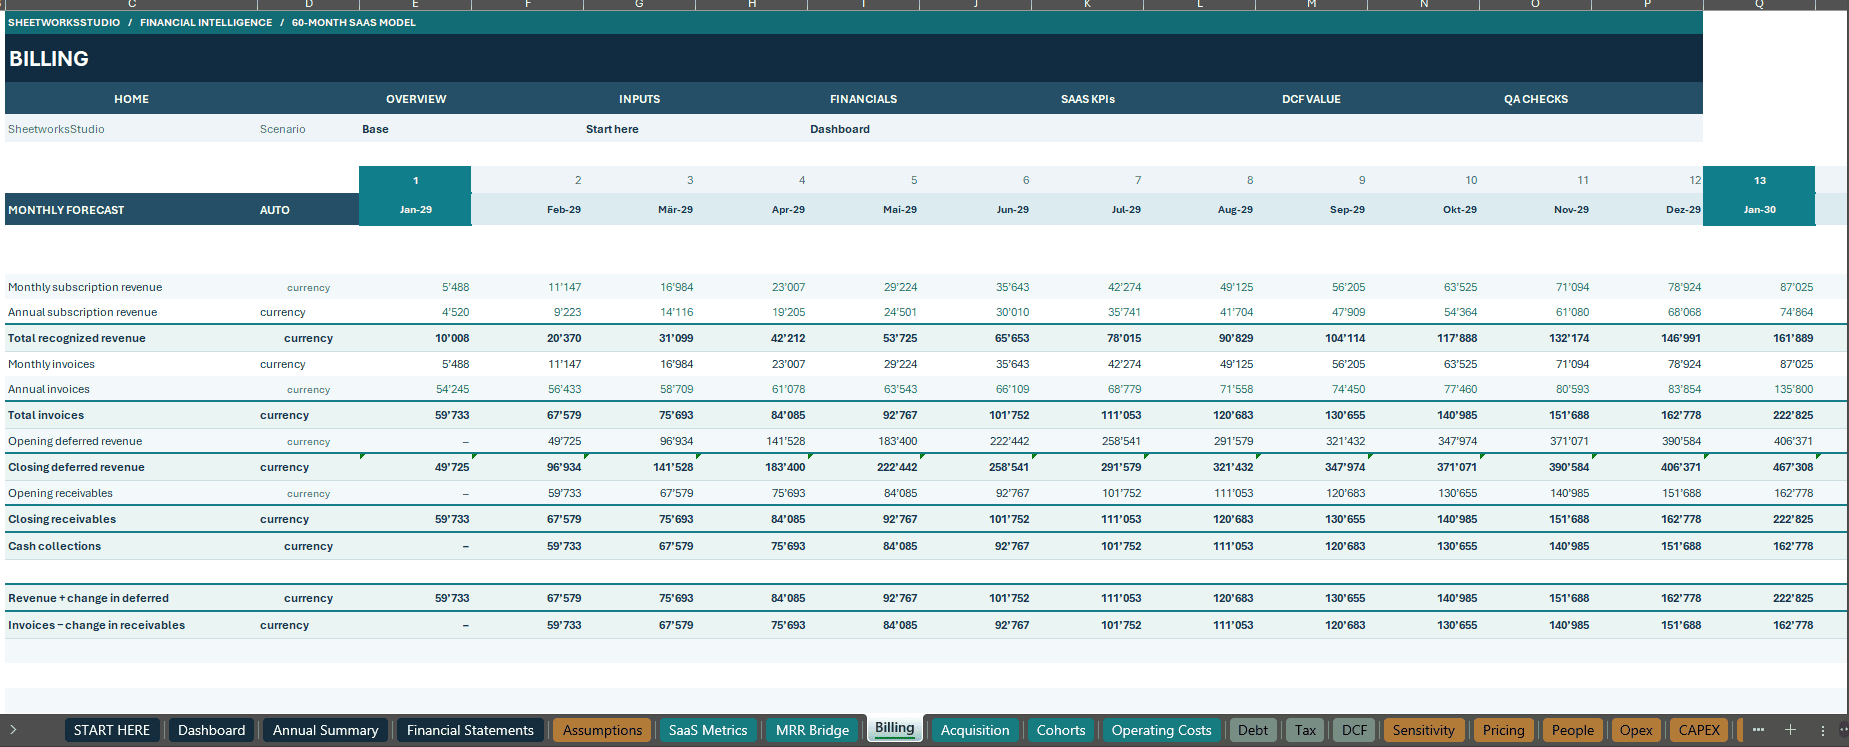
The separate Billing module also distinguishes:
✓ Recognized Subscription Revenue
✓ Monthly & Annual Customer Invoices
✓ Deferred Revenue
✓ Accounts Receivable
✓ Cash Collections
The benefit: Understand the difference between recurring revenue, invoiced amounts and actual cash received.
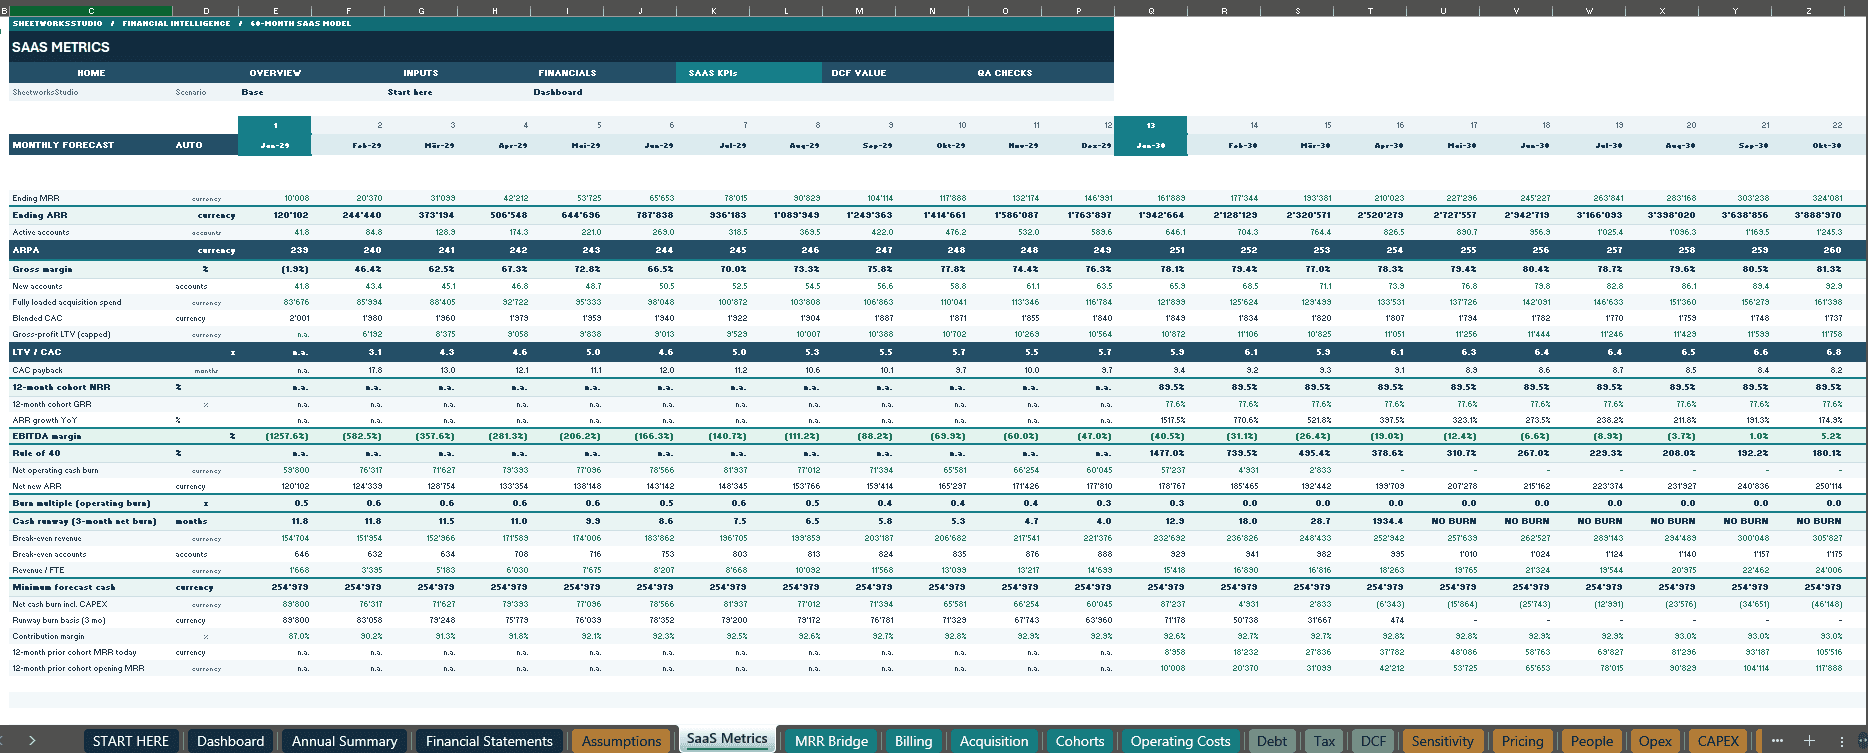
🎯 4. SAAS UNIT ECONOMICS & FINANCIAL KPIs
Analyze customer profitability and the financial efficiency of your SaaS business.
The model includes:
✓ Customer Acquisition Cost (CAC)
✓ Customer Lifetime Value (LTV)
✓ LTV/CAC Ratio
✓ CAC Payback Period
✓ Net Revenue Retention (NRR)
✓ Gross Revenue Retention (GRR)
✓ ARR & MRR Development
✓ Gross Margin & Revenue Growth
✓ Burn Multiple & Cash Runway
✓ Rule of 40
All calculated metrics connect to the underlying operating and financial model.
The benefit: Identify the relationships between acquisition costs, customer value, retention and profitable growth.
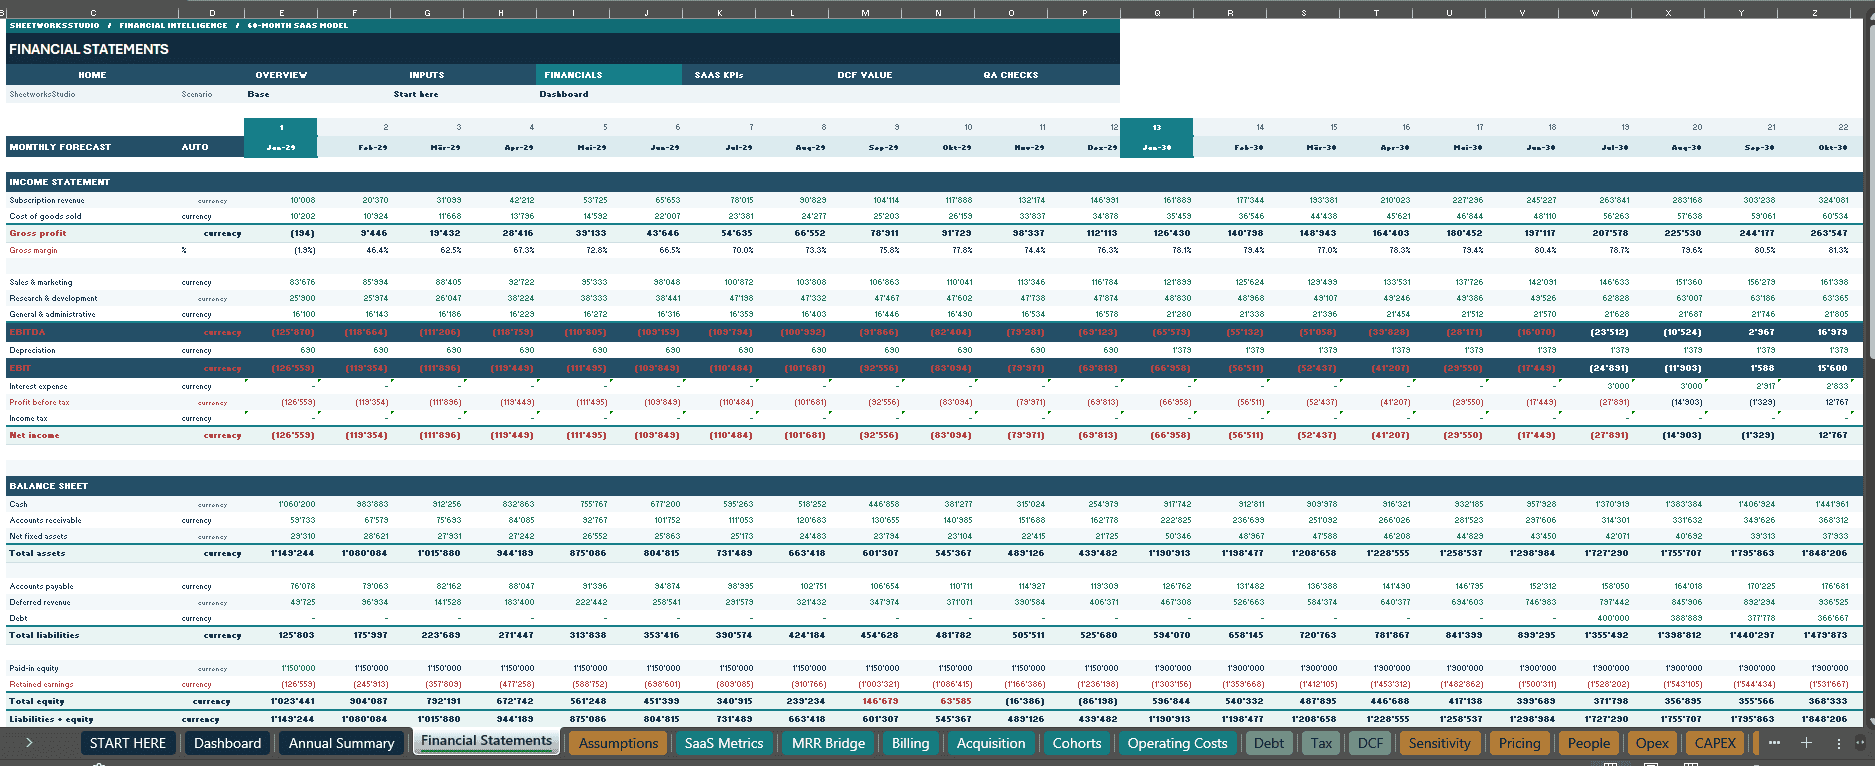
🧾 5. INTEGRATED 3-STATEMENT FINANCIAL MODEL
Connect your SaaS operating assumptions to three fundamental financial statements.
📄 Income Statement
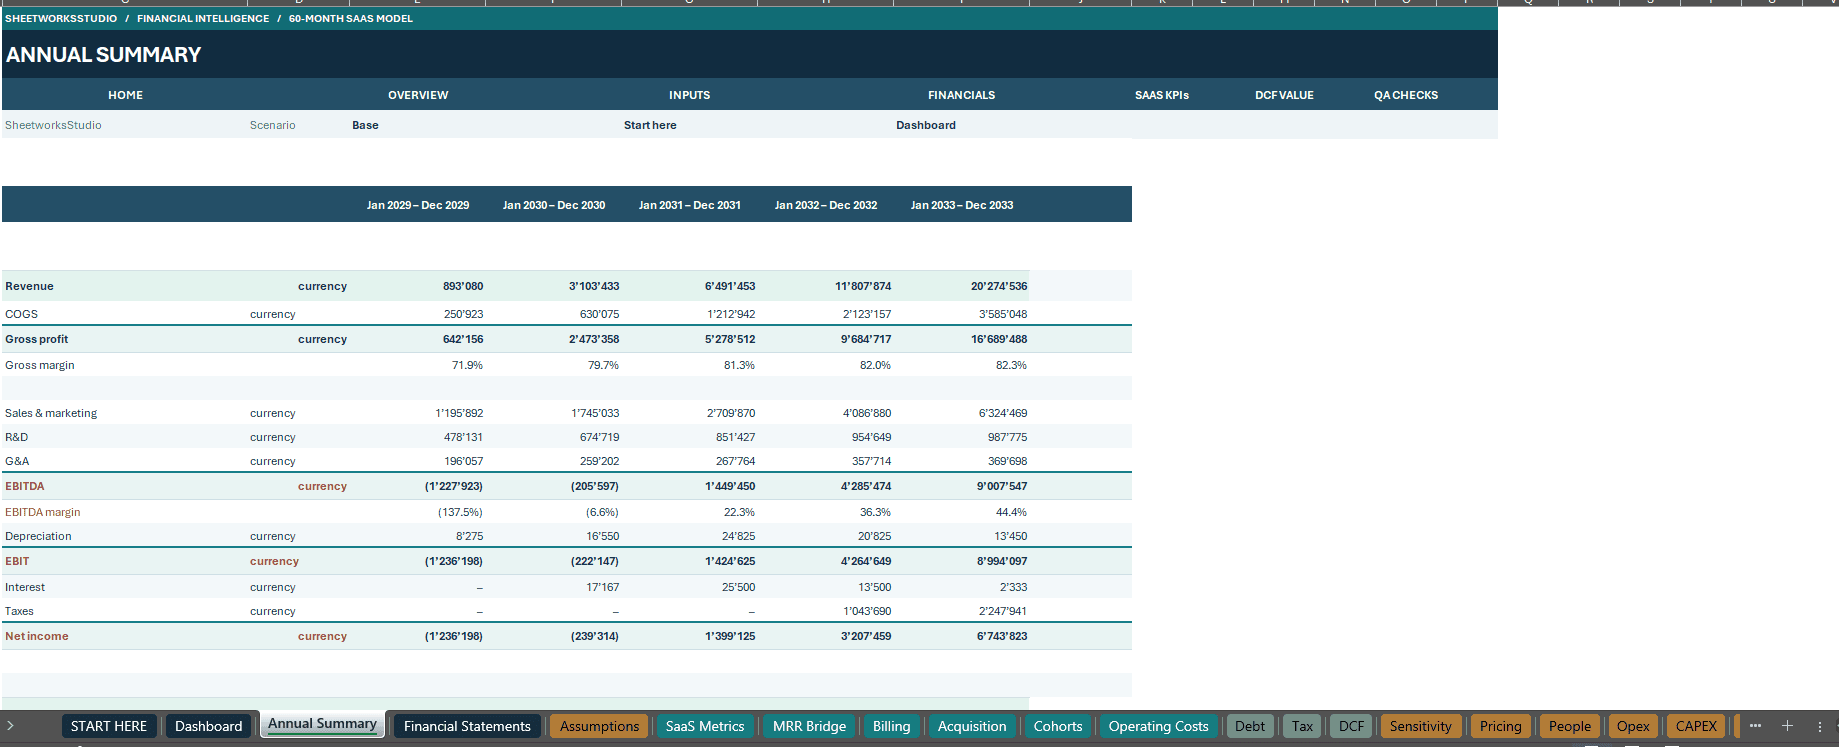
Forecast subscription revenue, cost of goods sold, gross profit, operating expenses, EBITDA, depreciation, interest, taxes and net income.
📑 Balance Sheet
Monitor cash, assets, working capital, receivables, deferred revenue, liabilities, debt and shareholders’ equity.
💵 Cash Flow Statement
Analyze operating, investing and financing cash flows, including their impact on the closing cash position.
An additional Annual Summary provides a consolidated overview of financial performance across the five-year forecast.
The benefit: Evaluate how growth decisions affect profitability, financial position and liquidity.
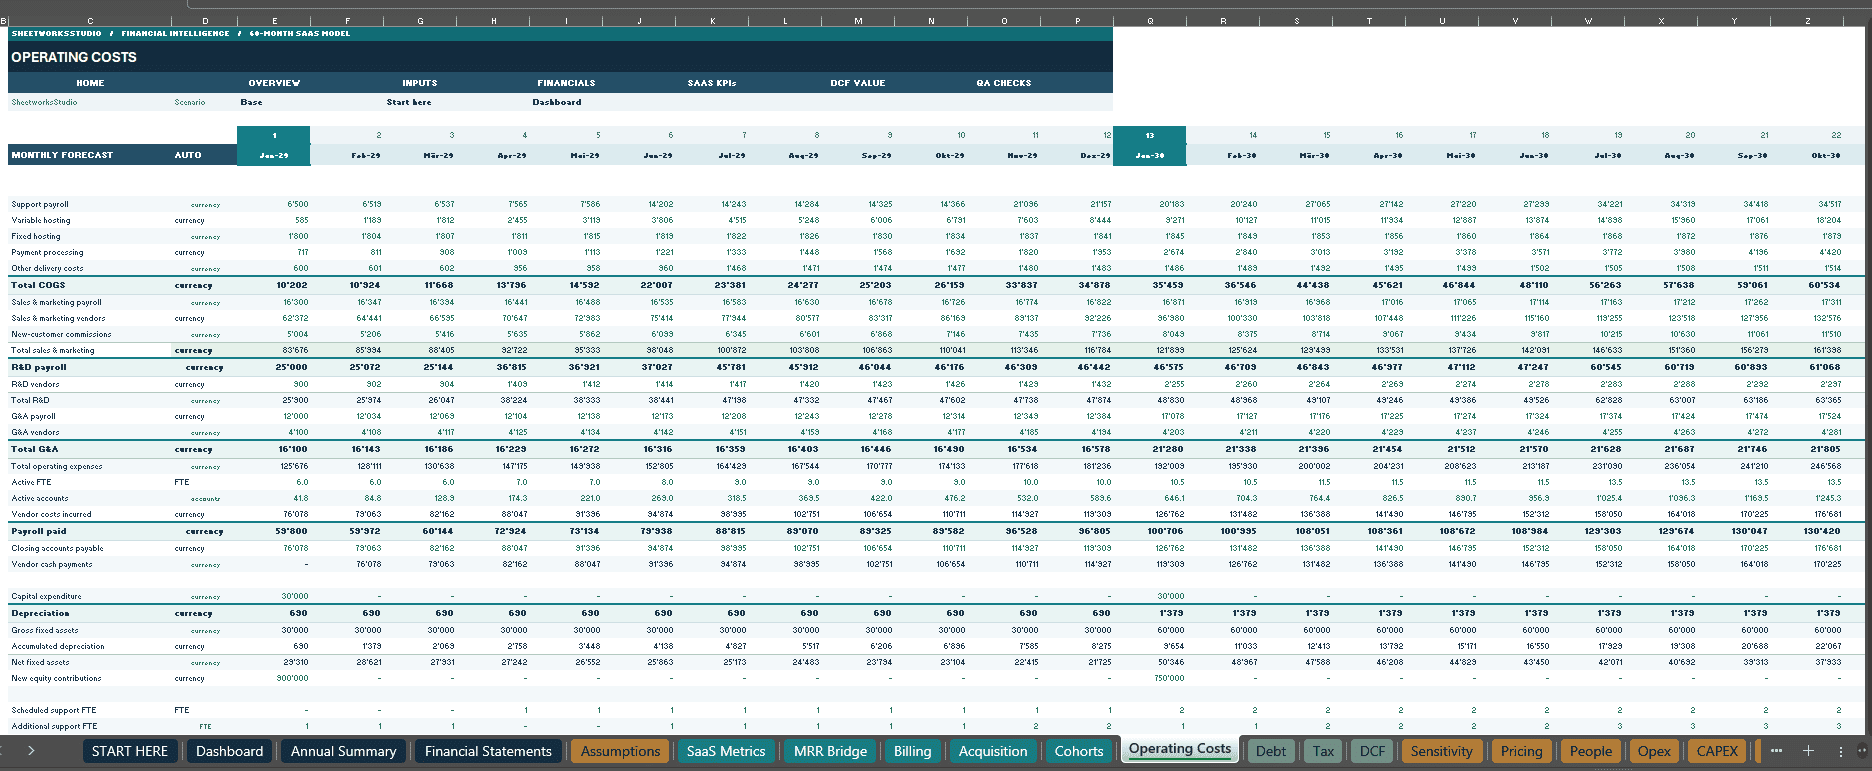
⚙️ 6. OPERATING COSTS, STAFFING & CAPITAL PLANNING
Build a detailed financial operating plan through dedicated modules.
Included planning areas:
✓ Employee Headcount & Compensation
✓ Department-Level Operating Expenses
✓ Sales & Marketing Costs
✓ Hosting & Customer Support Expenses
✓ Capital Expenditure (CAPEX)
✓ Depreciation Schedules
✓ Debt Financing & Repayments
✓ Equity Funding
✓ Corporate Taxes & Tax-Loss Carryforwards
Expandable input tables: People, Opex, CAPEX and Funding each support up to 500 records, with illustrative examples already included.
The benefit: Turn hiring, spending and funding decisions into measurable financial projections.
🔄 7. BASE, UPSIDE & DOWNSIDE SCENARIO ANALYSIS
Explore how changes in key assumptions influence future financial performance.
Three selectable scenarios:
BASE CASE – Your central operating assumptions.
UPSIDE CASE – Alternative assumptions reflecting stronger growth or improved operating conditions.
DOWNSIDE CASE – Alternative assumptions reflecting slower growth, higher churn or increased operating costs.
Scenario-sensitive drivers include:
✓ Subscription Pricing
✓ Customer Acquisition Growth
✓ Logo Churn
✓ MRR Expansion
✓ MRR Contraction
✓ Operating Cost Factors
Select a scenario from the Assumptions worksheet to update the connected financial model.
The benefit: Evaluate financial risks and opportunities before making critical business decisions.
Note: The model calculates one selected scenario at a time. Save or record scenario outputs for side-by-side comparison.
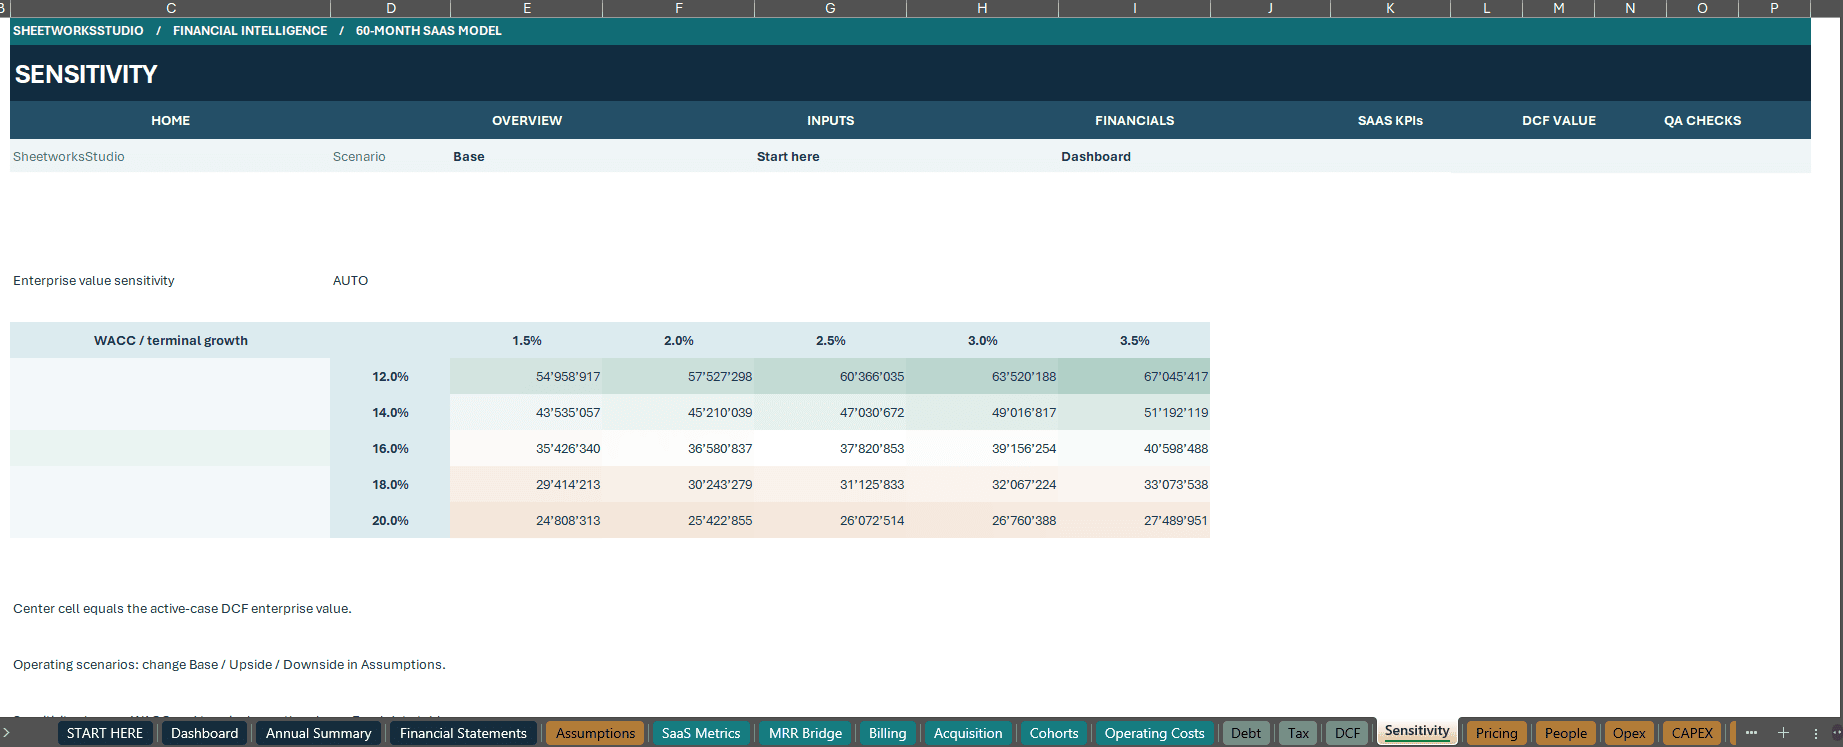
📐 8. DCF VALUATION & SENSITIVITY ANALYSIS
Estimate business value using integrated valuation calculations.
Included features:
✓ Discounted Cash Flow (DCF)
✓ Weighted Average Cost of Capital (WACC)
✓ Terminal Growth Assumptions
✓ Enterprise Value Analysis
✓ Equity Valuation Outputs
✓ Exit-Multiple Valuation Context
✓ Valuation Sensitivity Analysis
Explore how valuation results respond to different discount rates and terminal growth assumptions.
The benefit: Connect your operating forecast to a structured financial valuation framework.
🛡️ 9. MODEL VALIDATION & FINANCIAL CHECKS
The workbook includes a dedicated financial model validation section.
Key controls cover:
✓ Balance Sheet Reconciliation
✓ Cash Flow Reconciliation
✓ MRR & ARR Consistency
✓ Revenue and Billing Relationships
✓ Customer Cohort Consistency
✓ Other Financial Model Integrity Checks
These controls are designed to help identify inconsistencies when modifying assumptions.
The benefit: Greater transparency and confidence when reviewing financial projections.
📘 10. BONUS – COMPREHENSIVE 26-PAGE USER GUIDE
A professionally designed PDF manual is included with your purchase.
The guide explains:
✓ Workbook Navigation & Structure
✓ Getting Started with the Model
✓ Configuring Assumptions
✓ Base / Upside / Downside Scenarios
✓ Pricing & Customer Acquisition
✓ Cohort Retention & MRR Calculations
✓ Billing, Deferred Revenue & Cash Flow
✓ Financial Statements & SaaS KPIs
✓ DCF Valuation & Sensitivity
✓ Financial Model Checks
✓ Troubleshooting & Glossary
The benefit: A guided, step-by-step learning experience that makes a comprehensive financial model easier to understand and customize.
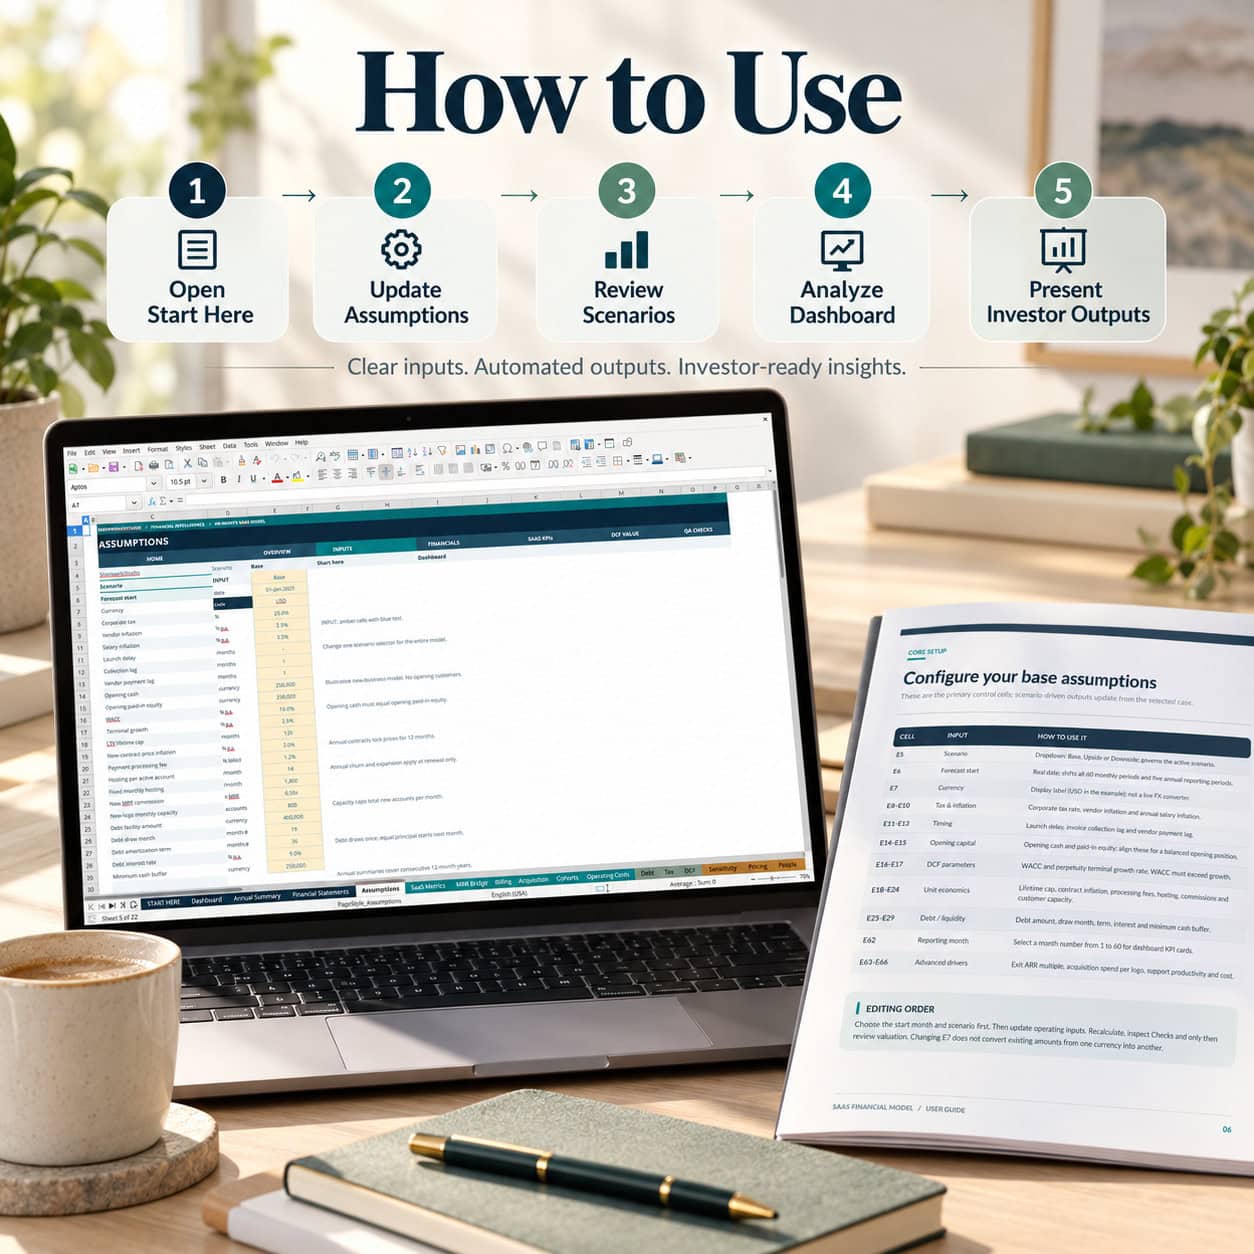
🚀 HOW TO USE – FIVE SIMPLE STEPS
STEP 1 – START HERE
Open the welcome worksheet to understand the model structure, navigation and input conventions.
STEP 2 – CONFIGURE ASSUMPTIONS
Select your scenario, forecast start date and key business assumptions.
STEP 3 – CUSTOMIZE BUSINESS INPUTS
Update Pricing, People, Opex, CAPEX and Funding with your own operating assumptions.
STEP 4 – ANALYZE THE RESULTS
Explore Customer Cohorts, MRR Bridge, SaaS Metrics, Financial Statements, Annual Summary and Executive Dashboard.
STEP 5 – VALIDATE & EVALUATE
Review financial model checks, test alternative scenarios and examine valuation and sensitivity results.
Editable inputs. Connected calculations. Clear financial outputs.
💼 WHO IS THIS FINANCIAL MODEL FOR?
✓ SaaS Founders & Startup Entrepreneurs
Build a detailed financial plan and evaluate the economics of your subscription business.
✓ CFOs & Finance Teams
Develop long-term forecasts, analyze operating performance and review cash requirements.
✓ Investors & Investment Analysts
Examine SaaS growth drivers, financial projections, unit economics and valuation assumptions.
✓ Financial Consultants & Advisors
Use a customizable modeling framework when working with SaaS and subscription-based clients.
✓ FP&A & Strategic Planning Professionals
Evaluate alternative scenarios and understand the financial impact of operating decisions.
📦 WHAT YOU RECEIVE
FILE 1 – COMPLETE SAAS FINANCIAL MODEL
Format: Excel (.xlsx)
✓ 22 Connected Worksheets
✓ 60 Monthly Forecast Periods
✓ Five Annual Reporting Periods
✓ Four Native Dashboard Charts
✓ Customer Cohort Forecasting
✓ SaaS Metrics & MRR Bridge
✓ Integrated Financial Statements
✓ Scenario Planning
✓ DCF & Sensitivity Analysis
✓ Illustrative Sample Data
✓ Editable Inputs & Visible Formulas
✓ No VBA or Macros Required
FILE 2 – PREMIUM HOW-TO-USE GUIDE
Format: PDF
✓ 26 Professionally Designed Pages
✓ Step-by-Step Instructions
✓ Sheet-by-Sheet Explanations
✓ SaaS KPI Definitions
✓ Financial Modeling Guidance
✓ Troubleshooting & Glossary
Both files are delivered together in one convenient ZIP package.
🖥️ TECHNICAL SPECIFICATIONS
Workbook Format: .xlsx
Forecast Horizon: 60 Months / 5 Years
Illustrative Forecast: 2029–2033
Forecast Start Date: Editable
Worksheets: 22
Dashboard Charts: 4
Scenarios: Base / Upside / Downside
Example Data: 15 Illustrative Records in Relevant Input Tables
Expandable Input Tables: Up to 500 Records in Key Modules
Macros / VBA: None
Formula Visibility: Fully Accessible
PDF Documentation: 26 Pages
Primary Application: Microsoft Excel
The workbook is self-contained and does not require external data connections or third-party add-ins.
ℹ️ IMPORTANT NOTES & DISCLAIMER
All included business data is fictional and intended for illustrative purposes. Financial forecasts, profitability projections, valuation results and other model outputs depend on the assumptions entered by the user.
The currency setting changes the display label and does not automatically convert values between currencies.
The model is designed primarily for Microsoft Excel. Compatibility and rendering in other spreadsheet applications may vary.
This product is a financial planning and analytical template, not a guarantee of financial performance or investment results. It does not constitute financial, accounting, tax, legal or investment advice. Users should independently review assumptions, accounting treatments and outputs before relying on the model for significant business or investment decisions.
⭐ PLAN SMARTER. UNDERSTAND YOUR NUMBERS. MAKE BETTER DECISIONS.
From customer acquisition to company valuation – one connected financial modeling system.
Bring together your SaaS growth assumptions, recurring revenue, operational costs, financial statements and valuation analysis in a professional and customizable Excel framework.
SaaS 5-Year Financial Model – A complete financial planning toolkit for subscription-driven businesses.
Similar ProductsOther customers were also interested in...



 eFinancialModels
Electric Vehicle (EV) Charging Station Financial M...
With this comprehensive 5- or 10-year monthly tool, investors can assess the viability of setting up... Read more

Financial Model for Mobile App | Mobile App Busine...
The Mobile App Financial Plan Template in Excel allows you to develop financial projections when lau... Read more

 HenrySheykin
Food Truck Financial Model Excel Template
The Food Truck Financial Model helps entrepreneurs, founders, business owners, consultants, and anal... Read more

Green Hydrogen Production from Wind Energy Financi...
The Green Hydrogen from Wind Financial Model aims to comprehensively forecast a horizon of 40 years ... Read more

Simple Mutual Non-Disclosure Agreement Template
Protect your business secrets with ease using our Simple Mutual Non-Disclosure Agreement Template. S... Read more

Solar Energy Financial Model
The Solar Energy Financial Model Spreadsheet Template in Excel assists you in preparing a sophistica... Read more

 Peter Graf
The Customer-Centric Financial Model for Restauran...
Starting a restaurant without a financial plan is like driving a car blindfolded. You wouldn´t do i... Read more
You must log in to submit a review.