
0 ITEMS

Sovereign Reserve GENIUS Act Stablecoin Issuer Financial Model | 60-Month Reserve, Liquidity, Stress, 3-Statement, DCF & Dashboards
Model the economics, reserve architecture, liquidity resilience, regulatory capital, financial statements, and enterprise value of a payment-stablecoin issuer in one integrated Excel workbook. The model is built as a 60-month monthly engine with FY1-FY5 annual summaries, five operating scenarios, linked reserve and cost modules, stress testing, three financial statements, DCF valuation, and executive dashboards. Seller-supplied and already tested; no Studio workbook audit was performed.

🏦 Sovereign Reserve GENIUS Act Stablecoin Issuer Financial Model
Model the economics, reserve architecture, liquidity resilience, regulatory capital, financial statements, and enterprise value of a payment-stablecoin issuer in one integrated Excel workbook. The model is built as a 60-month monthly engine with FY1-FY5 annual summaries, five operating scenarios, linked reserve and cost modules, stress testing, three financial statements, DCF valuation, and executive dashboards.
Seller-supplied and already tested; no Studio workbook audit was performed.
🎯 The buyer problem
A stablecoin issuer is not simply a token-growth forecast. Circulation growth must be translated into reserve requirements, cash and deposit capacity, Treasury-bill and repo deployment, reserve yield, partner revenue share, banking and custody costs, blockchain costs, compliance spending, operating expenses, capital requirements, redemption liquidity, forced-sale losses, peg behavior, free cash flow, and valuation. A change in rates or redemption behavior can materially change the economics even when token circulation is growing.
This workbook connects those decisions in a single model so a finance, strategy, treasury, risk, or investment team can move from operating assumptions to liquidity and valuation outputs without maintaining disconnected schedules.
🧭 Model workflow
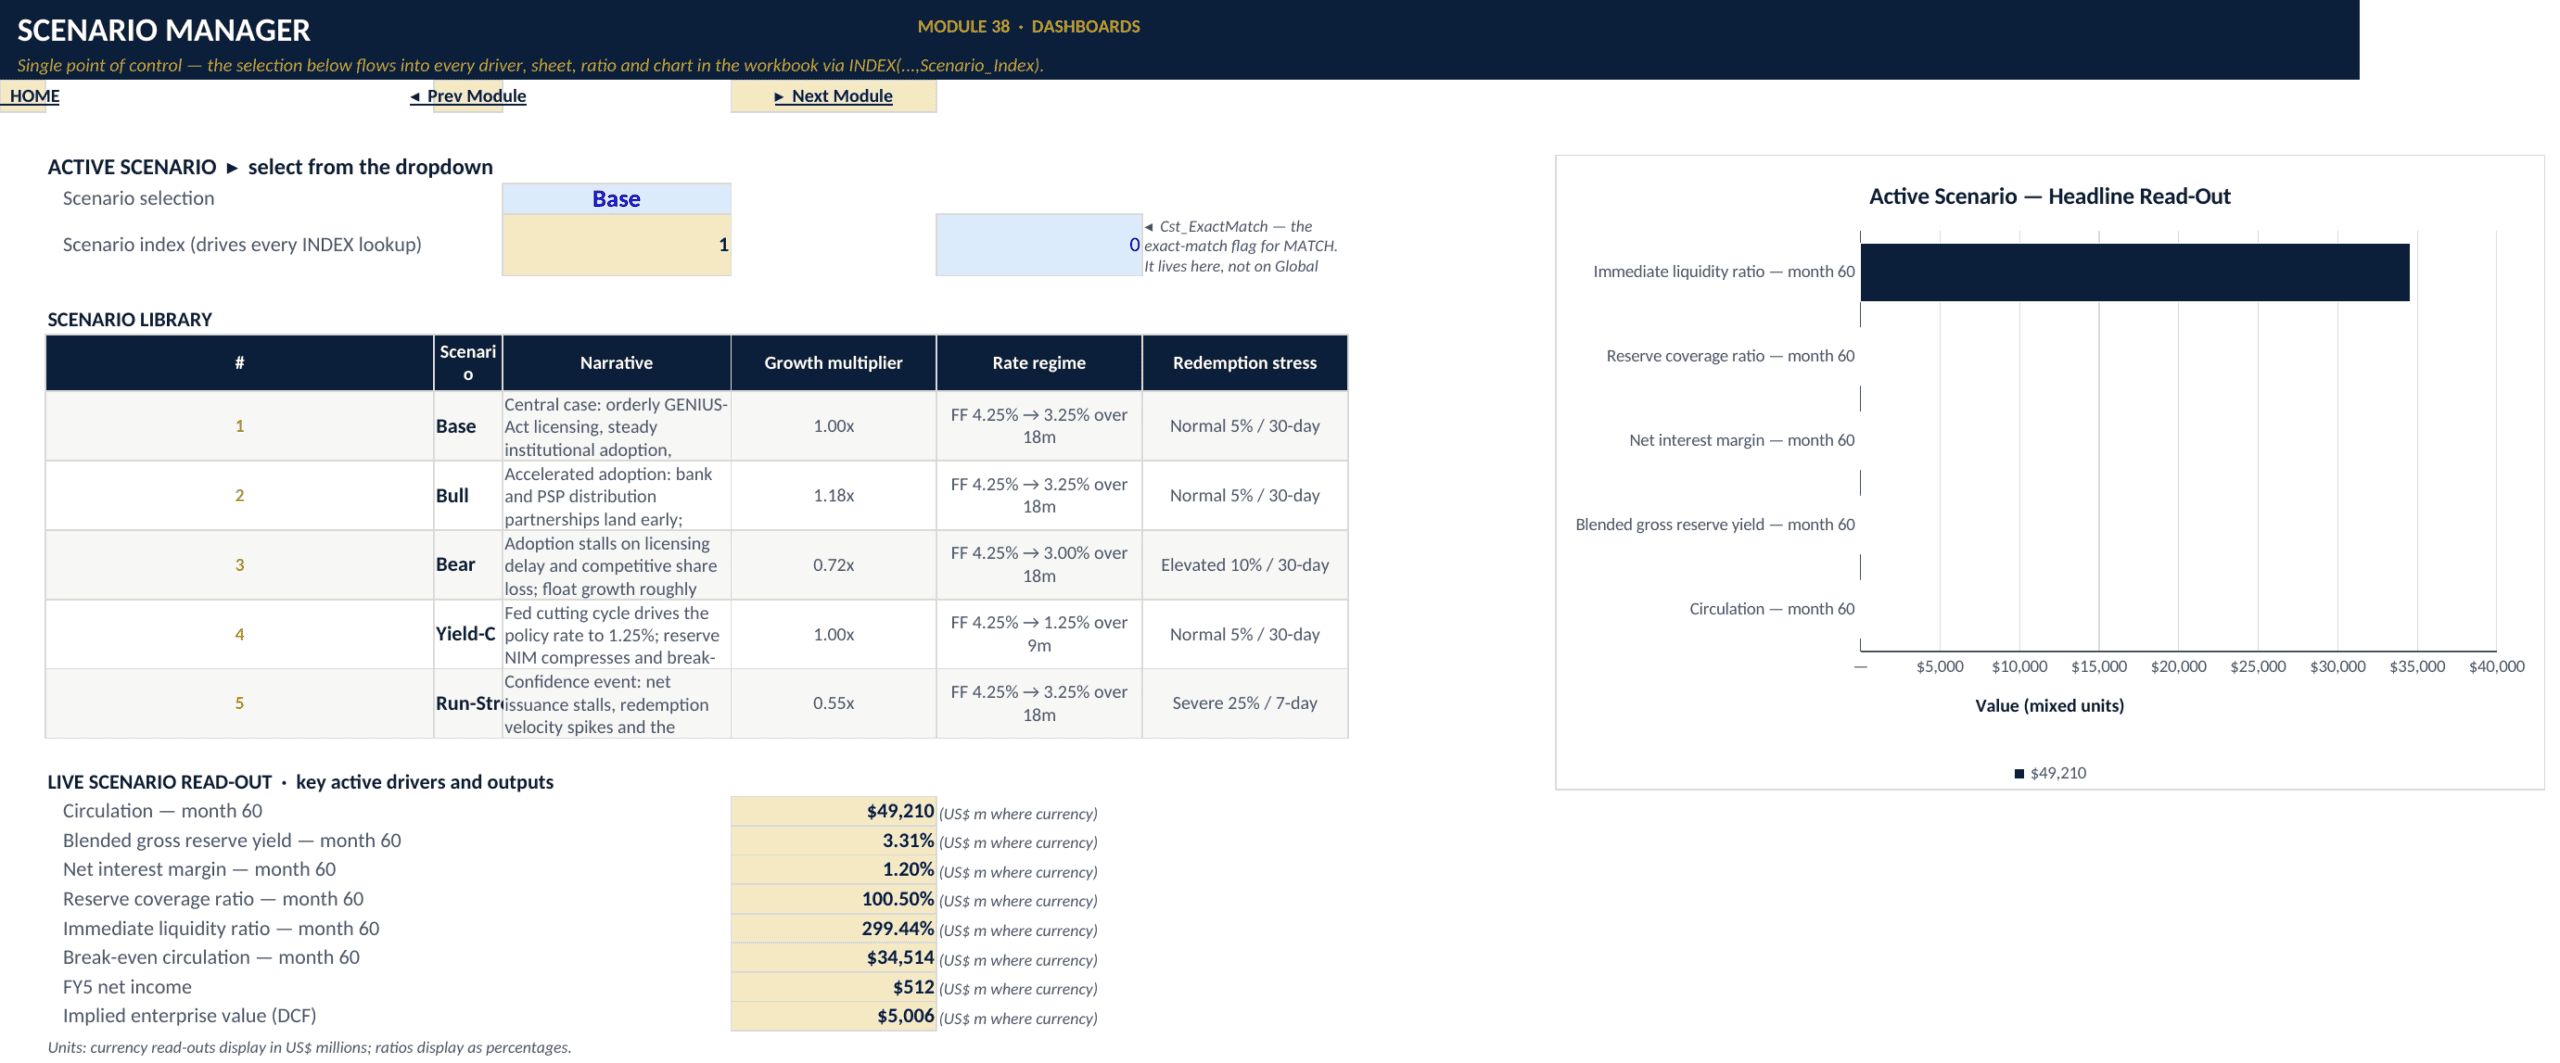
1. Select the active scenario in Scenario Manager.
2. Edit the blue-input assumptions in Global Assumptions, Regulatory Timeline, Yield Curve & Rates, and Customer Segmentation.
3. Review the linked issuance, transaction, reserve, cost, compliance, liquidity, and financial-statement modules.
4. Re-strike the snapshot stress tables using the model’s stress evaluation month where relevant.
5. Review the executive, liquidity/risk, and revenue/cost dashboards for decision-ready outputs.
The five built-in scenarios are Base, Bull, Bear, Yield-Compression, and Run-Stress. They vary growth, policy-rate paths, and redemption severity so the model can separate adoption risk, rate risk, and confidence/run risk.
✏️ Editable inputs and operating drivers
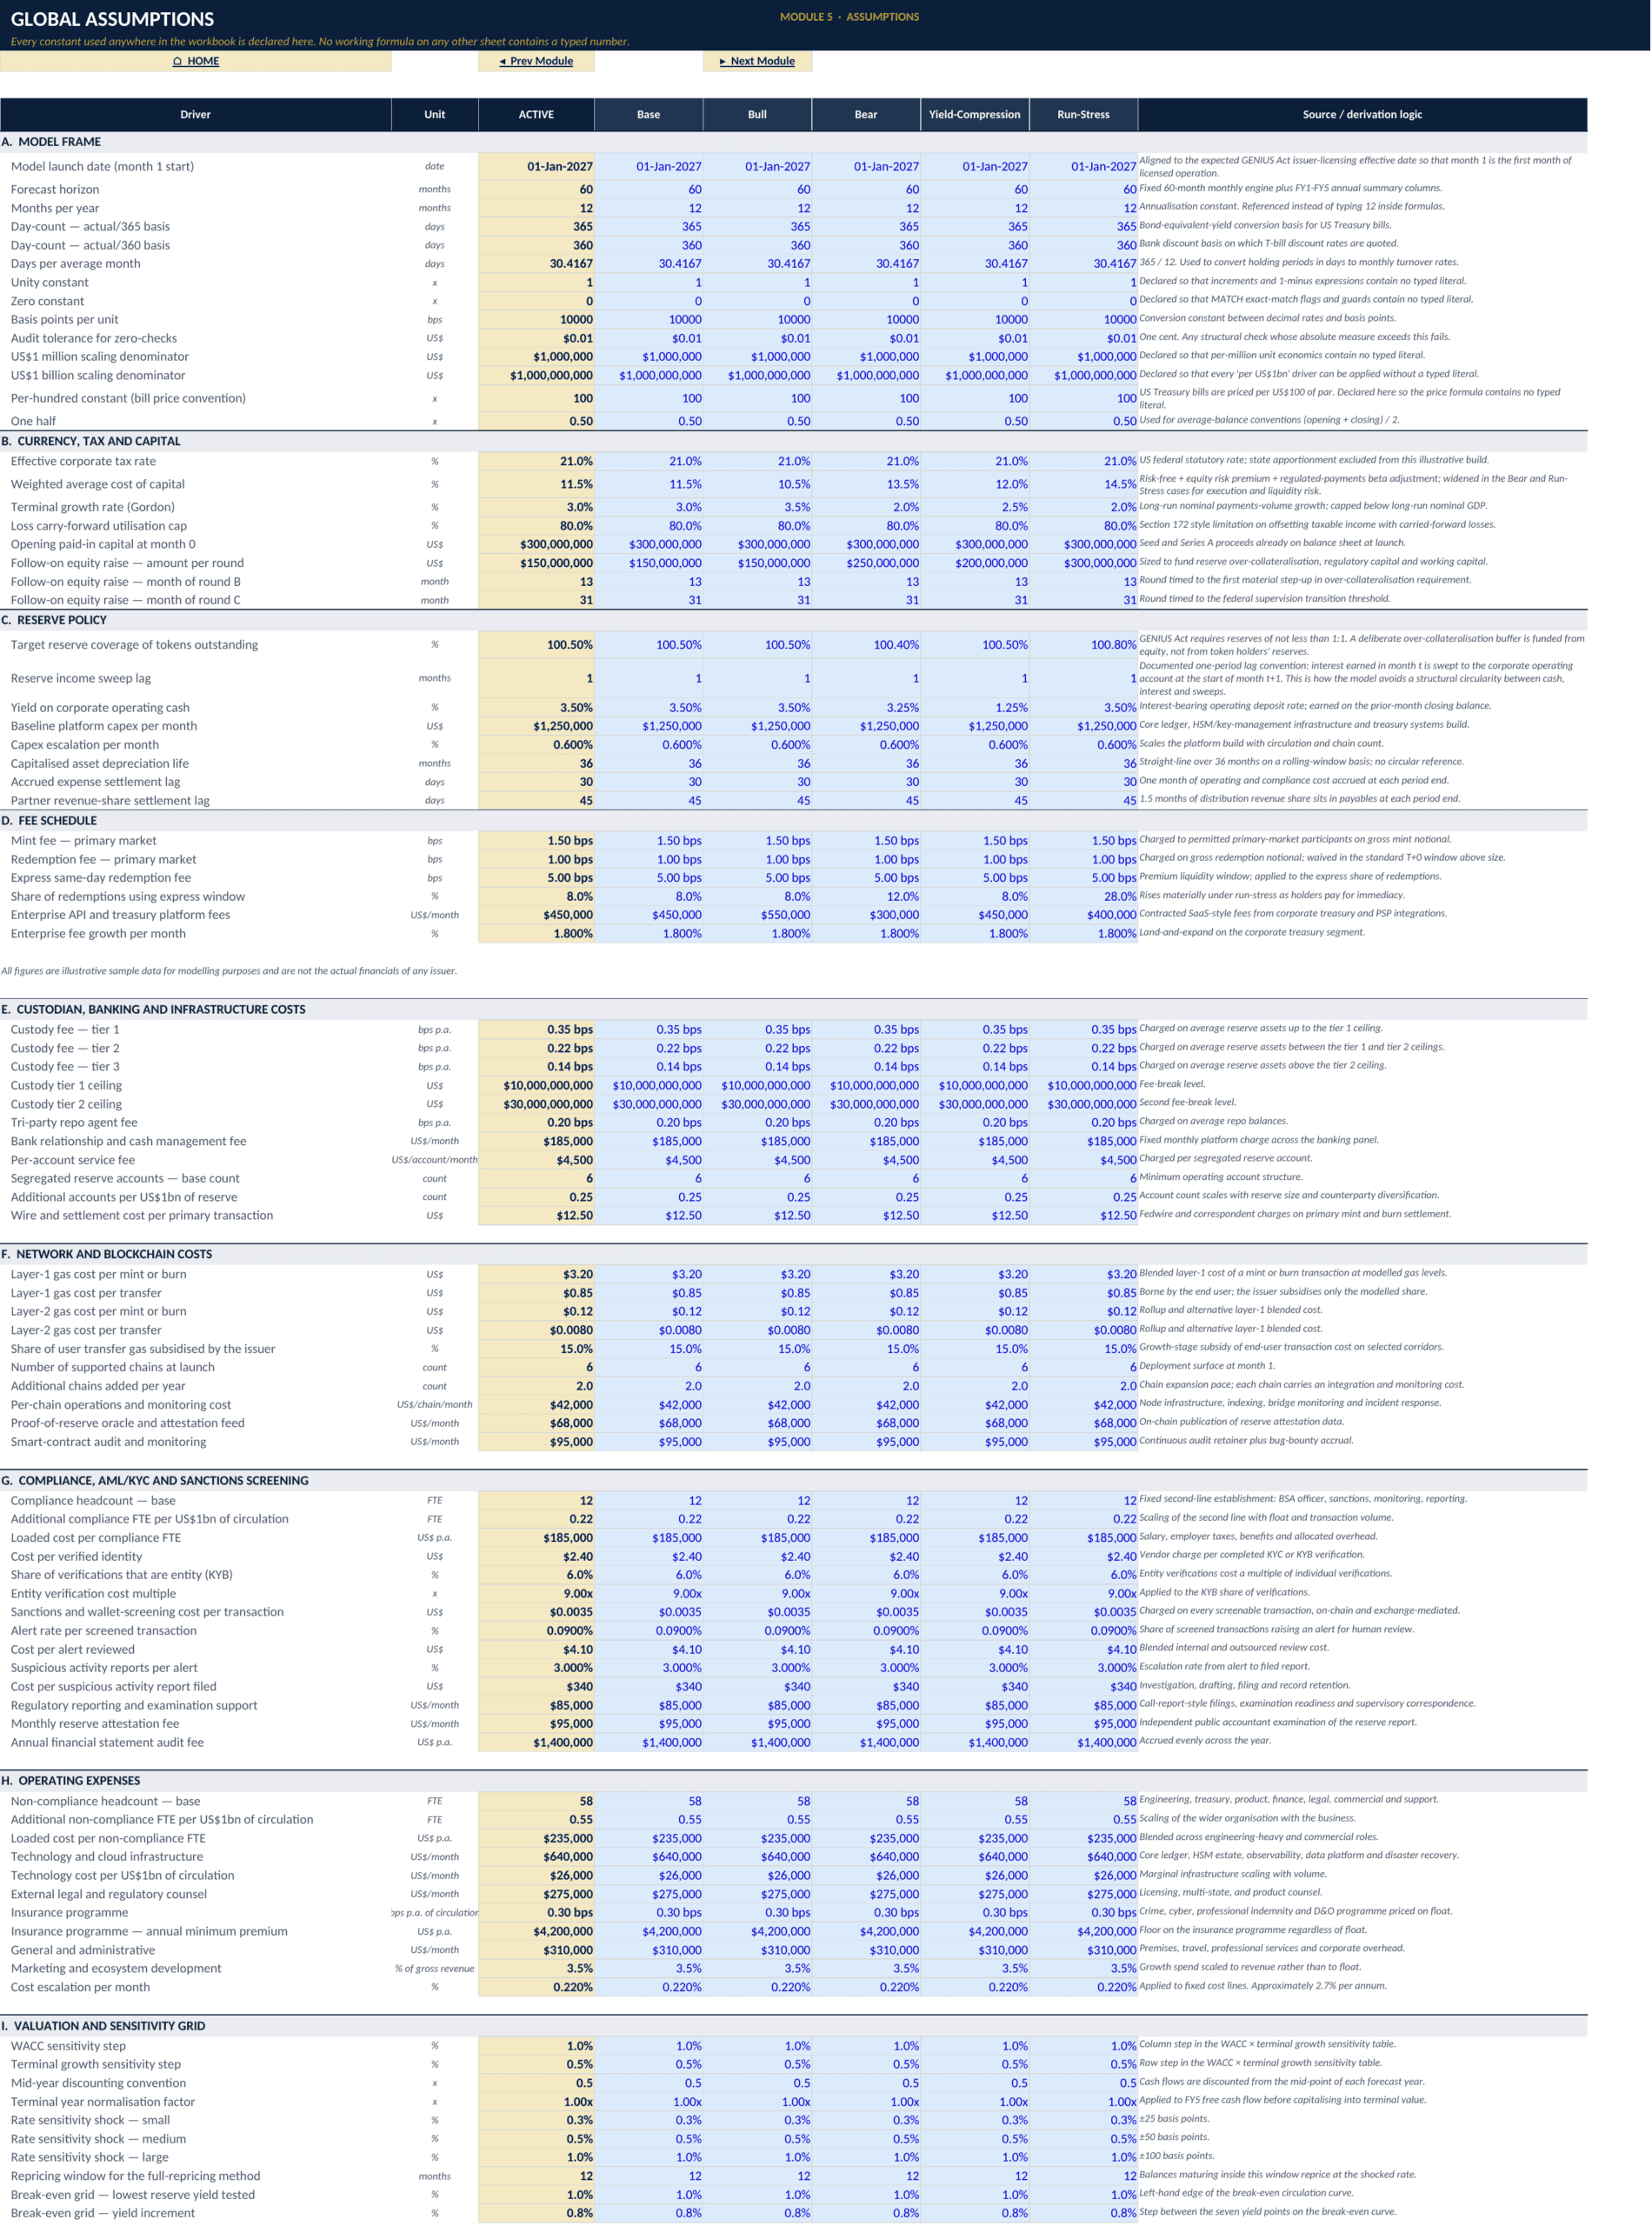
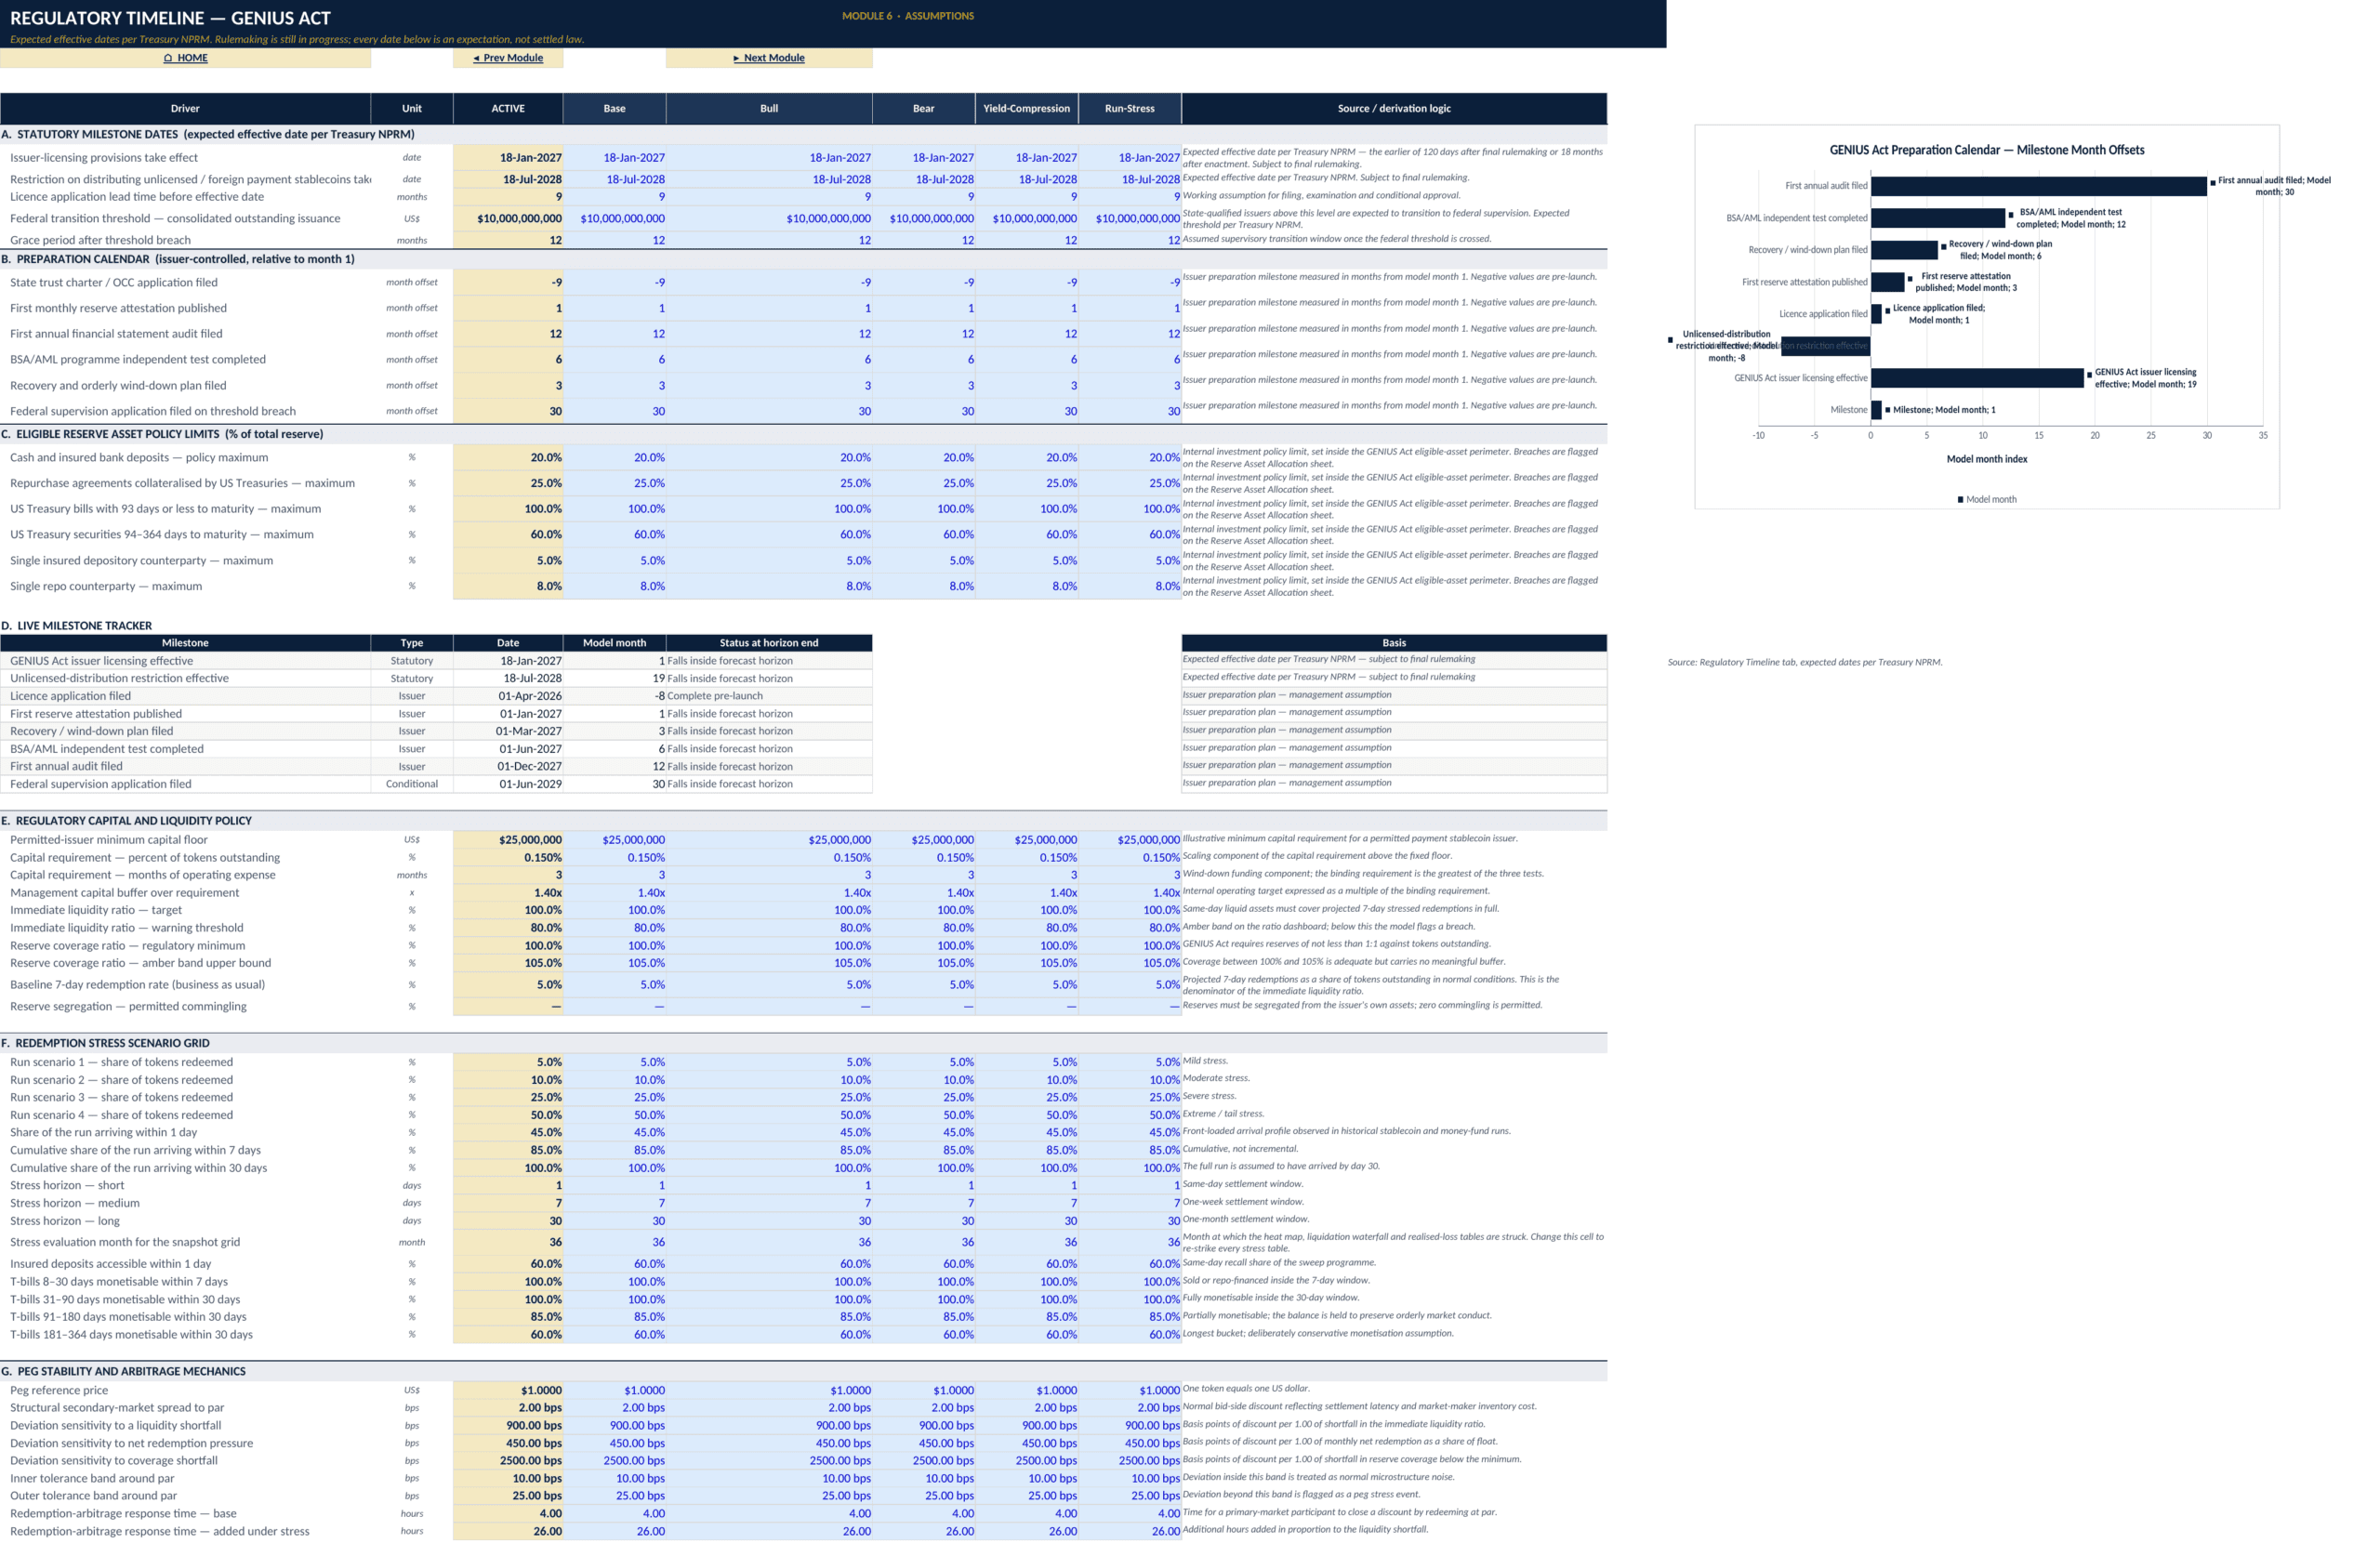
The assumptions architecture covers the model frame and constants, launch and forecast horizon, tax and capital parameters, reserve-policy limits, fee and cost drivers, valuation assumptions, expected regulatory milestone timing, policy-rate and yield-curve paths, repo and deposit rates, customer-segment mix, float growth, holding periods, transaction velocity, ticket size, and fee treatment. The scenario structure places Base, Bull, Bear, Yield-Compression, and Run-Stress inputs side by side while an active-scenario column feeds the calculation engine.
⚙️ Core calculation modules
Issuance & customers: Issuance & Redemption builds opening float, gross issuance, gross redemption, net change, and closing circulation by segment across the monthly horizon. Transaction Velocity converts the customer base into transfer volume, turnover, and transaction counts by segment and settlement rail.
Reserve portfolio and yield: Reserve Asset Allocation calculates required reserves, target versus actual allocation, rebalancing, and policy-limit tests. Cash & Bank Deposits models operating cash, insured deposit sweeps, counterparty concentration, and same-day availability. T-Bill Portfolio models a laddered Treasury-bill book, pricing, roll schedules, and weighted maturity. Repo Book covers reverse-repo tenor, collateral, haircut mechanics, concentration, and income. Reserve Yield & Duration calculates blended yield, Macaulay duration, modified duration, convexity, and duration matching. Interest Income bridges the reserve books into gross and net reserve economics.
Costs and partner economics: Custodian & Banking Costs models tiered custody, repo-agent, account, service, and settlement costs. Network & Blockchain Costs models chain-level gas and transaction costs, user subsidies, multi-chain operations, oracle attestation, and smart-contract assurance. Distribution Economics models partner reserve-yield sharing, exchange rebates, market-making support, and wallet economics. Compliance & AML models compliance headcount, onboarding verification, transaction screening, alerts, reports, and supervisory costs. Operating Expenses provides the wider G&A, technology, insurance, legal, and non-compliance headcount build.
🛡️ Regulatory capital, liquidity, and stress testing
Reg Capital & Liquidity links the 1:1 reserve requirement, capital requirement, segregation, and capital surplus. Coverage & Liquidity Ratios tracks reserve coverage and immediate liquidity against policy thresholds.
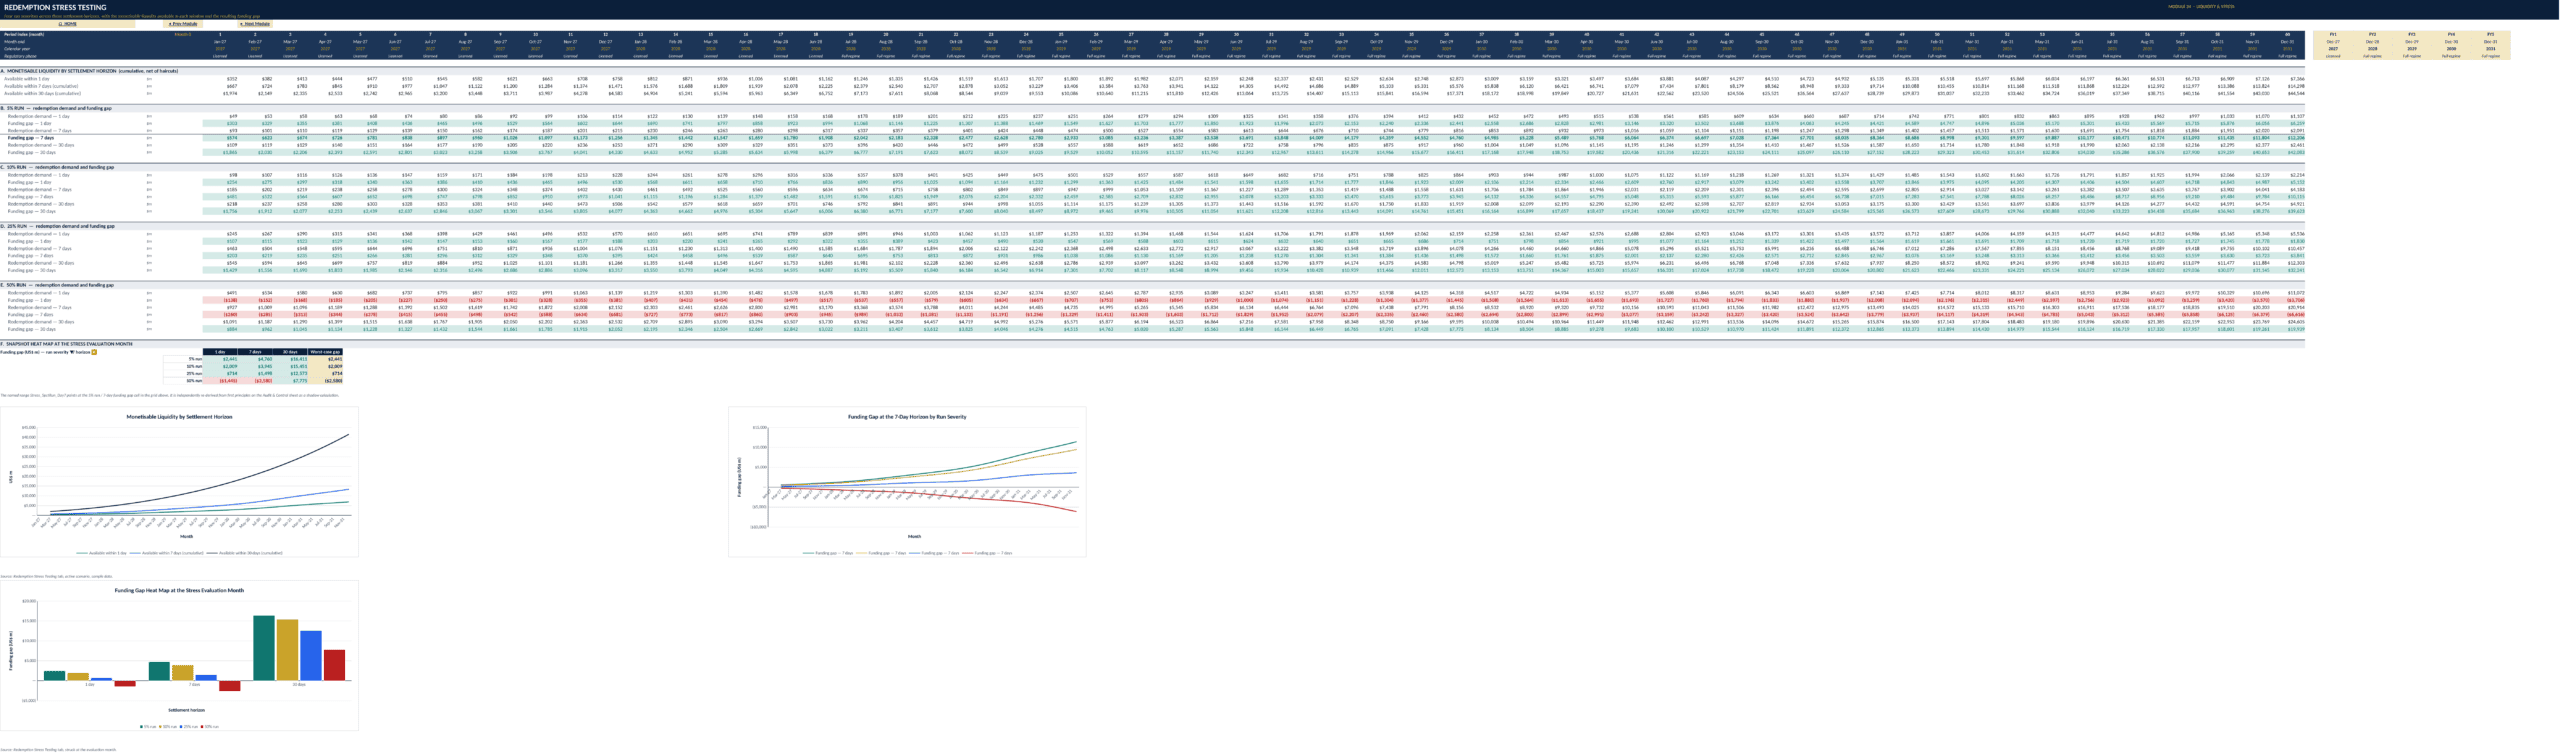
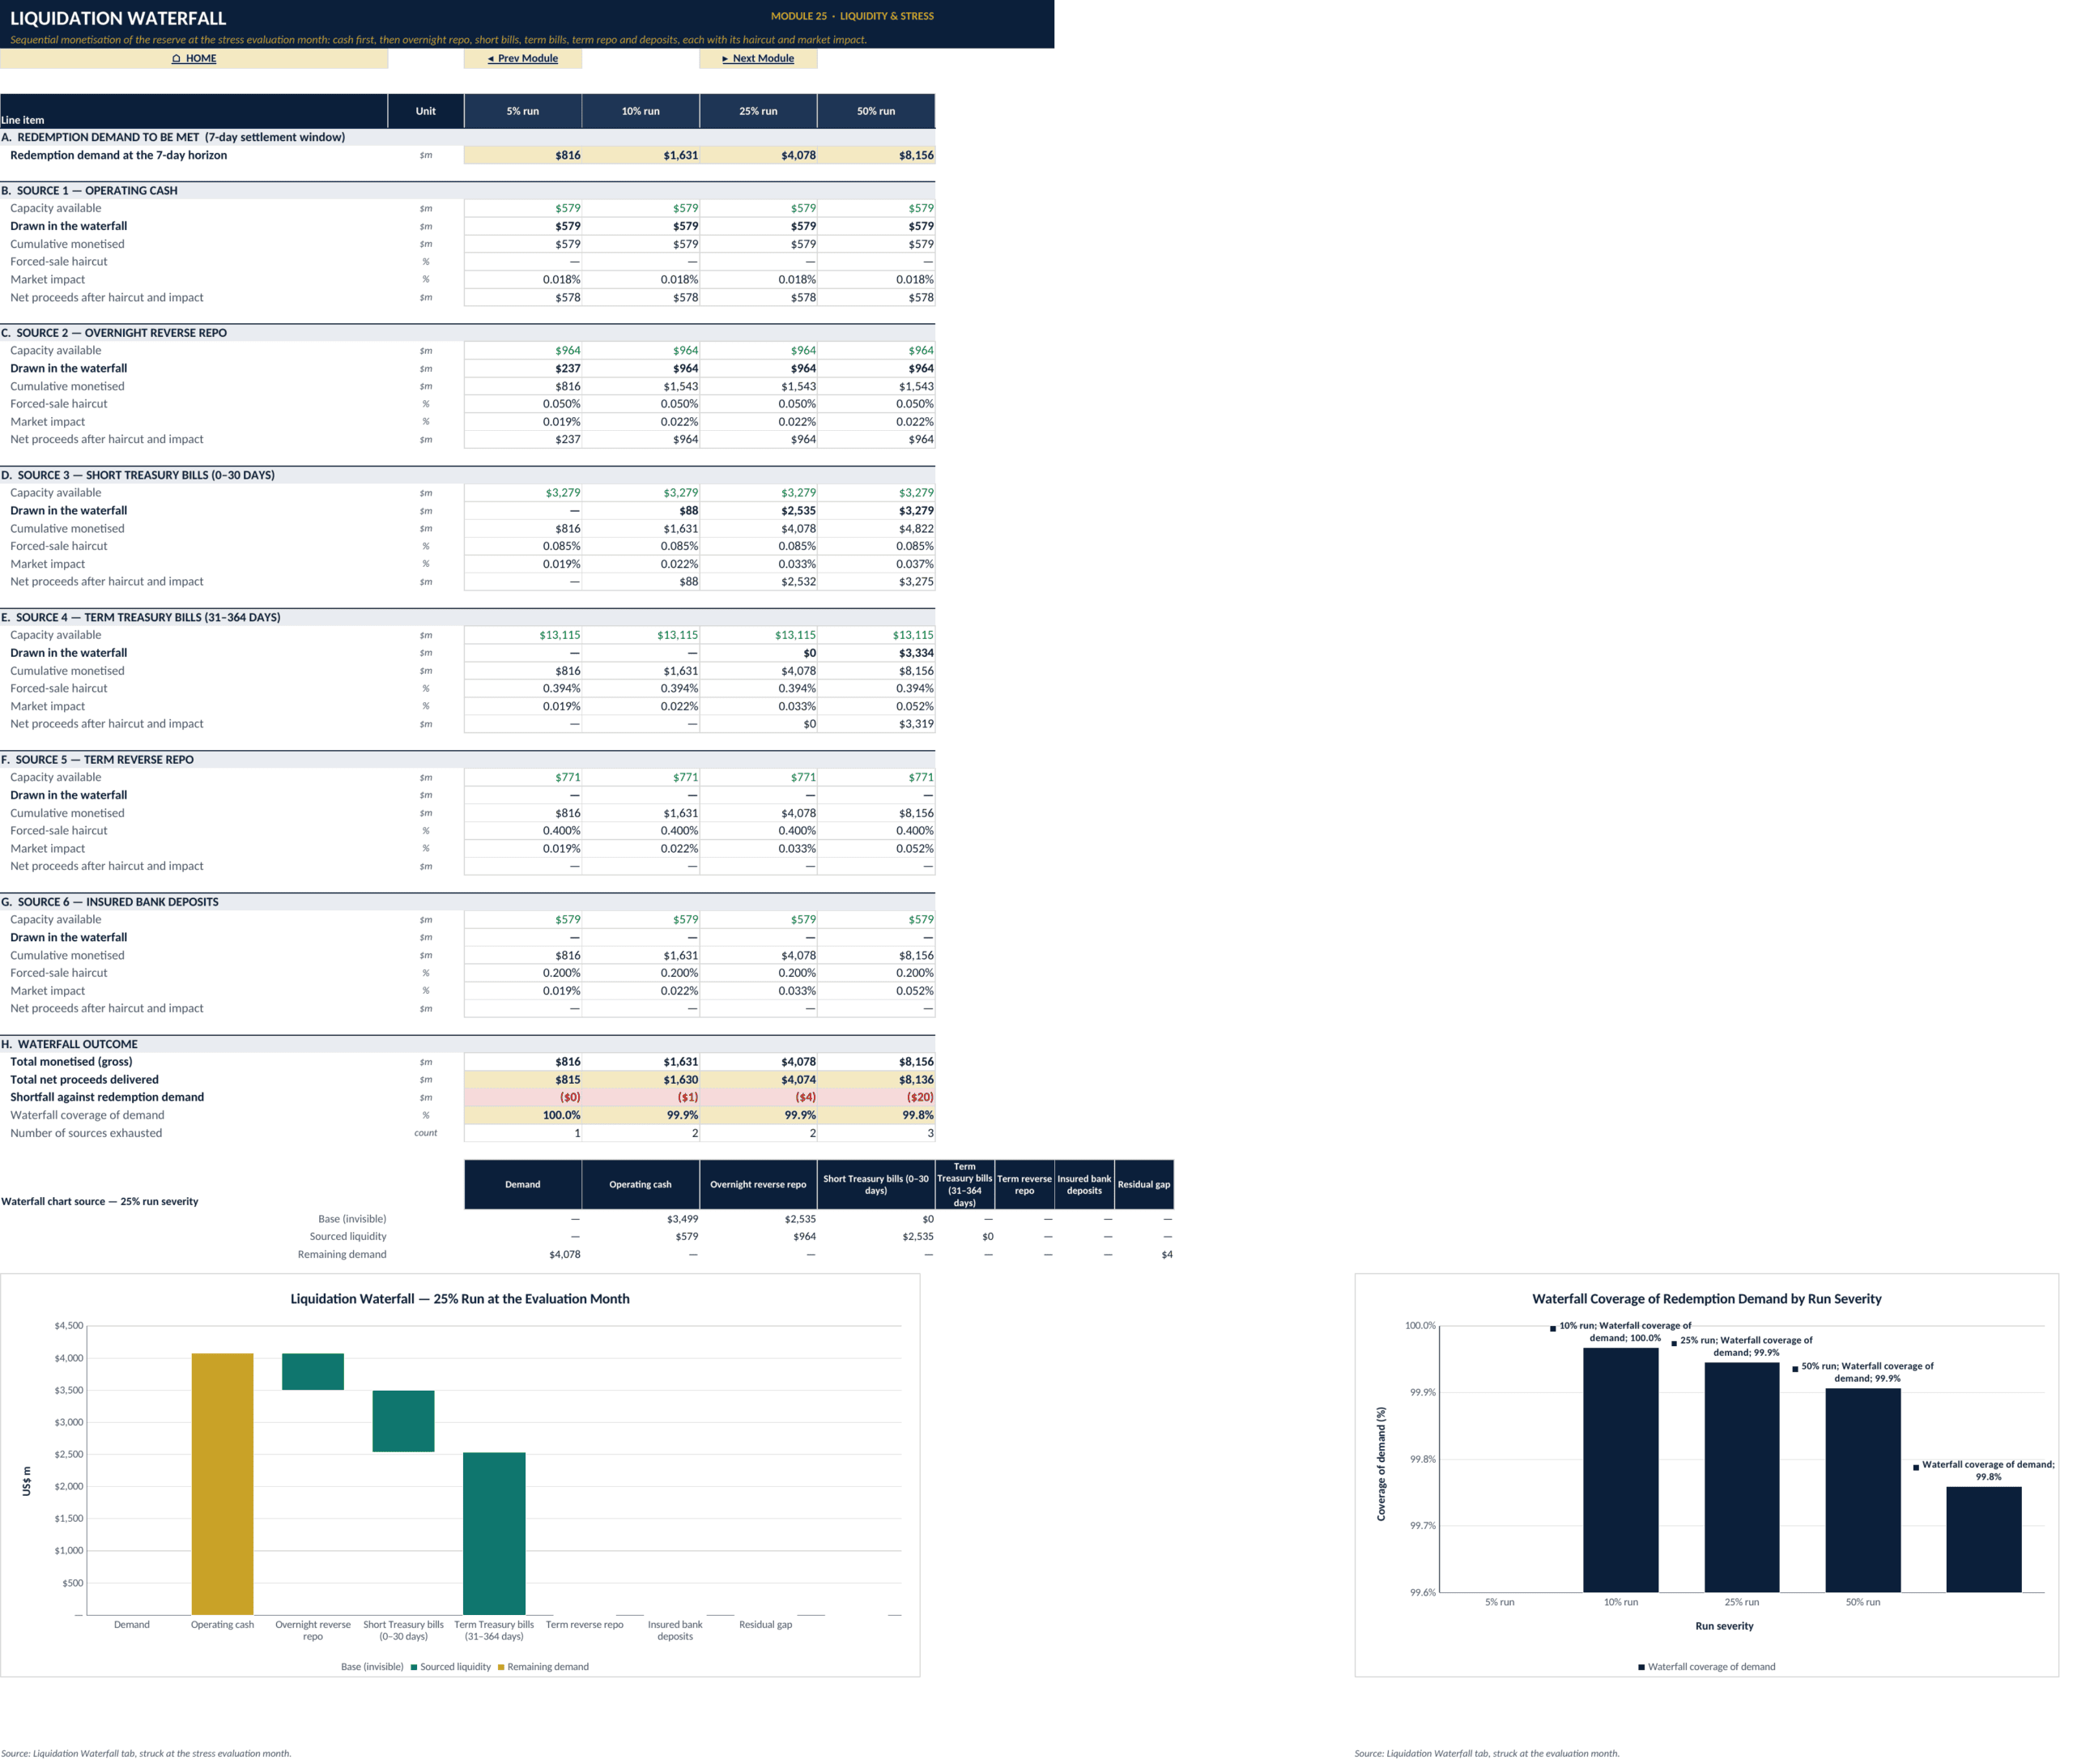
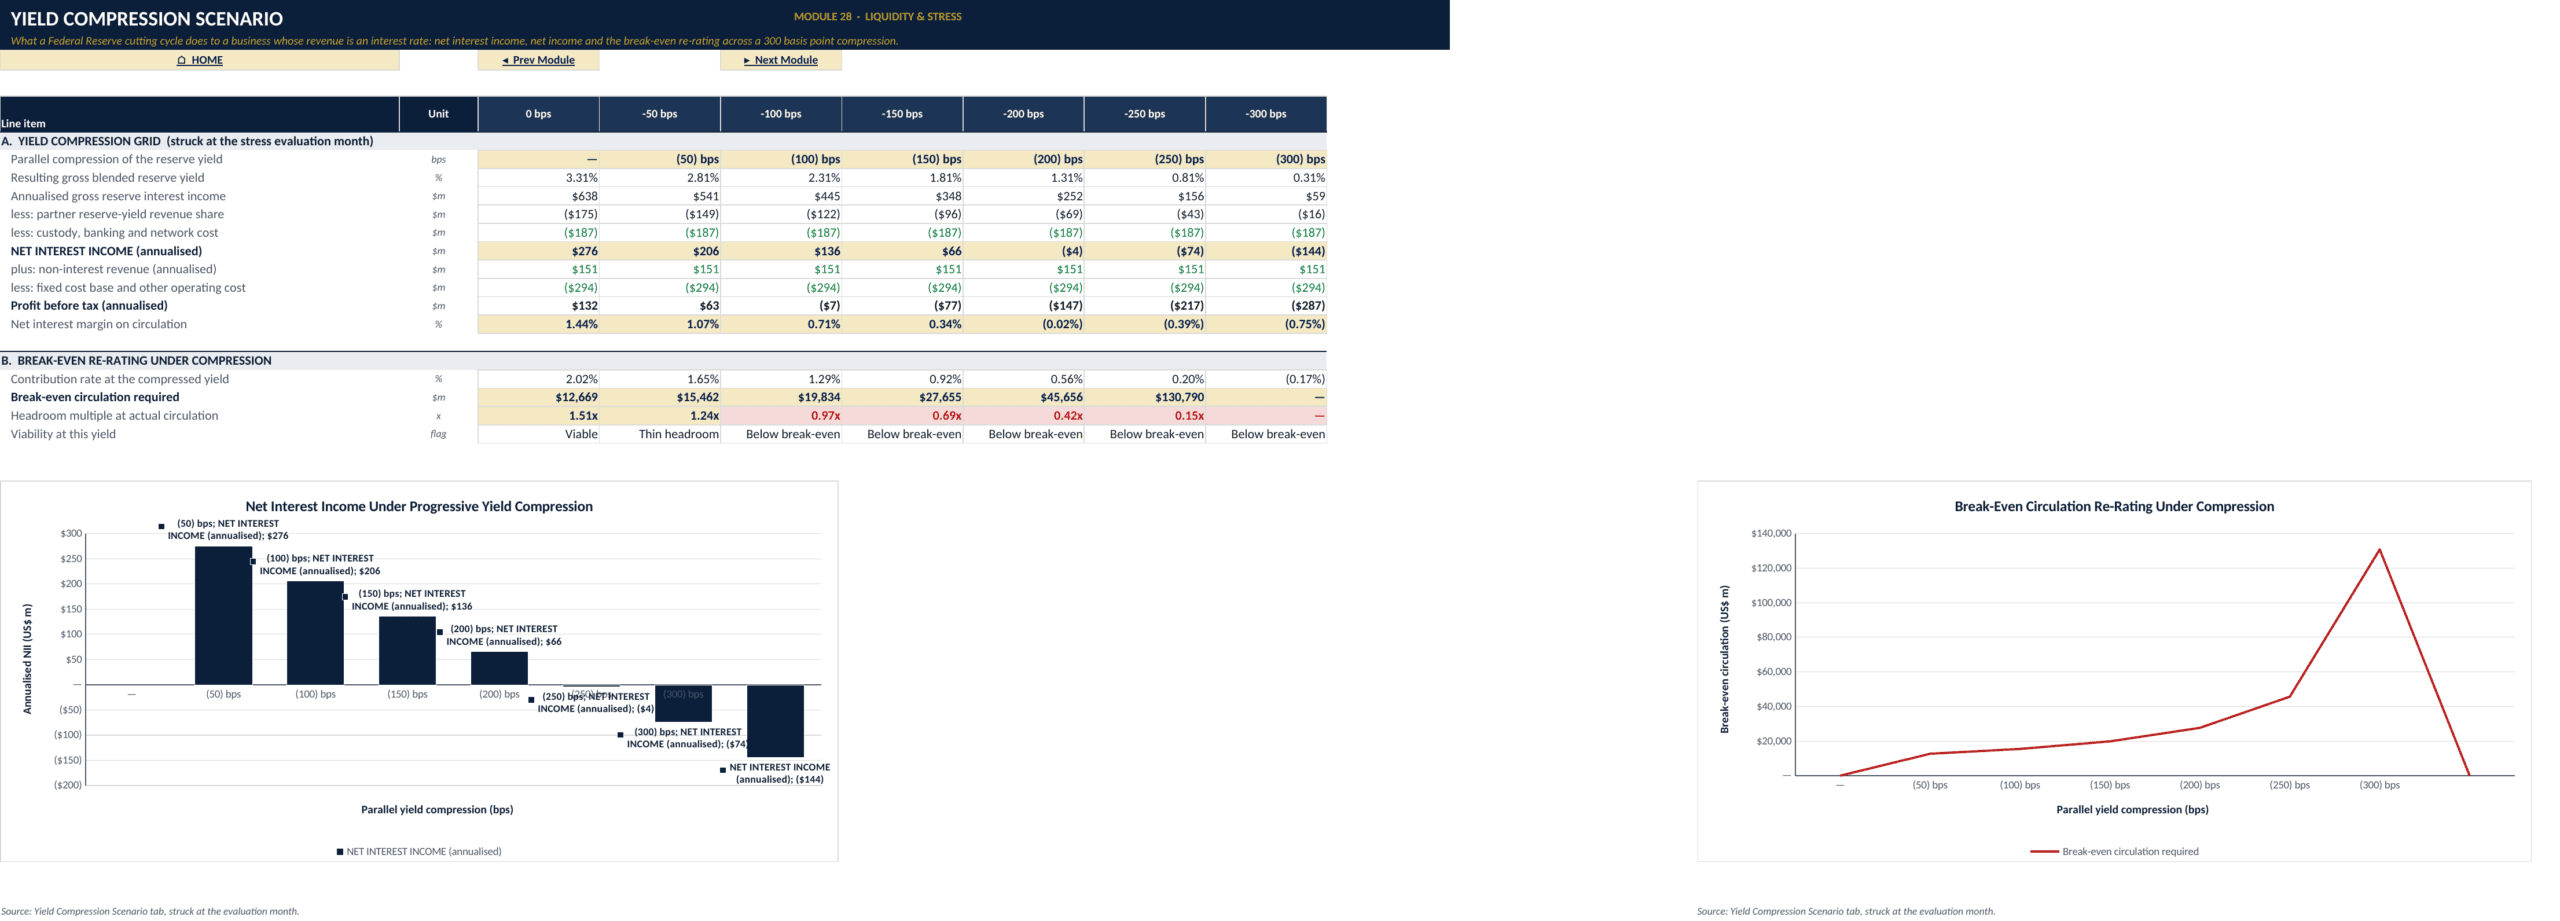
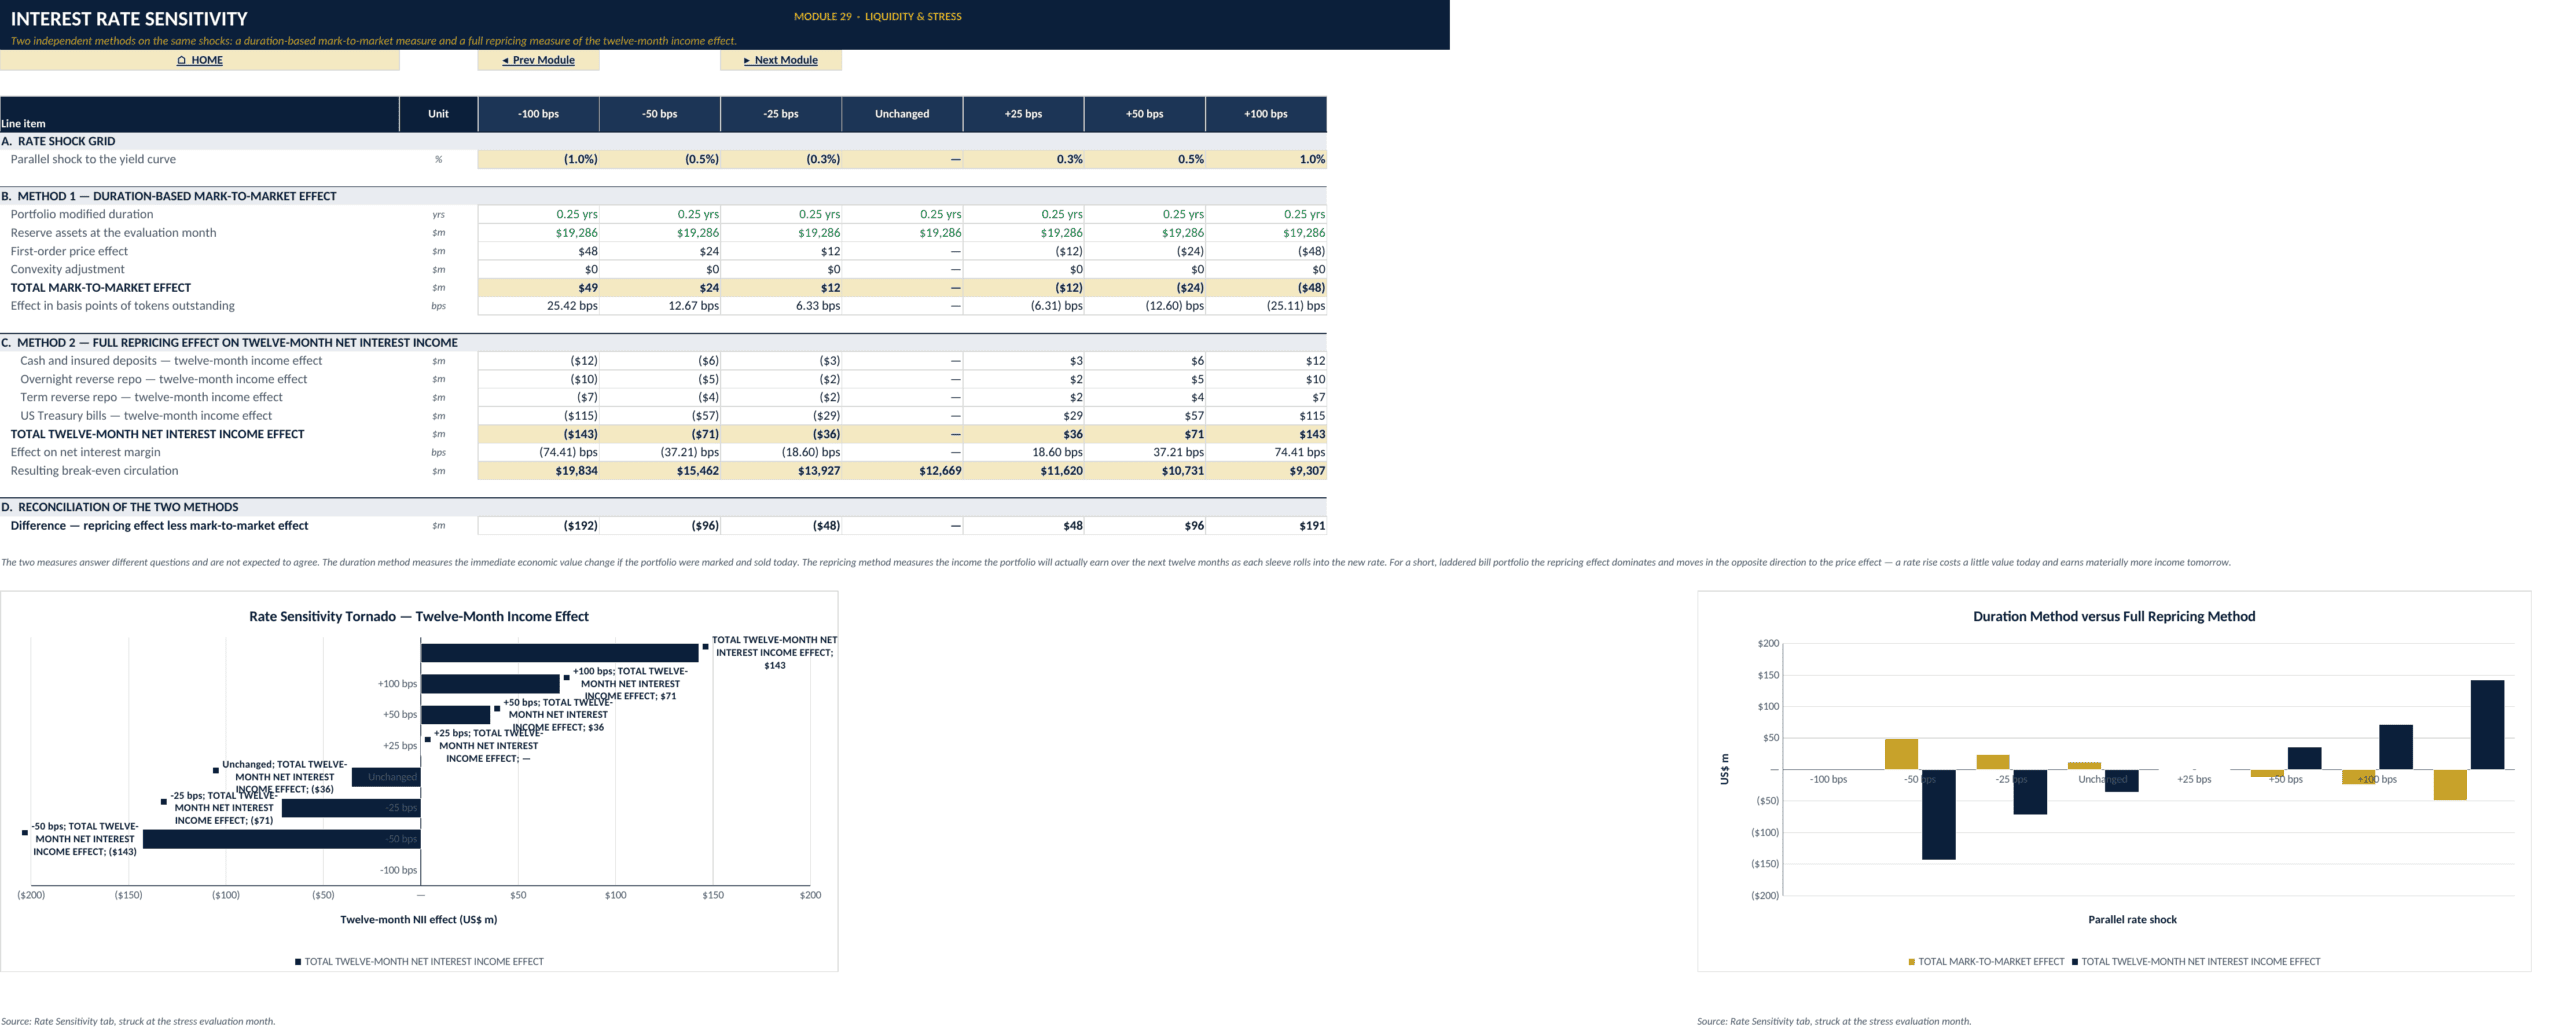
Redemption Stress Testing evaluates four run severities across three settlement horizons and measures monetisable liquidity and funding gaps. Liquidation Waterfall applies a sequential reserve-monetisation order, while Forced Liquidation Loss calculates the economic loss from haircuts and market impact. Break-Even Circulation solves the circulation required to cover the fixed cost base. Yield Compression Scenario shows how lower reserve yields affect net interest income, earnings, and break-even. Rate Sensitivity compares duration-based mark-to-market effects with full repricing of income. Peg Stability models secondary-market deviation from par using liquidity, redemption pressure, and coverage conditions.
📊 Financial statements, valuation, and dashboards
The workbook includes a linked Income Statement, Balance Sheet, and Cash Flow Statement over the 60-month forecast with FY1-FY5 summaries. Reserve assets are shown separately from corporate assets in the balance-sheet structure.
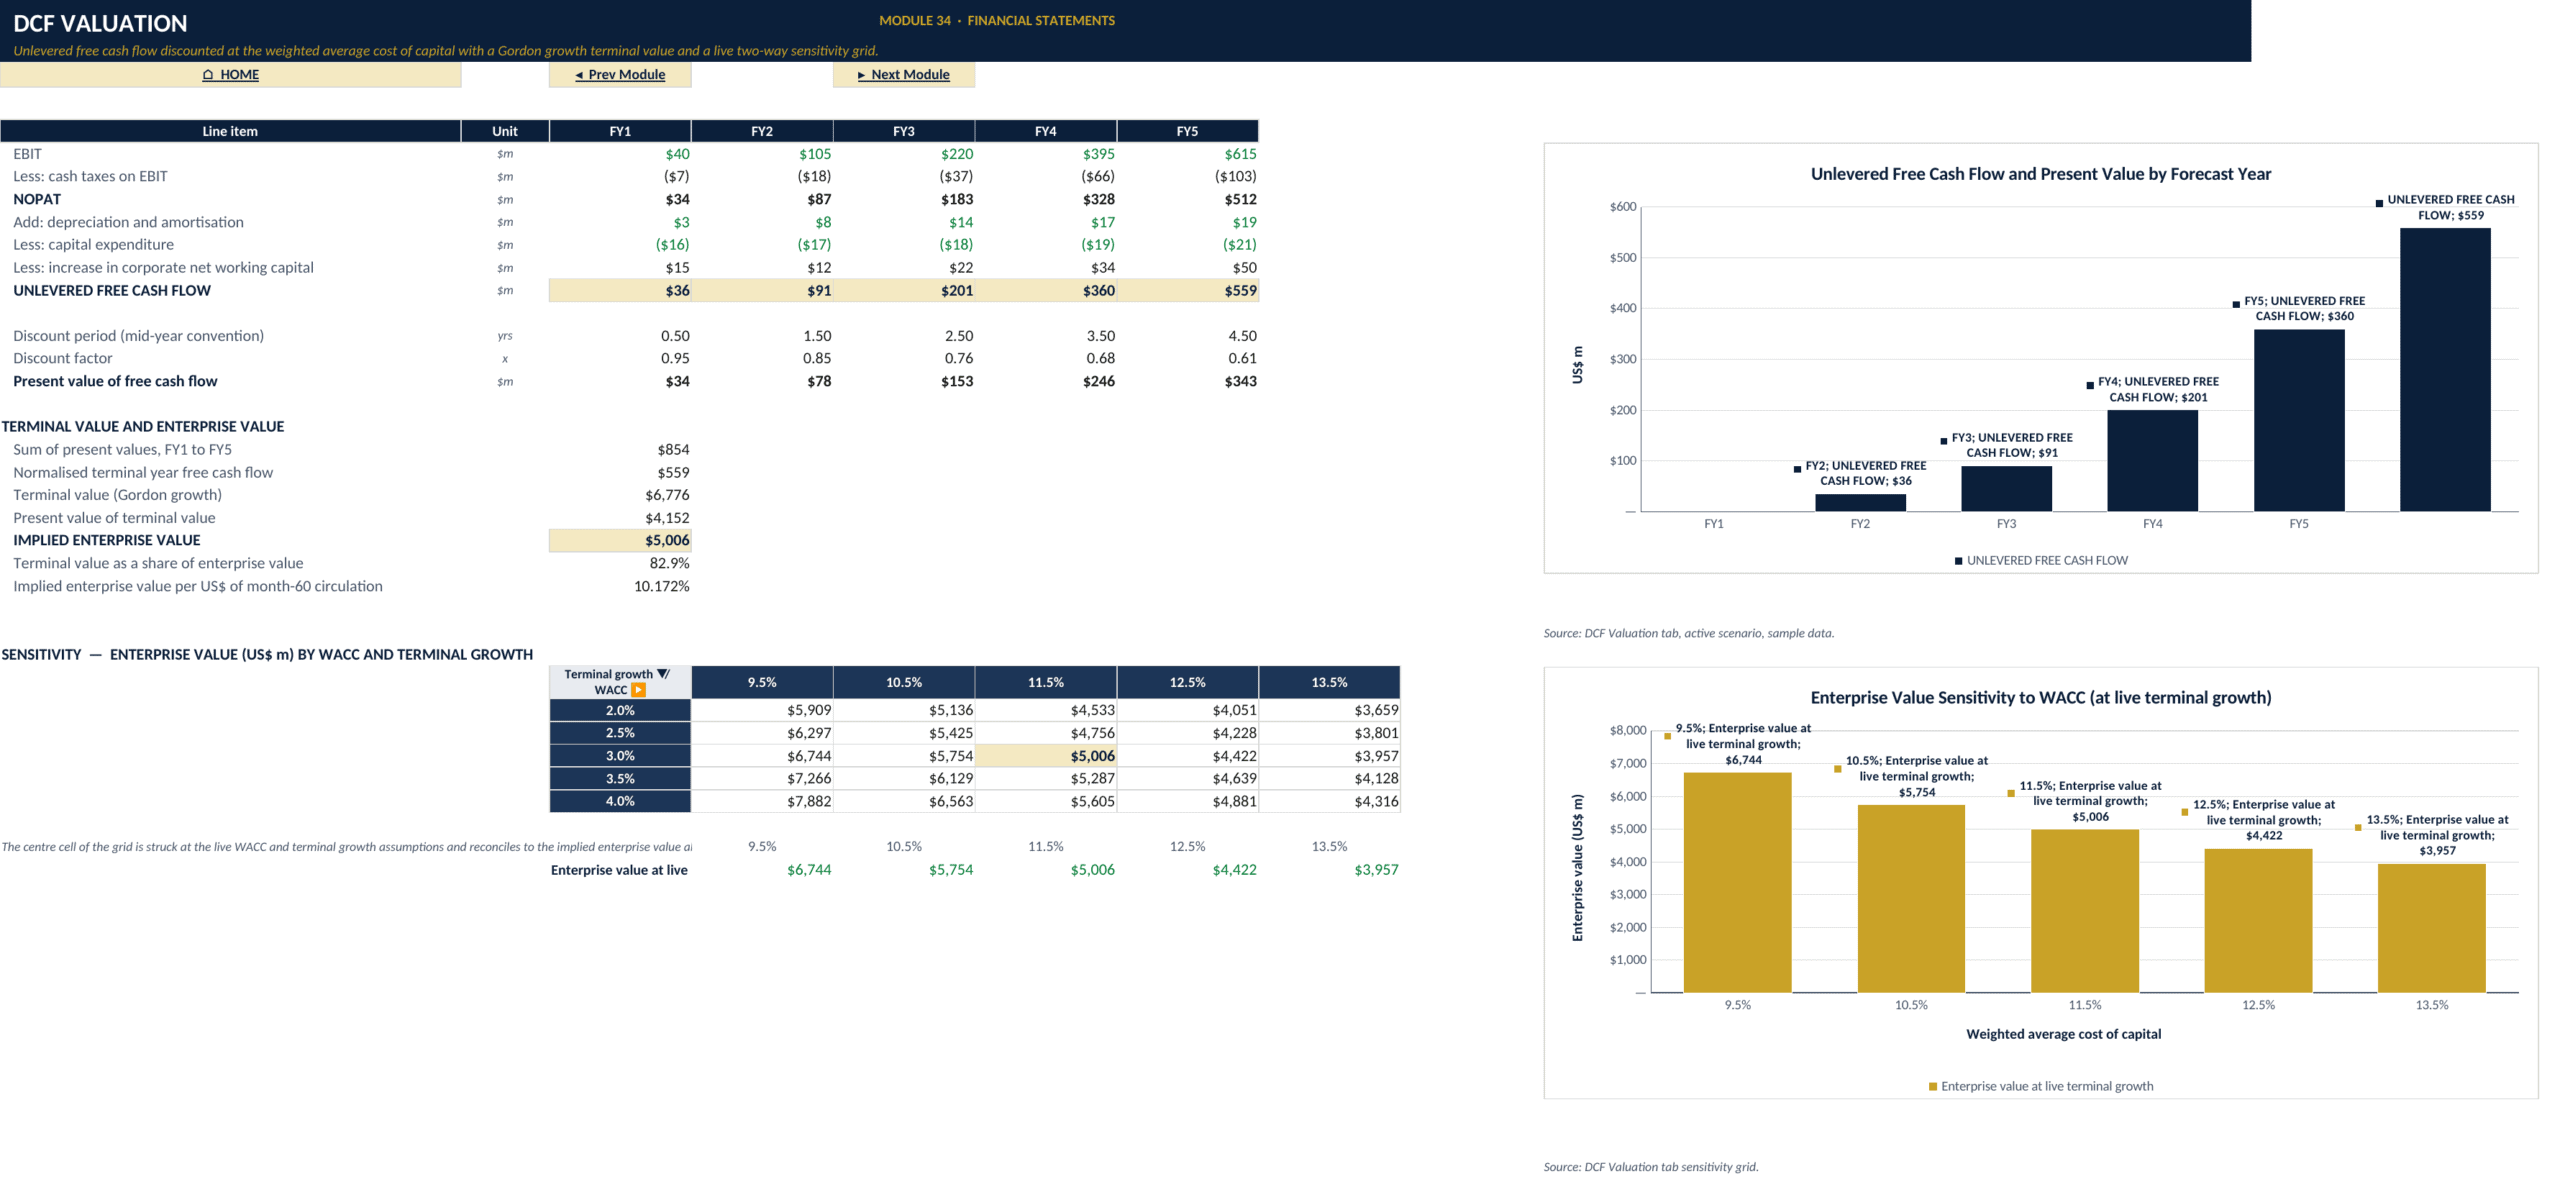
DCF Valuation converts operating forecasts into unlevered free cash flow, applies WACC and Gordon-growth terminal value assumptions, and includes a two-way enterprise-value sensitivity grid.
Three dedicated dashboards summarize the model:
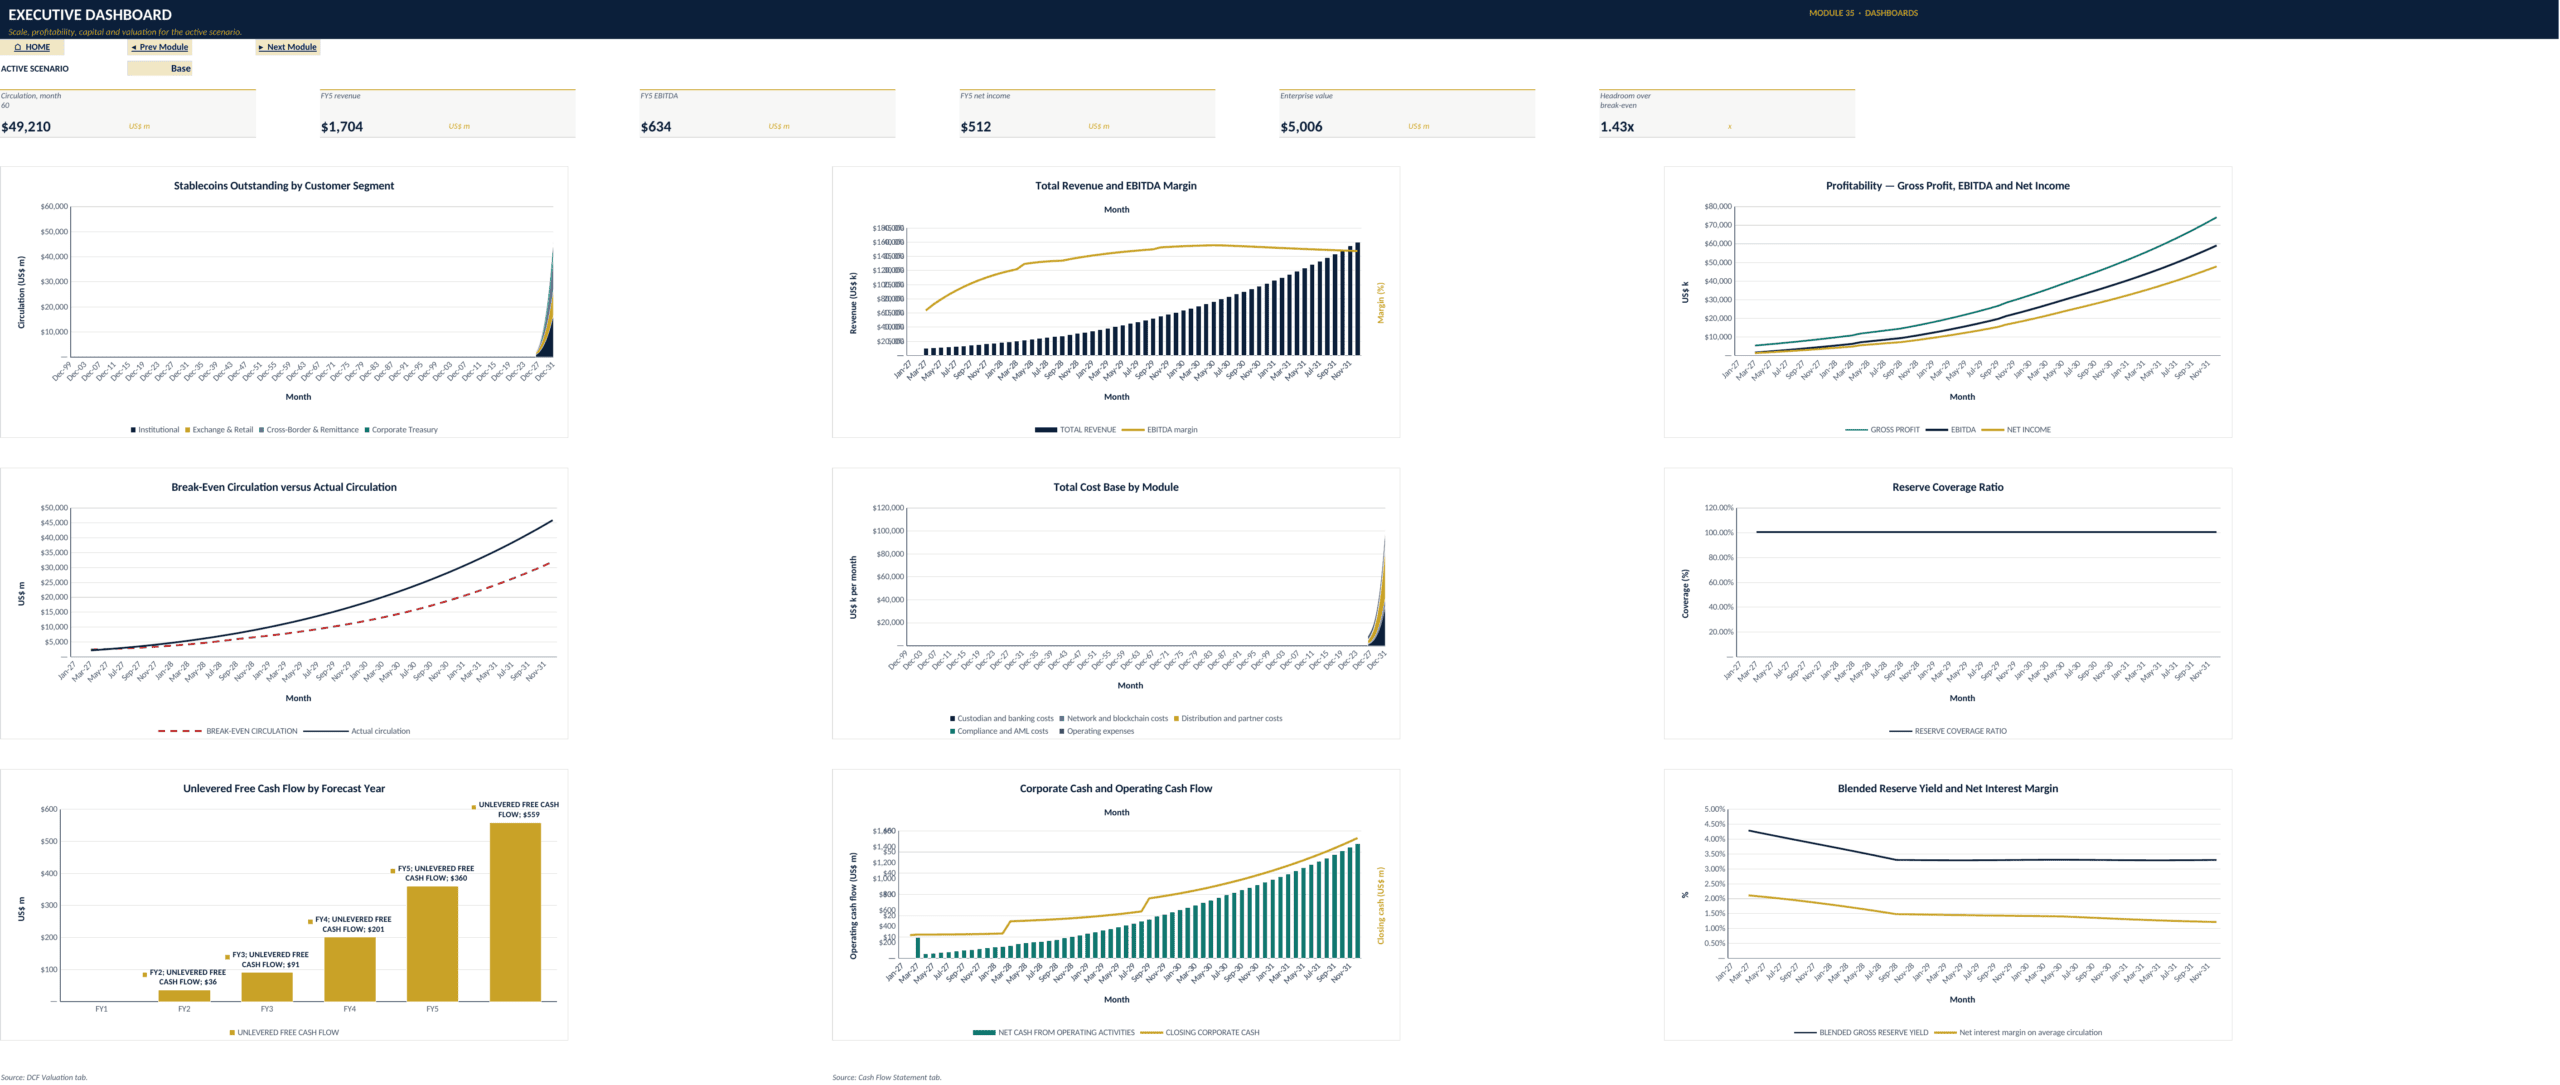
- Executive Dashboard: circulation, revenue, EBITDA, net income, enterprise value, break-even headroom, profitability, cost base, cash generation, reserve coverage, and reserve-yield/NIM trends.
- Liquidity & Risk Dashboard: reserve coverage, immediate liquidity, run funding gaps, waterfall coverage, liquidation loss, capital coverage, peg stability, and asset/liability duration.
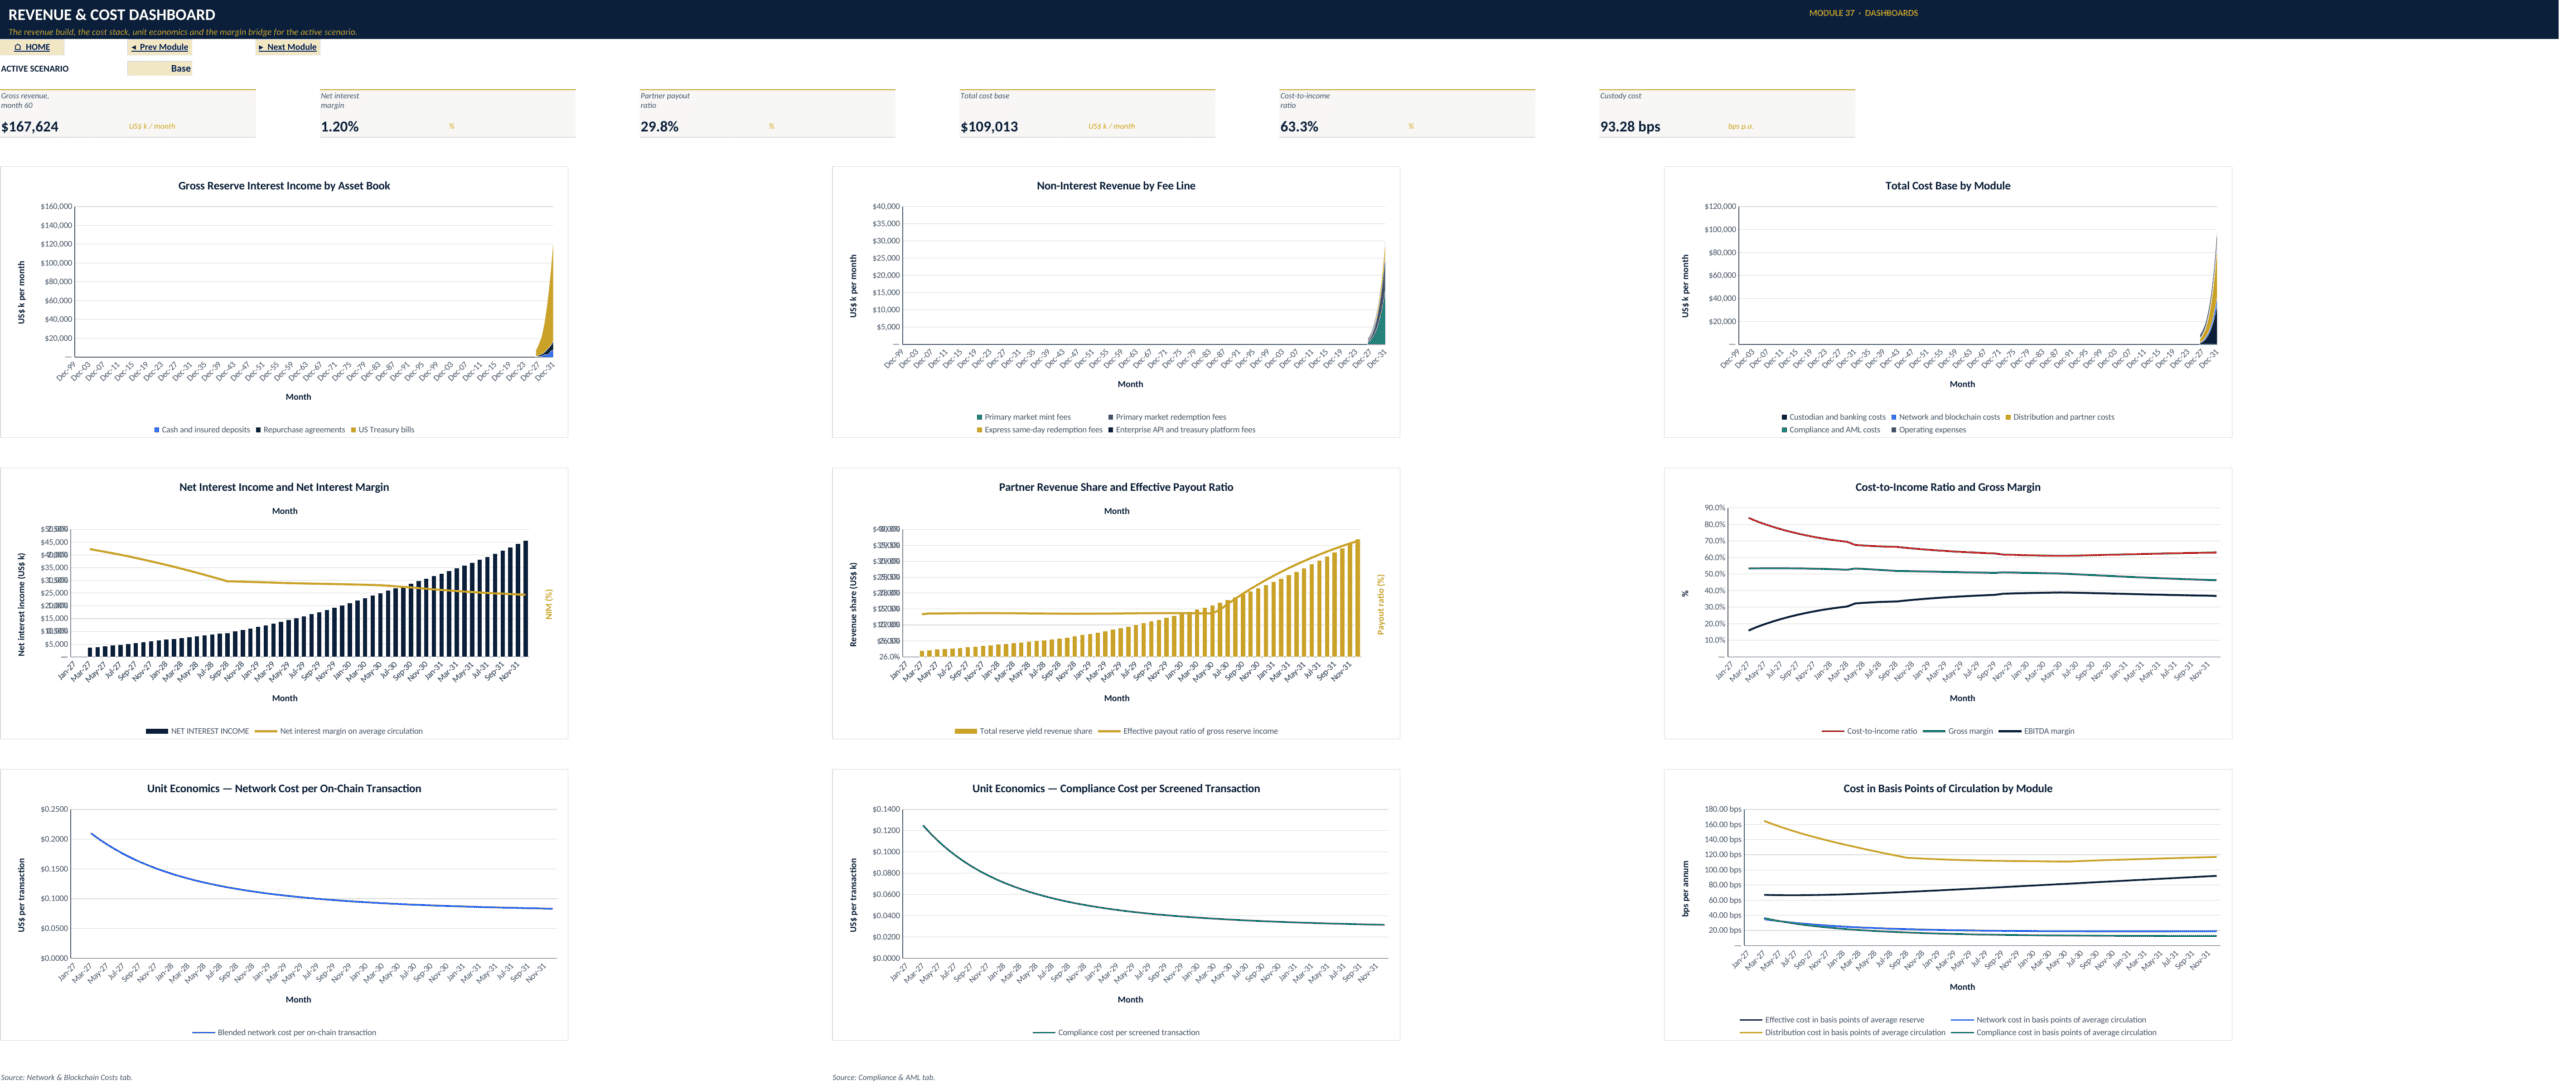
- Revenue & Cost Dashboard: reserve revenue, net interest margin, partner payout ratio, operating cost stack, cost-to-income, and custody economics.
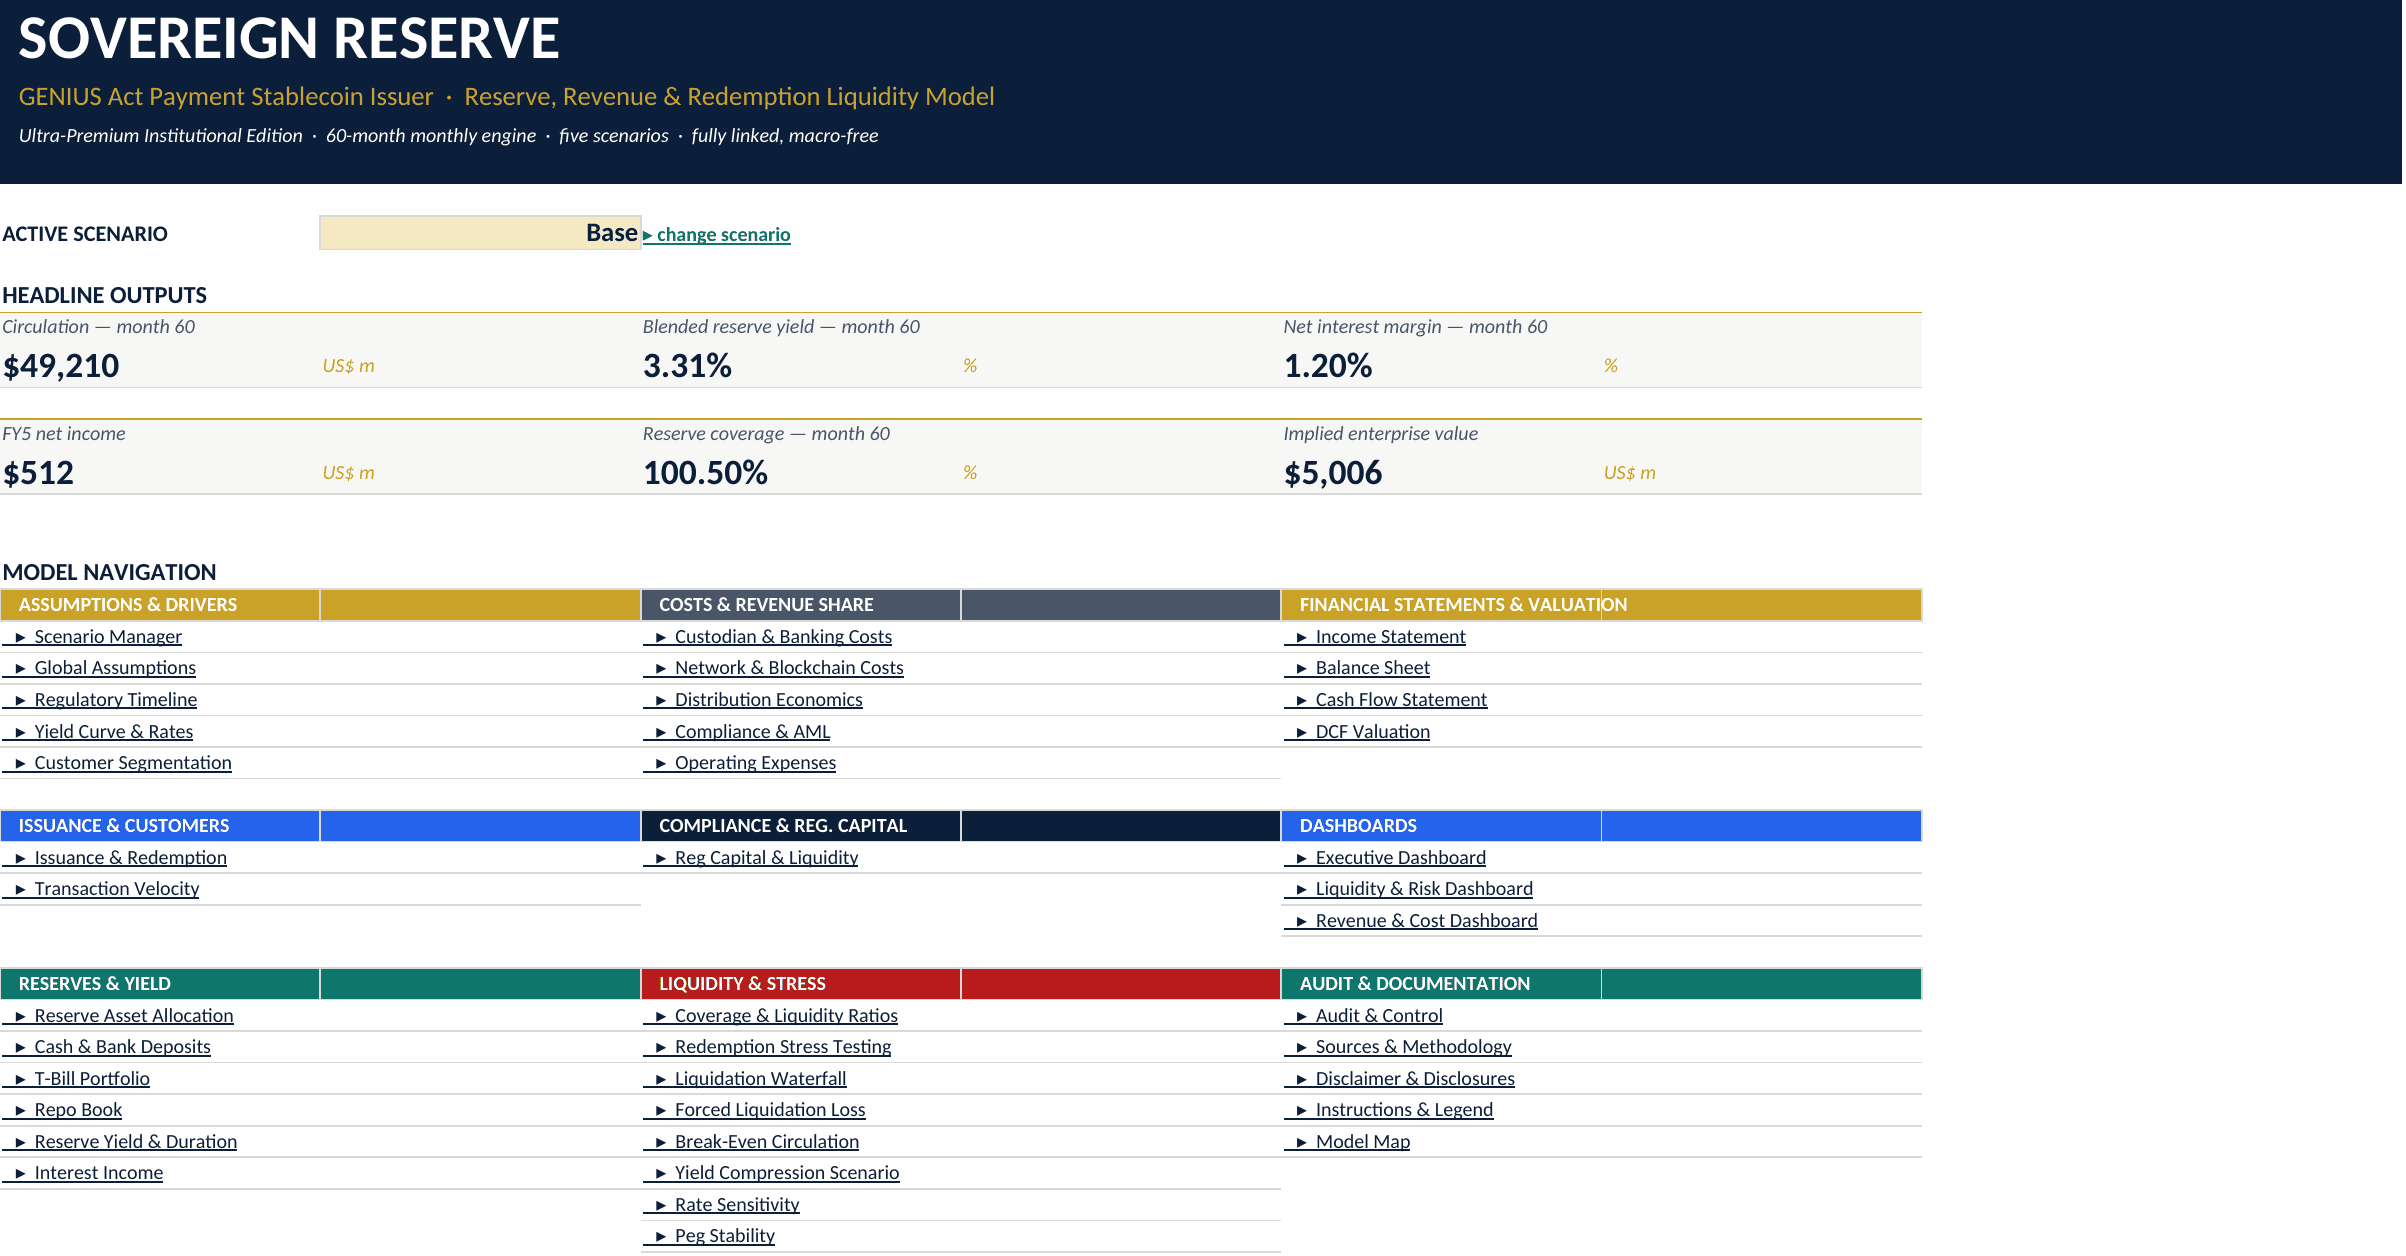
The HOME sheet provides live headline outputs and navigation. Model Map, Instructions & Legend, Audit & Control, Sources & Methodology, and Disclaimer & Disclosures provide navigation, methodology, model conventions, structural control outputs, and workbook-specific disclosures.
💡 Recommended use cases
- Build a 60-month operating and financial plan for a payment-stablecoin issuer.
- Forecast circulation, issuance, redemptions, customer mix, transaction volume, and velocity.
- Plan reserve allocation across cash, insured deposits, Treasury bills, and reverse repo.
- Test profitability and net interest margin under different policy-rate and reserve-yield paths.
- Analyse custody, banking, blockchain, compliance, partner-sharing, and operating-cost economics.
- Evaluate partner fee, rebate, revenue-share, and distribution economics alongside reserve income.
- Assess cash flow, capital needs, reserve segregation, liquidity headroom, and financial-statement impacts.
- Run redemption, funding-gap, liquidation-waterfall, forced-loss, and peg-stability analyses.
- Measure break-even circulation and operating leverage as the platform scales.
- Compare Base, Bull, Bear, Yield-Compression, and Run-Stress cases from one scenario selector.
- Perform rate and valuation sensitivities, including WACC and terminal-growth enterprise-value analysis.
- Support treasury, FP&A, risk, strategy, investment-committee, lender, board, and transaction-review work.
👥 Intended users
Suitable for stablecoin issuers, digital-asset finance teams, treasury teams, fintech operators, corporate development teams, investors, lenders, consultants, advisers, risk teams, FP&A professionals, and analysts who need a transparent Excel framework for linking reserve economics with operating performance and liquidity risk.
📦 Delivered files
The core product is a client-ready .xlsx workbook with 40 worksheets and no requirement for macros. The seller upload package also includes a 40-page full-sheet PDF preview.
Similar ProductsOther customers were also interested in...



 eFinancialModels
Electric Vehicle (EV) Charging Station Financial M...
With this comprehensive 5- or 10-year monthly tool, investors can assess the viability of setting up... Read more

Financial Model for Mobile App | Mobile App Busine...
The Mobile App Financial Plan Template in Excel allows you to develop financial projections when lau... Read more

 HenrySheykin
Food Truck Financial Model Excel Template
The Food Truck Financial Model helps entrepreneurs, founders, business owners, consultants, and anal... Read more

Green Hydrogen Production from Wind Energy Financi...
The Green Hydrogen from Wind Financial Model aims to comprehensively forecast a horizon of 40 years ... Read more

Simple Mutual Non-Disclosure Agreement Template
Protect your business secrets with ease using our Simple Mutual Non-Disclosure Agreement Template. S... Read more

Solar Energy Financial Model
The Solar Energy Financial Model Spreadsheet Template in Excel assists you in preparing a sophistica... Read more

 Peter Graf
The Customer-Centric Financial Model for Restauran...
Starting a restaurant without a financial plan is like driving a car blindfolded. You wouldn´t do i... Read more
You must log in to submit a review.