
0 ITEMS

Mobile Car Detailing Financial Model | 5-Year Forecast, Memberships, Multi-Van Growth, Financing, Break-Even & KPI Dashboard
Build a complete 60-month operating and financial plan for a mobile car detailing business that may grow from one van to a multi-van fleet. This Excel model connects service pricing, job mix, memberships, customer acquisition, operating capacity, technician staffing, vehicle investment, financing, profitability, cash flow and owner economics in one integrated workbook. It is designed for buyers who need to understand not only whether a detailing business can generate revenue, but also how demand, labor, utilization, marketing, service mix and fleet expansion interact over time. Seller-supplied and already tested; no Studio workbook audit was performed.






🚐 Mobile Car Detailing Financial Model
Build a complete 60-month operating and financial plan for a mobile car detailing business that may grow from one van to a multi-van fleet. This Excel model connects service pricing, job mix, memberships, customer acquisition, operating capacity, technician staffing, vehicle investment, financing, profitability, cash flow and owner economics in one integrated workbook. It is designed for buyers who need to understand not only whether a detailing business can generate revenue, but also how demand, labor, utilization, marketing, service mix and fleet expansion interact over time.
Seller-supplied and already tested; no Studio workbook audit was performed.
💡 The Buyer Problem This Model Solves
A mobile detailing company can look attractive at the revenue level while still creating cash pressure when vans are added too early, technicians are underutilized, acquisition costs rise, membership growth slows or fixed operating costs expand faster than contribution margin. A simple sales forecast does not answer the critical operating questions: How many jobs can the current team actually complete? When should another van be activated? What happens to payroll when capacity expands? How much cash is required for capex and debt service? Which services drive the strongest economics? How sensitive is profit to pricing and demand?
This workbook is structured to answer those questions through linked monthly schedules and decision-oriented outputs. The active Base, Best or Worst scenario flows through price, demand, variable cost, fixed cost and marketing-efficiency multipliers so the user can assess upside and downside without rebuilding the model.
⚙️ Model Workflow
1. Select the active scenario on the Sensitivity & Scenario sheet.
2. Update the blue editable assumptions covering pricing, service mix, operations, costs, marketing, staffing and fleet financing.
3. Review the detailed revenue, job-capacity, cost, CAC, staffing and van-financing schedules.
4. Evaluate the P&L, cash flow, break-even position, fleet growth, owner earnings and KPI Dashboard.
5. Use the one-variable and two-variable sensitivity tables to test the economics around Month 12.
✏️ Editable Inputs
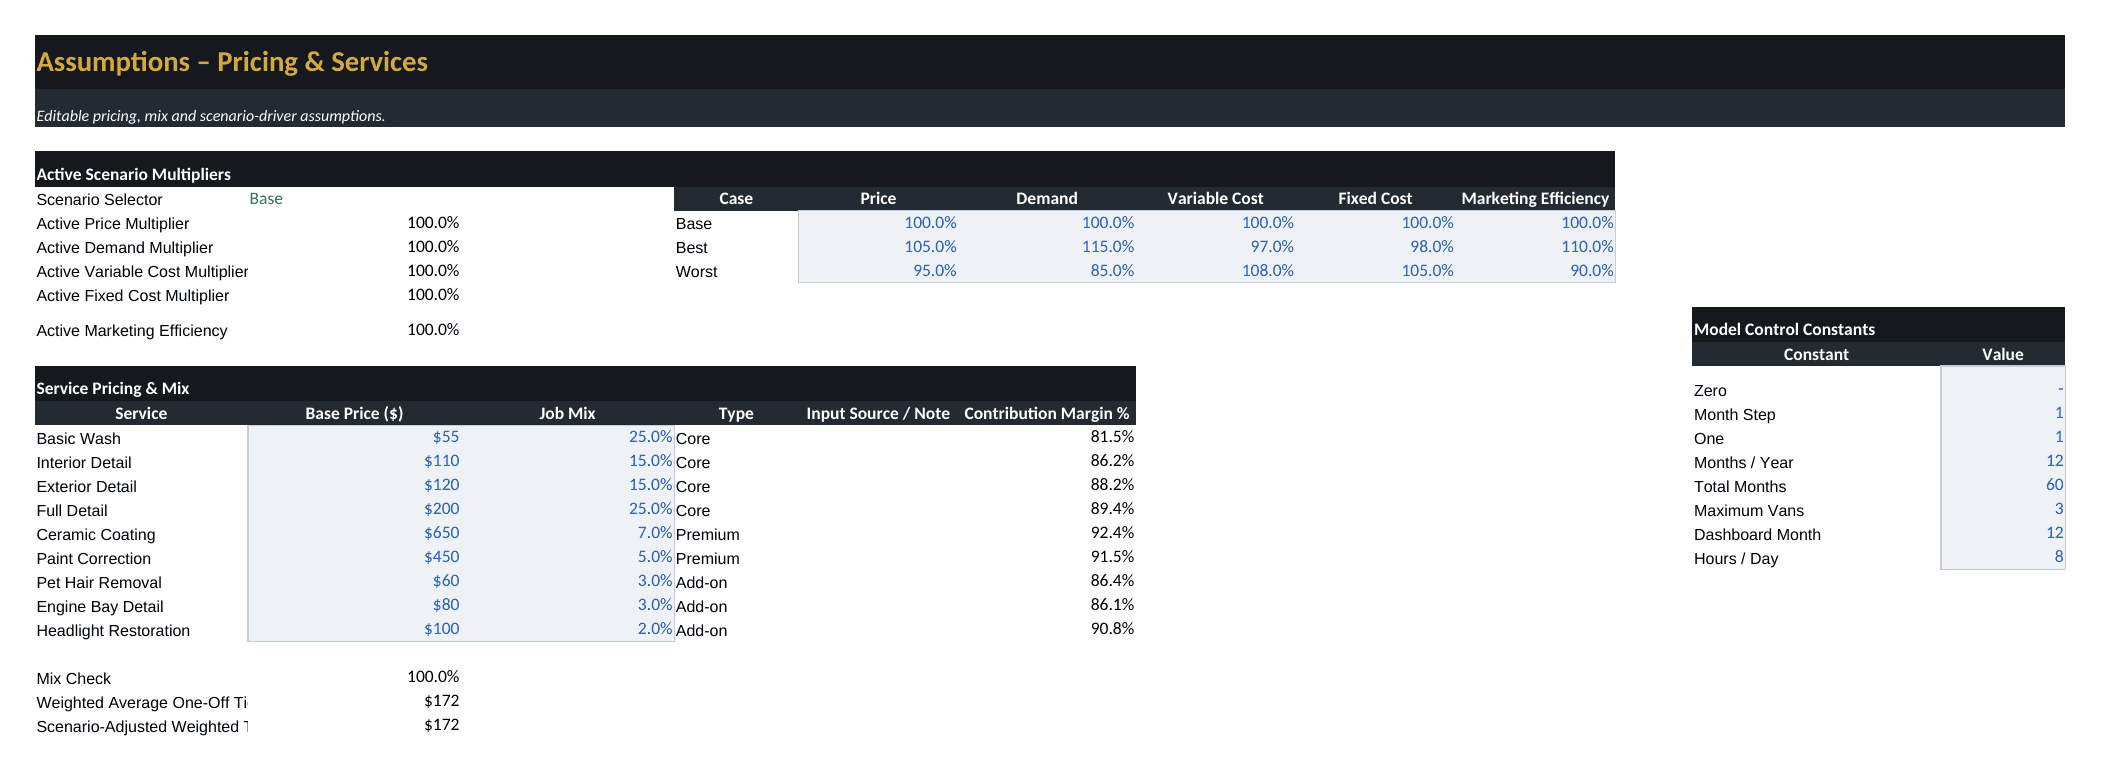
The workbook provides dedicated assumption sheets rather than forcing users to edit calculations. Inputs include service prices and job mix; Base/Best/Worst scenario multipliers; jobs per van and technician; weekday and weekend workdays; demand multipliers; travel miles and service radius; monthly demand growth; capacity safety factors; service times; fuel, insurance, maintenance, software, storage, phone and other operating costs; payment processing and planning tax rates; chemicals, water and consumables by service; Google and Facebook advertising; cost per lead; lead-to-booking, referral, repeat-customer and membership conversion rates; membership churn, prices, mix and visits; technician pay, commissions, payroll burden, tips and owner draw; van purchase price, equipment capex, APR, loan term, down payment, useful life, residual value, expansion timing or utilization triggers, and initial cash.
🧮 Core Calculations and Operating Schedules
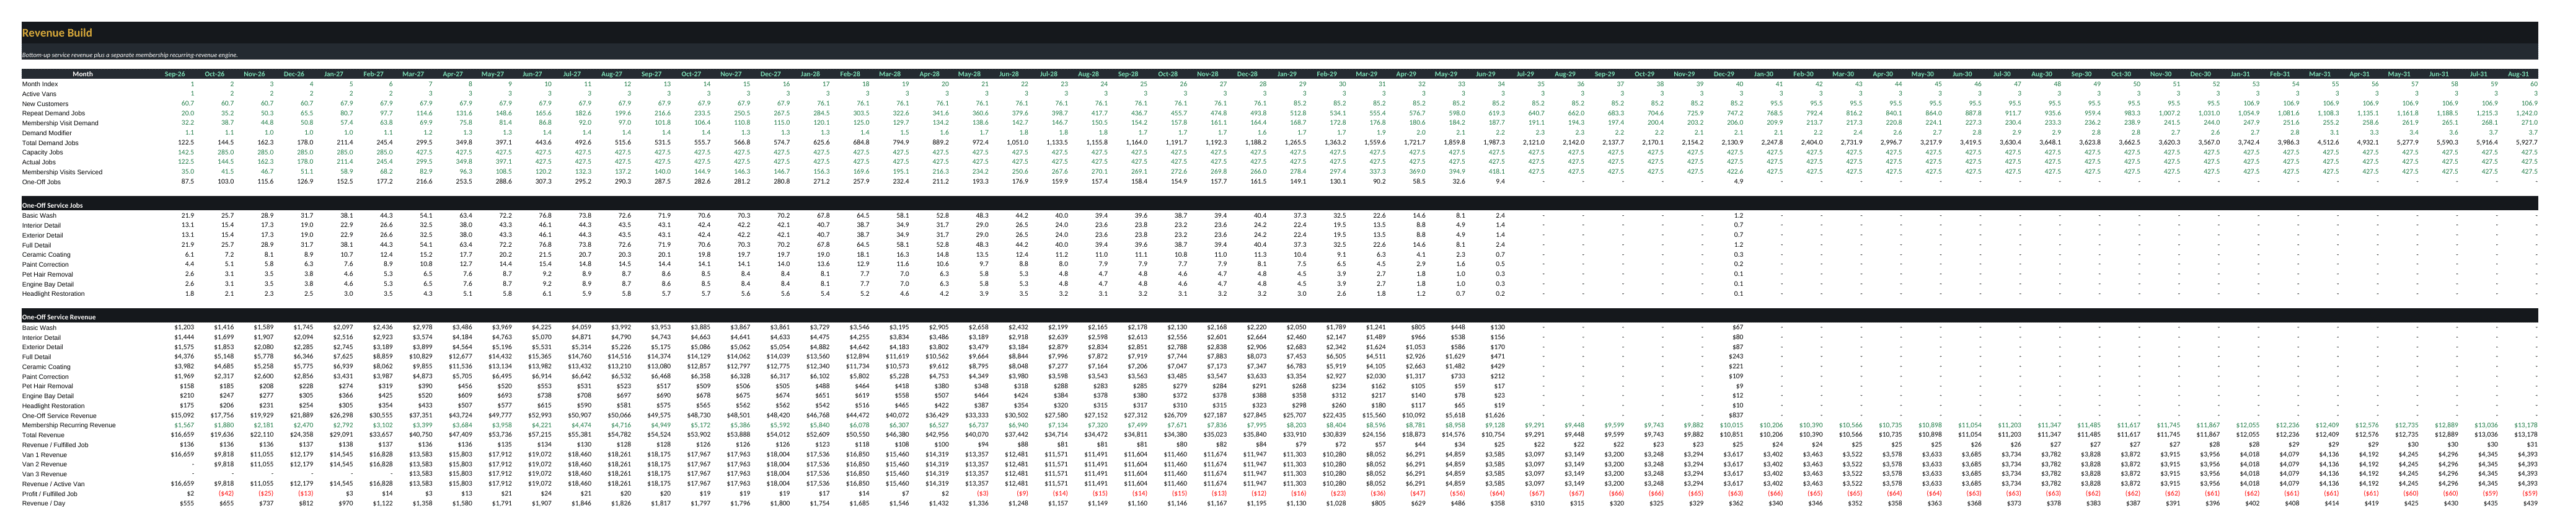
Revenue Build develops the 60-month revenue engine across one-off detailing services and recurring memberships. It incorporates the scenario-adjusted ticket, service mix, demand progression, membership activity and recurring revenue.
Job & Capacity Model links available vans, technicians, service hours and operating days to practical job capacity and utilization. This is the operational bridge between market demand and what the business can actually deliver.
Cost Build (COGS + Opex) combines service-level direct costs with fuel and fixed operating expenses so gross profit and operating cost behavior move with business activity.
Marketing & CAC Model tracks paid acquisition, referrals, repeat demand, new customers, new and active members, membership revenue, CAC, customer LTV, LTV/CAC and payback economics.
Staffing & Commission Model converts active vans into technician requirements and tracks base payroll, employer burden, commission payouts, tips, labor cost per technician and revenue per technician.
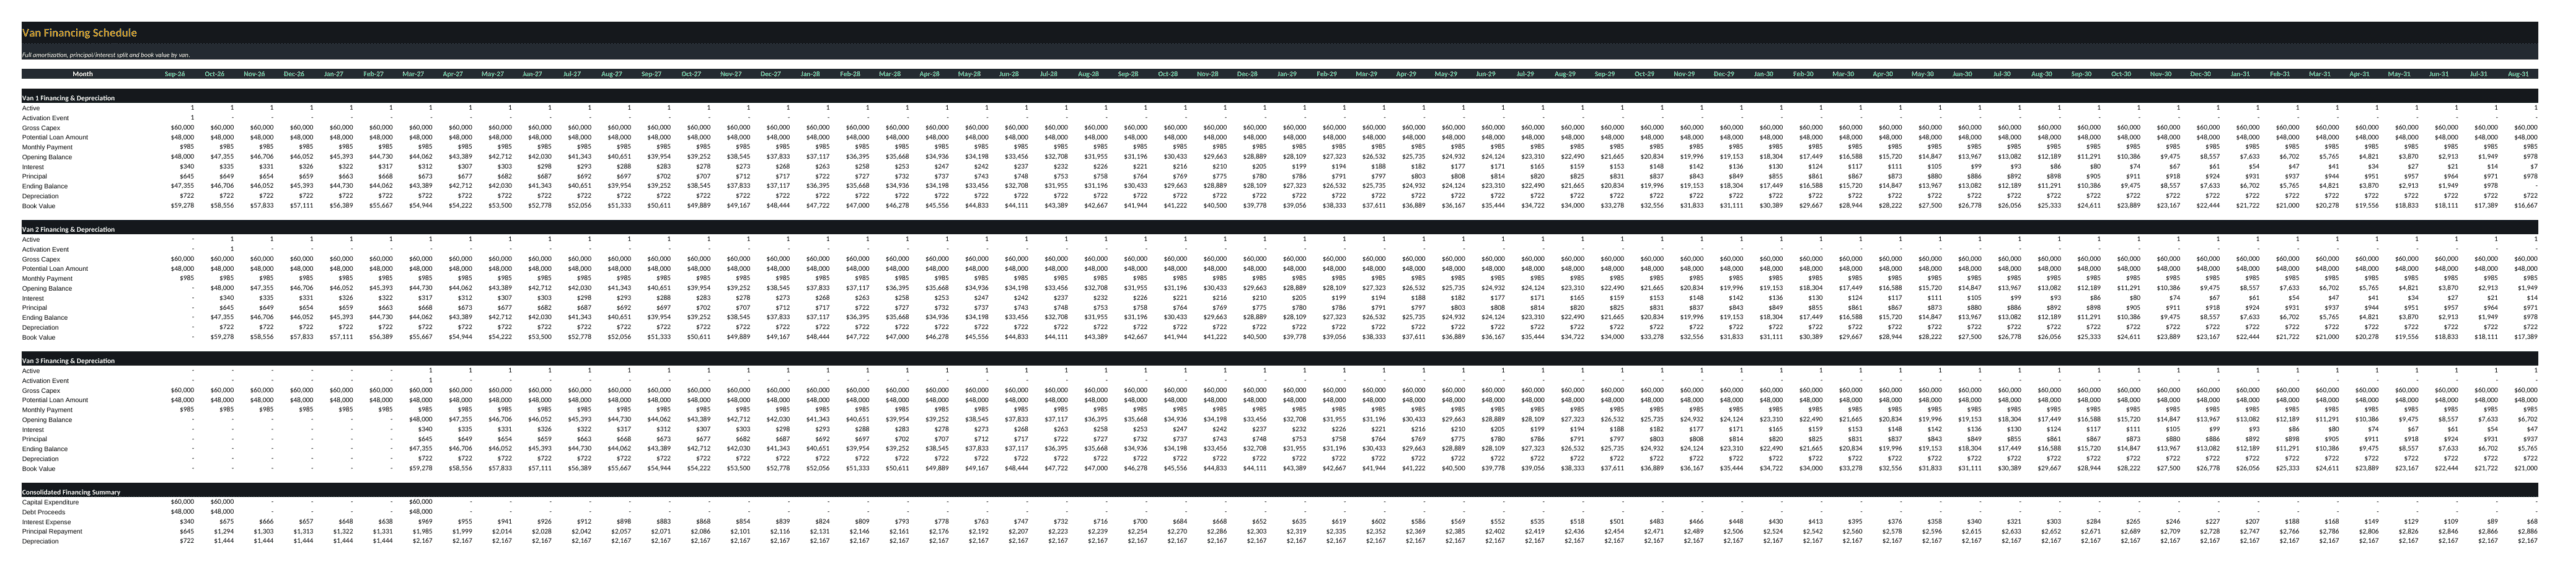
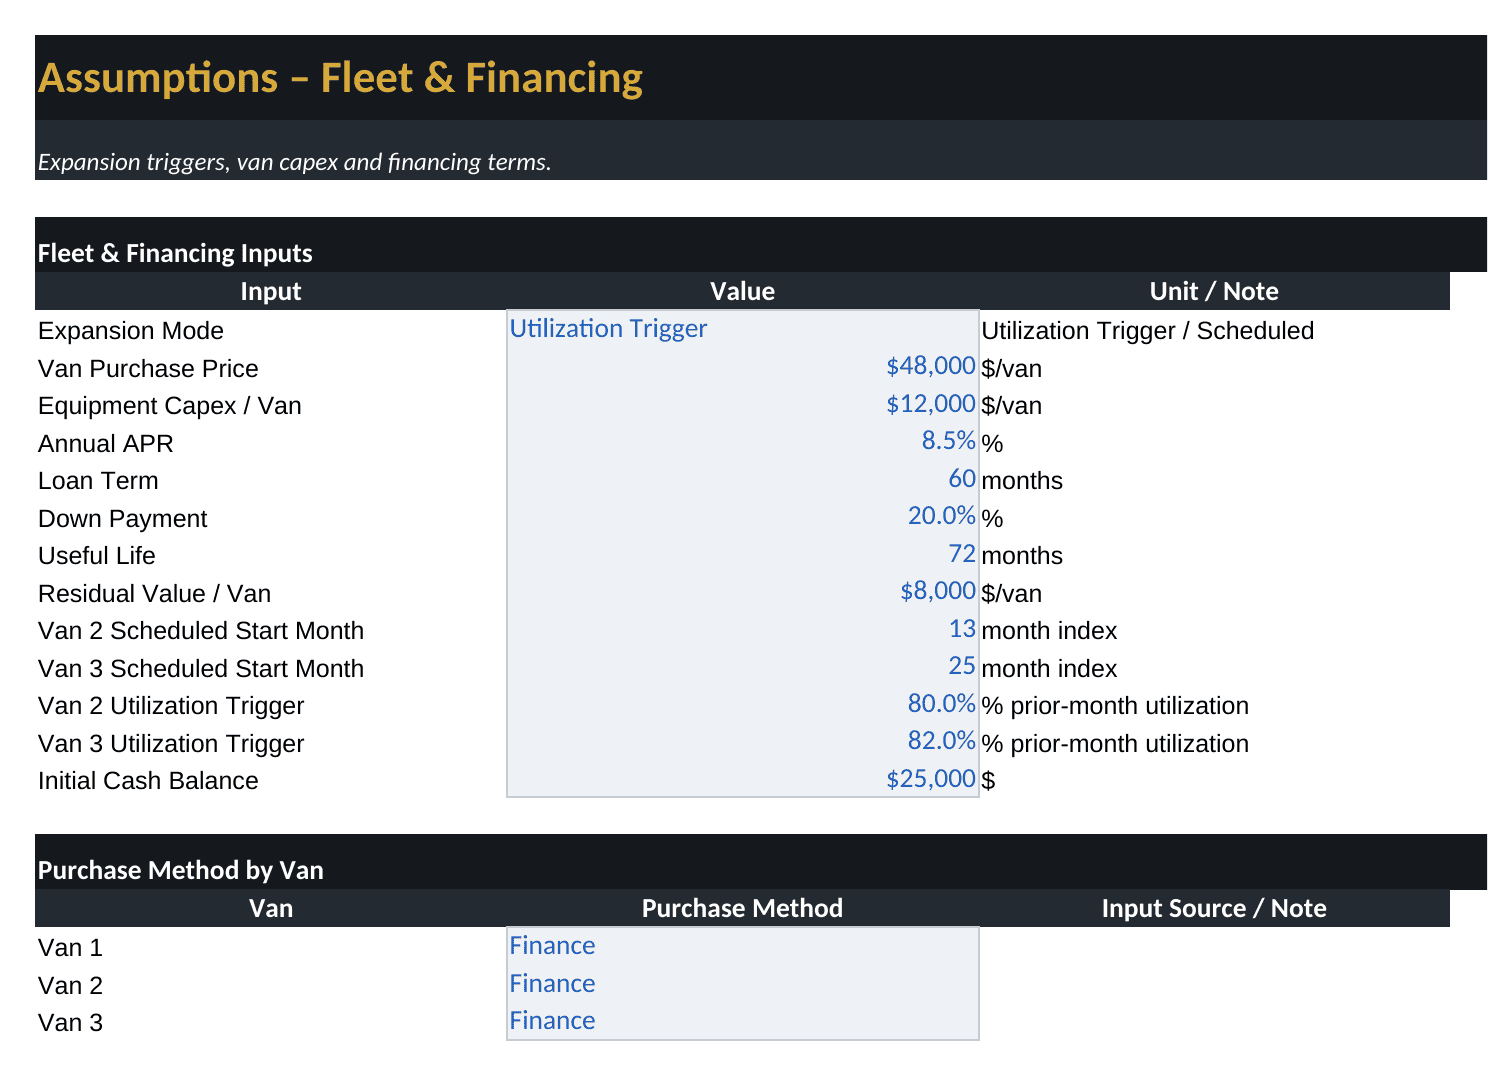
Van Financing Schedule provides van-level capex, loan amount, monthly payment, opening and ending debt balances, interest, principal, depreciation and book value. It supports a fleet of up to three vans under the workbook’s current design.
📊 Financial Statements and Decision Outputs
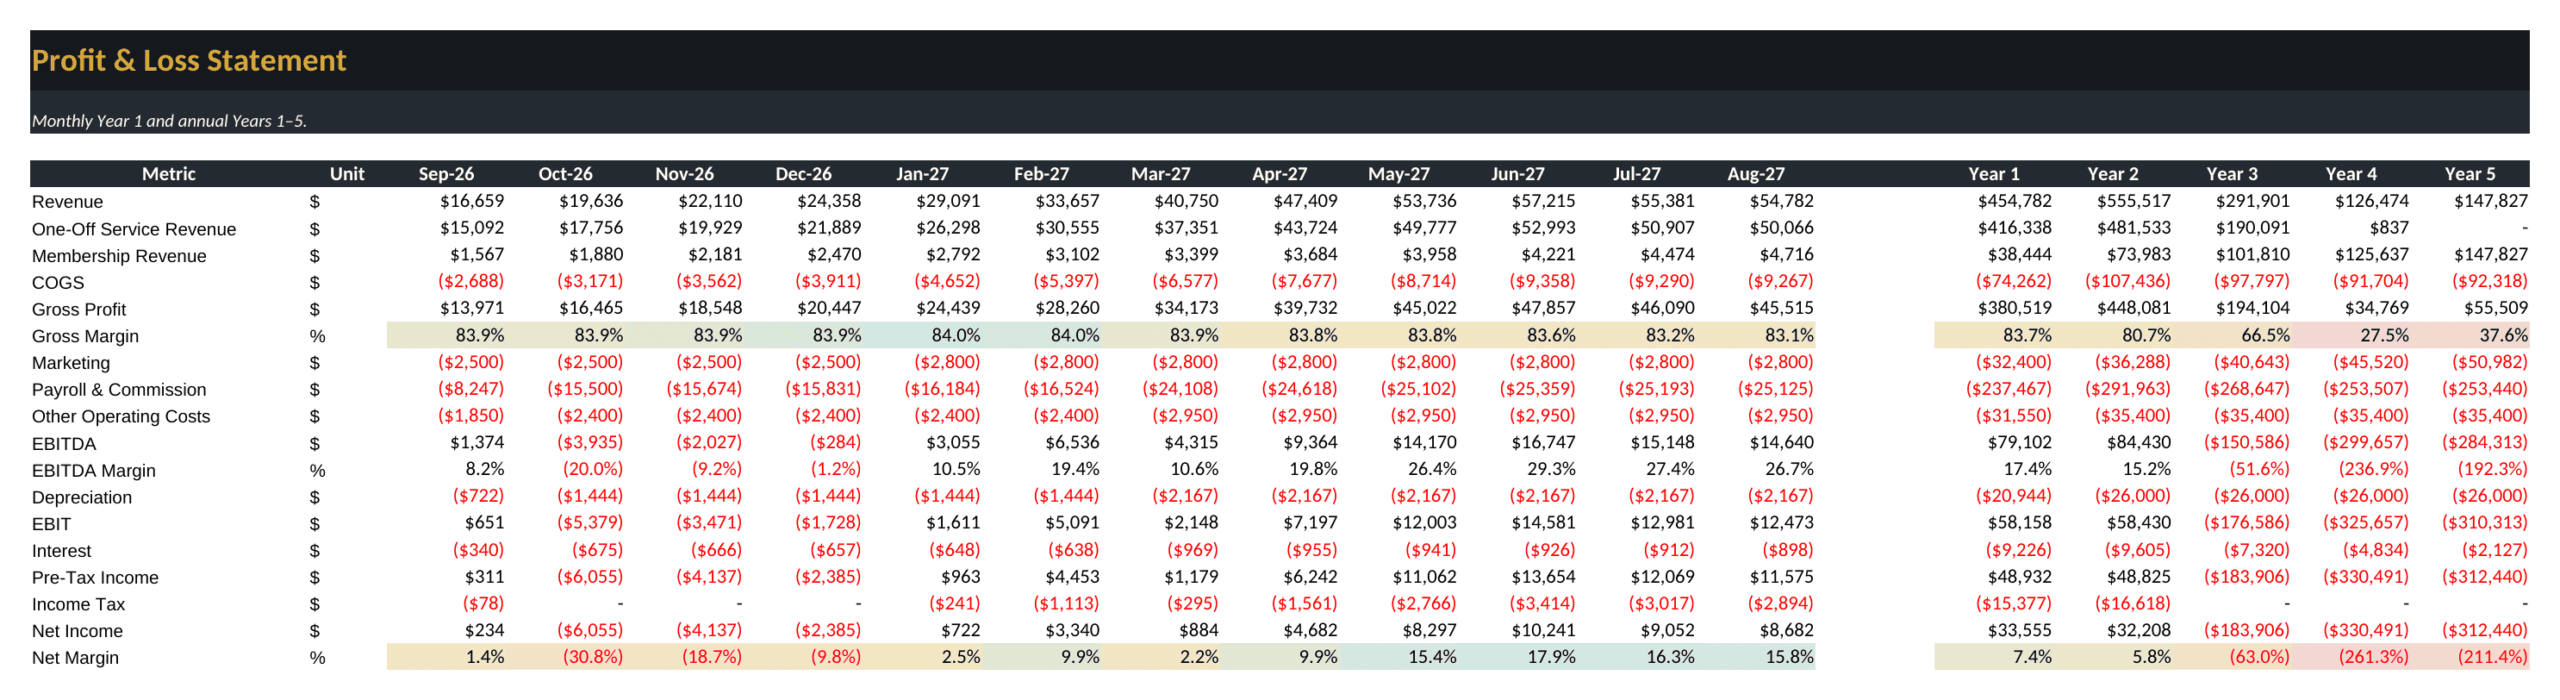
Profit & Loss Statement shows monthly Year 1 results and annual Years 1-5, including revenue, one-off and membership revenue, COGS, gross profit and margin, marketing, payroll and commission, other operating costs, EBITDA, EBIT, interest, pre-tax income, tax, net income and margins.
Cash Flow Statement bridges net income to operating cash flow, capital expenditure, debt proceeds, principal repayment, owner draws, net cash movement and ending cash. This makes the timing impact of van investment and financing visible rather than hiding it inside an income statement.
Break-Even Analysis calculates revenue per job, variable cost per job, contribution per job, fixed operating costs, break-even jobs per month and day, actual jobs, margin of safety and above/below break-even status.
Fleet Growth Model shows the progression from one to two to three vans, active-van timing, utilization, van-level revenue, van-level net profit, payback indicators and allocated costs. Expansion can be driven by utilization triggers or scheduled start months according to the selected fleet assumptions.
Owner Earnings & Compensation separates business net income from owner salary, owner draw, total owner cash earnings, retained profit and retained cash balance.
🎛️ Scenario and Sensitivity Analysis
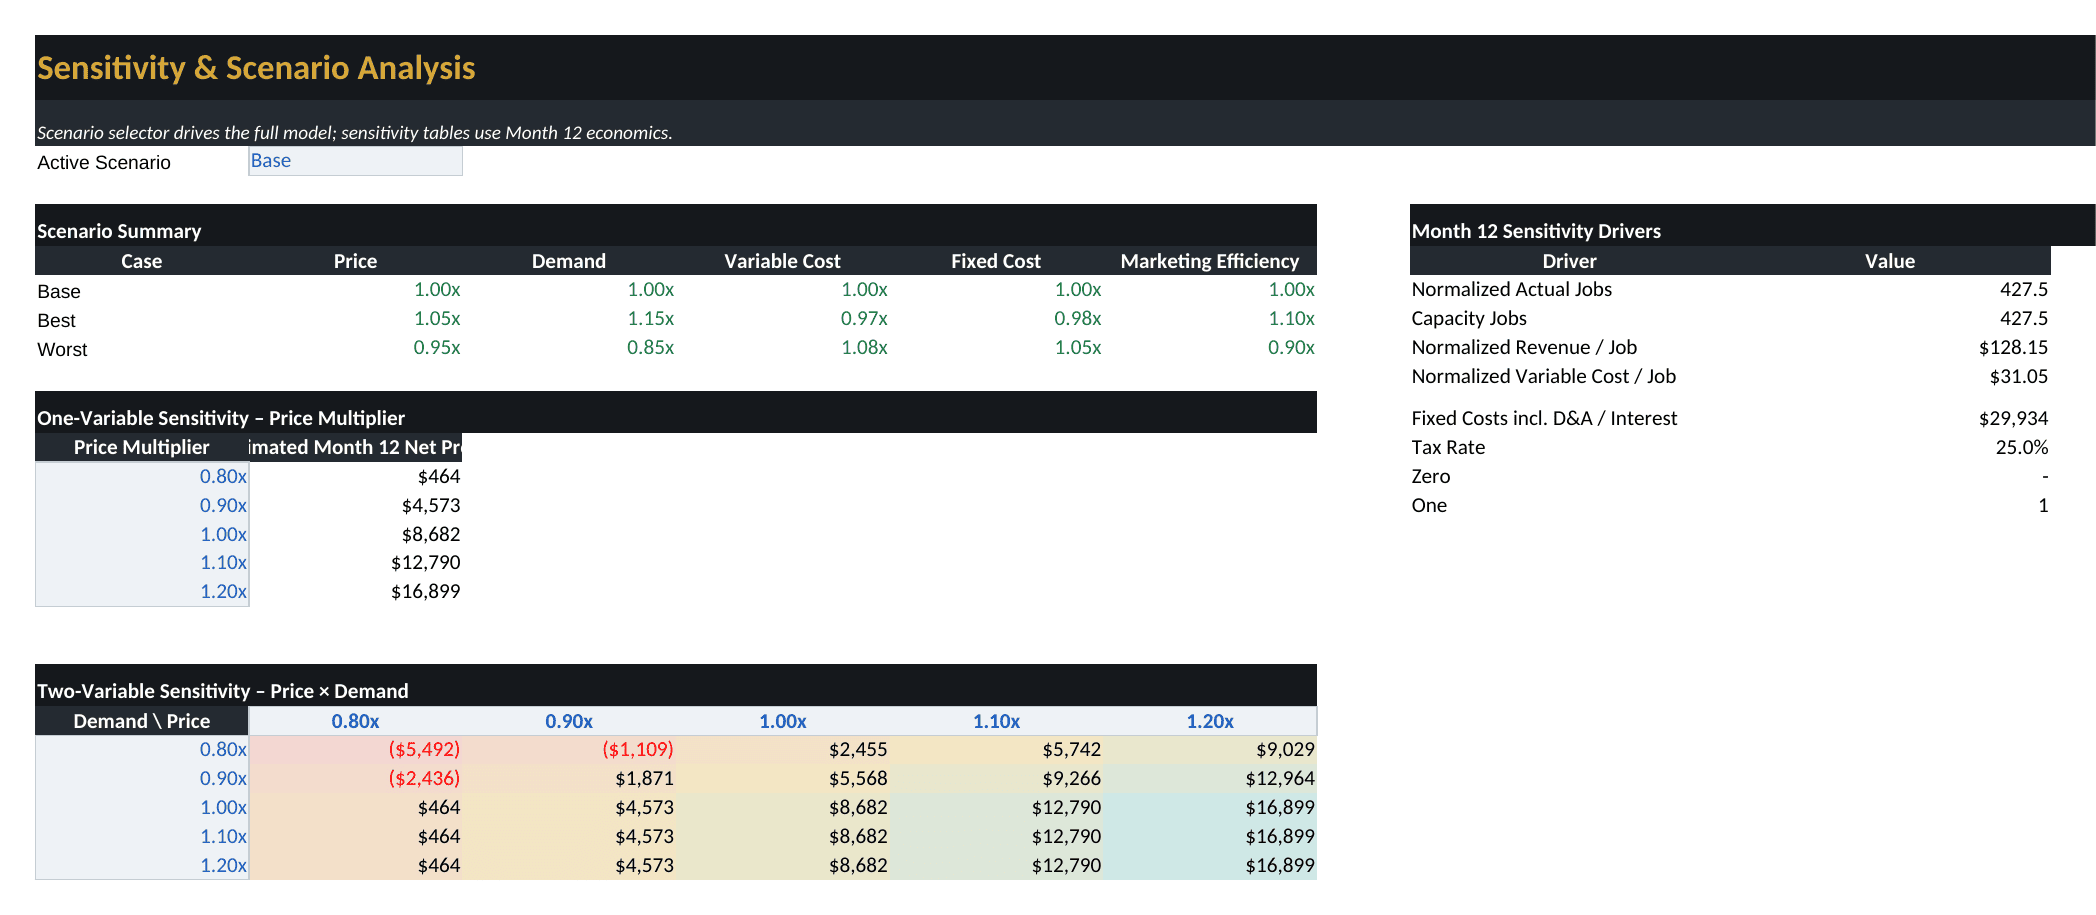
The Sensitivity & Scenario sheet includes Base, Best and Worst cases with separate multipliers for price, demand, variable cost, fixed cost and marketing efficiency. It also provides a one-variable price sensitivity and a two-variable Price × Demand sensitivity table using Month 12 economics. This helps the user see how pricing power and demand volume jointly influence profitability.
📈 KPI Dashboard
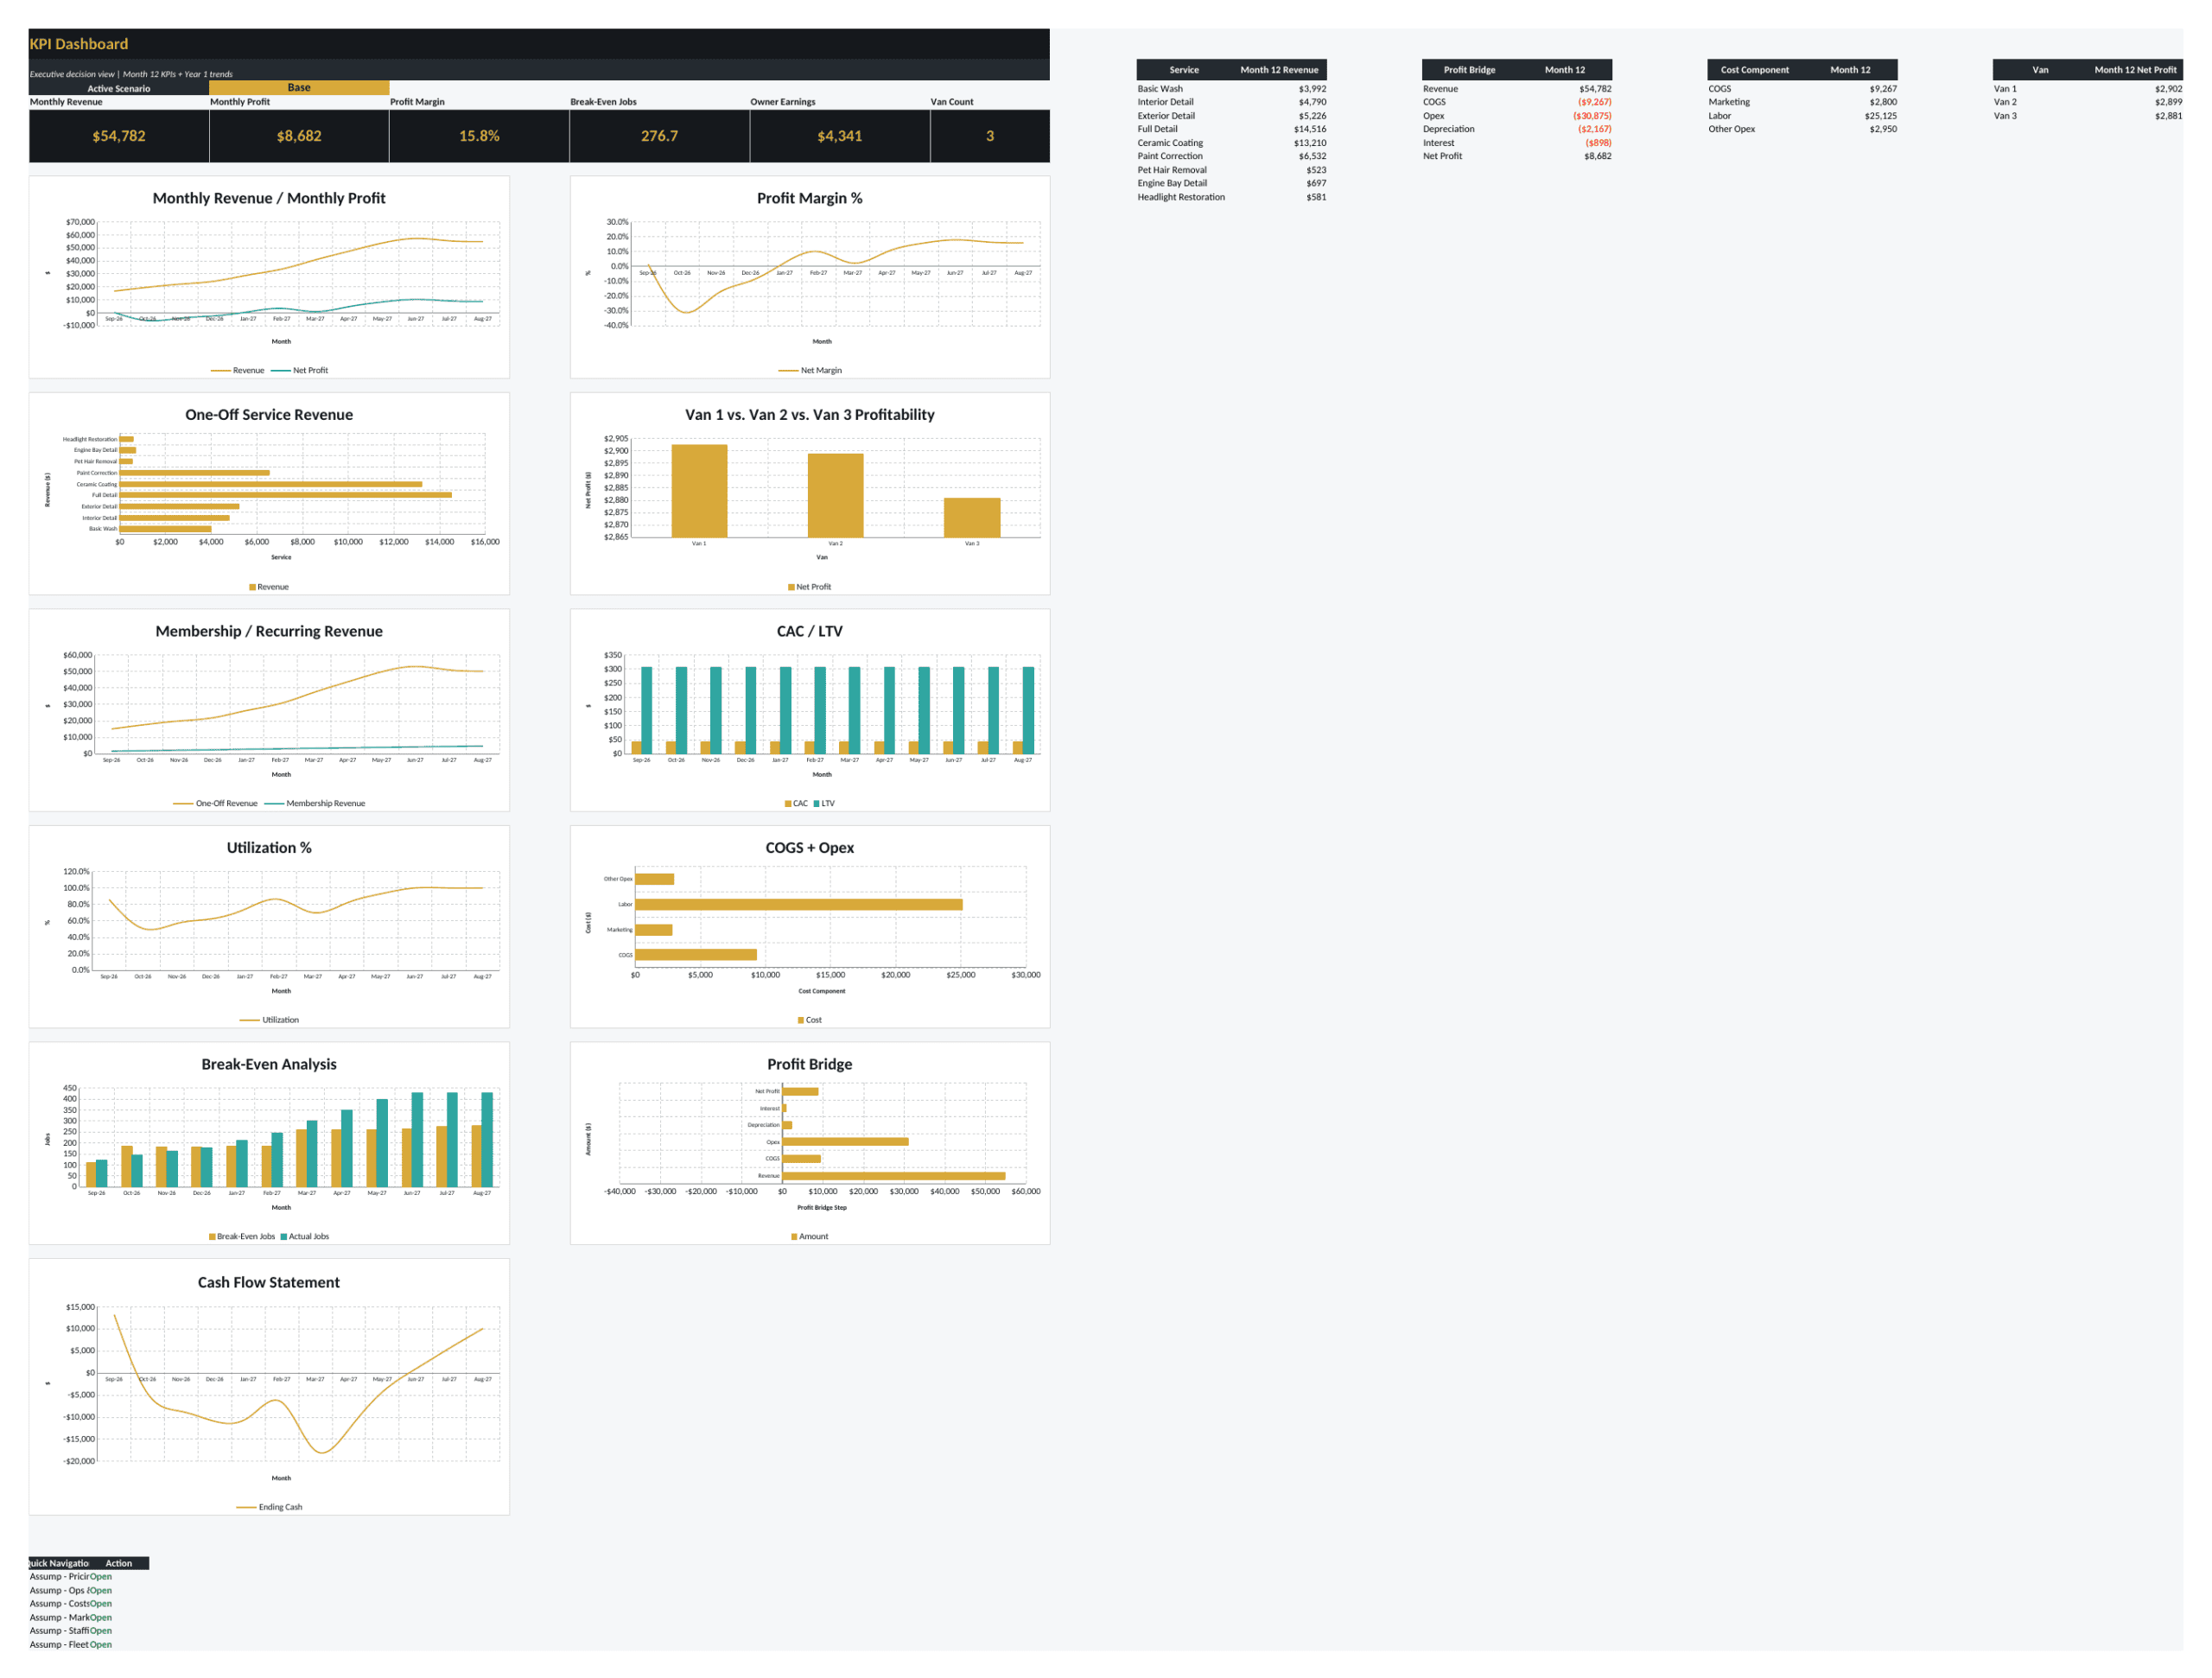
The executive dashboard brings together Month 12 KPIs and Year 1 trends. Visible metrics include monthly revenue, monthly profit, profit margin, break-even jobs, owner earnings and van count. Dashboard visuals cover monthly revenue and profit, profit margin, one-off service revenue, van profitability, membership/recurring revenue, CAC versus LTV, utilization, COGS and operating expenses, break-even performance, profit bridge and cash flow. Supporting tables also show service revenue, profit bridge components, cost components and van-level profit.
🗂️ Workbook Structure
The workbook contains 23 worksheets: Cover; Instructions; Disclaimer; six assumption sheets for pricing/services, operations/capacity, costs, marketing/growth, staffing and fleet/financing; Revenue Build; Job & Capacity Model; Cost Build; Marketing & CAC Model; Staffing & Commission Model; Van Financing Schedule; Profit & Loss Statement; Cash Flow Statement; Break-Even Analysis; Fleet Growth Model; Owner Earnings & Compensation; Sensitivity & Scenario; KPI Dashboard; and Audit Log. The Audit Log is a workbook-internal record supplied with the completed file and is not an independent Studio audit.
🎯 Practical Use Cases
- Build a five-year business plan for a new or existing mobile detailing operation.
- Forecast monthly revenue from service mix, prices, demand and recurring memberships.
- Test whether current vans and technicians can support projected job volume.
- Plan the timing of second- and third-van expansion using utilization or scheduled triggers.
- Evaluate service pricing changes and see their effect on Month 12 profitability.
- Measure direct job economics, contribution margin and break-even jobs per month or day.
- Forecast technician payroll, commissions, employer burden and productivity metrics.
- Estimate customer acquisition cost, lifetime value, LTV/CAC and marketing payback.
- Model membership conversion, churn, visits, recurring revenue and contribution economics.
- Forecast van capex, debt financing, principal, interest, depreciation and book value.
- Assess operating, investing and financing cash flows before committing to expansion.
- Compare Base, Best and Worst cases and run Price × Demand sensitivities.
- Track owner draws, retained profit and cash available after operating and financing needs.
- Present operating and financial KPIs through a decision-focused dashboard.
👥 Intended Users
This model is suitable for mobile detailing founders, independent operators, small fleet owners, franchise candidates, business-plan consultants, accountants, finance advisors, lenders and investors who need a structured operating model rather than a simple revenue template. It can also support acquisition review or expansion planning when the buyer wants to replace the sample assumptions with the economics of a specific detailing business.
📦 Delivered Files
The package includes the completed `.xlsx` workbook, a 23-page full-sheet PDF preview with one worksheet per page. The workbook uses standard Excel `.xlsx` format and no macro functionality is claimed.
Similar ProductsOther customers were also interested in...



 eFinancialModels
Electric Vehicle (EV) Charging Station Financial M...
With this comprehensive 5- or 10-year monthly tool, investors can assess the viability of setting up... Read more

Financial Model for Mobile App | Mobile App Busine...
The Mobile App Financial Plan Template in Excel allows you to develop financial projections when lau... Read more

 HenrySheykin
Food Truck Financial Model Excel Template
The Food Truck Financial Model helps entrepreneurs, founders, business owners, consultants, and anal... Read more

Green Hydrogen Production from Wind Energy Financi...
The Green Hydrogen from Wind Financial Model aims to comprehensively forecast a horizon of 40 years ... Read more

Simple Mutual Non-Disclosure Agreement Template
Protect your business secrets with ease using our Simple Mutual Non-Disclosure Agreement Template. S... Read more

Solar Energy Financial Model
The Solar Energy Financial Model Spreadsheet Template in Excel assists you in preparing a sophistica... Read more

 Peter Graf
The Customer-Centric Financial Model for Restauran...
Starting a restaurant without a financial plan is like driving a car blindfolded. You wouldn´t do i... Read more
You must log in to submit a review.