
0 ITEMS

Integrated Three-Statement Financial Model – 10-Year Forecast with Base/Upside/Downside Scenarios, Linked Financial Statements, DCF Valuation, Sensitivities, Ratios and Funding Analysis
Integrated Three-Statement Financial Model – 10-Year Forecast 📊 What this model is built to solve This Excel model is designed for an operating business that needs one connected 10-year forecast rather than separate revenue, profit, cash-flow and valuation files. It links product sales, billable services and subscription revenue to direct costs, staffing, operating expenses, working capital, capital expenditure, financing, tax, the income statement, balance sheet, cash flow, ratios and DCF valuation. The workbook uses illustrative starting data so a buyer can understand the mechanics immediately, while the operating and financial inputs are editable for a real planning case.
Integrated Three-Statement Financial Model – 10-Year Forecast
📊 What this model is built to solve
This Excel model is designed for an operating business that needs one connected 10-year forecast rather than separate revenue, profit, cash-flow and valuation files. It links product sales, billable services and subscription revenue to direct costs, staffing, operating expenses, working capital, capital expenditure, financing, tax, the income statement, balance sheet, cash flow, ratios and DCF valuation. The workbook uses illustrative starting data so a buyer can understand the mechanics immediately, while the operating and financial inputs are editable for a real planning case.
The central buyer problem is integration. A growth assumption should not stop at revenue: it should flow into direct costs, payroll needs, working-capital balances, capex, financing requirements, taxes, cash generation, leverage and ultimately equity value. This model provides that connected workflow and keeps the full financial statements tied to the active Base, Upside or Downside scenario.
🧭 Model workflow
- Start in Start Here for the model sequence, conventions and scope.
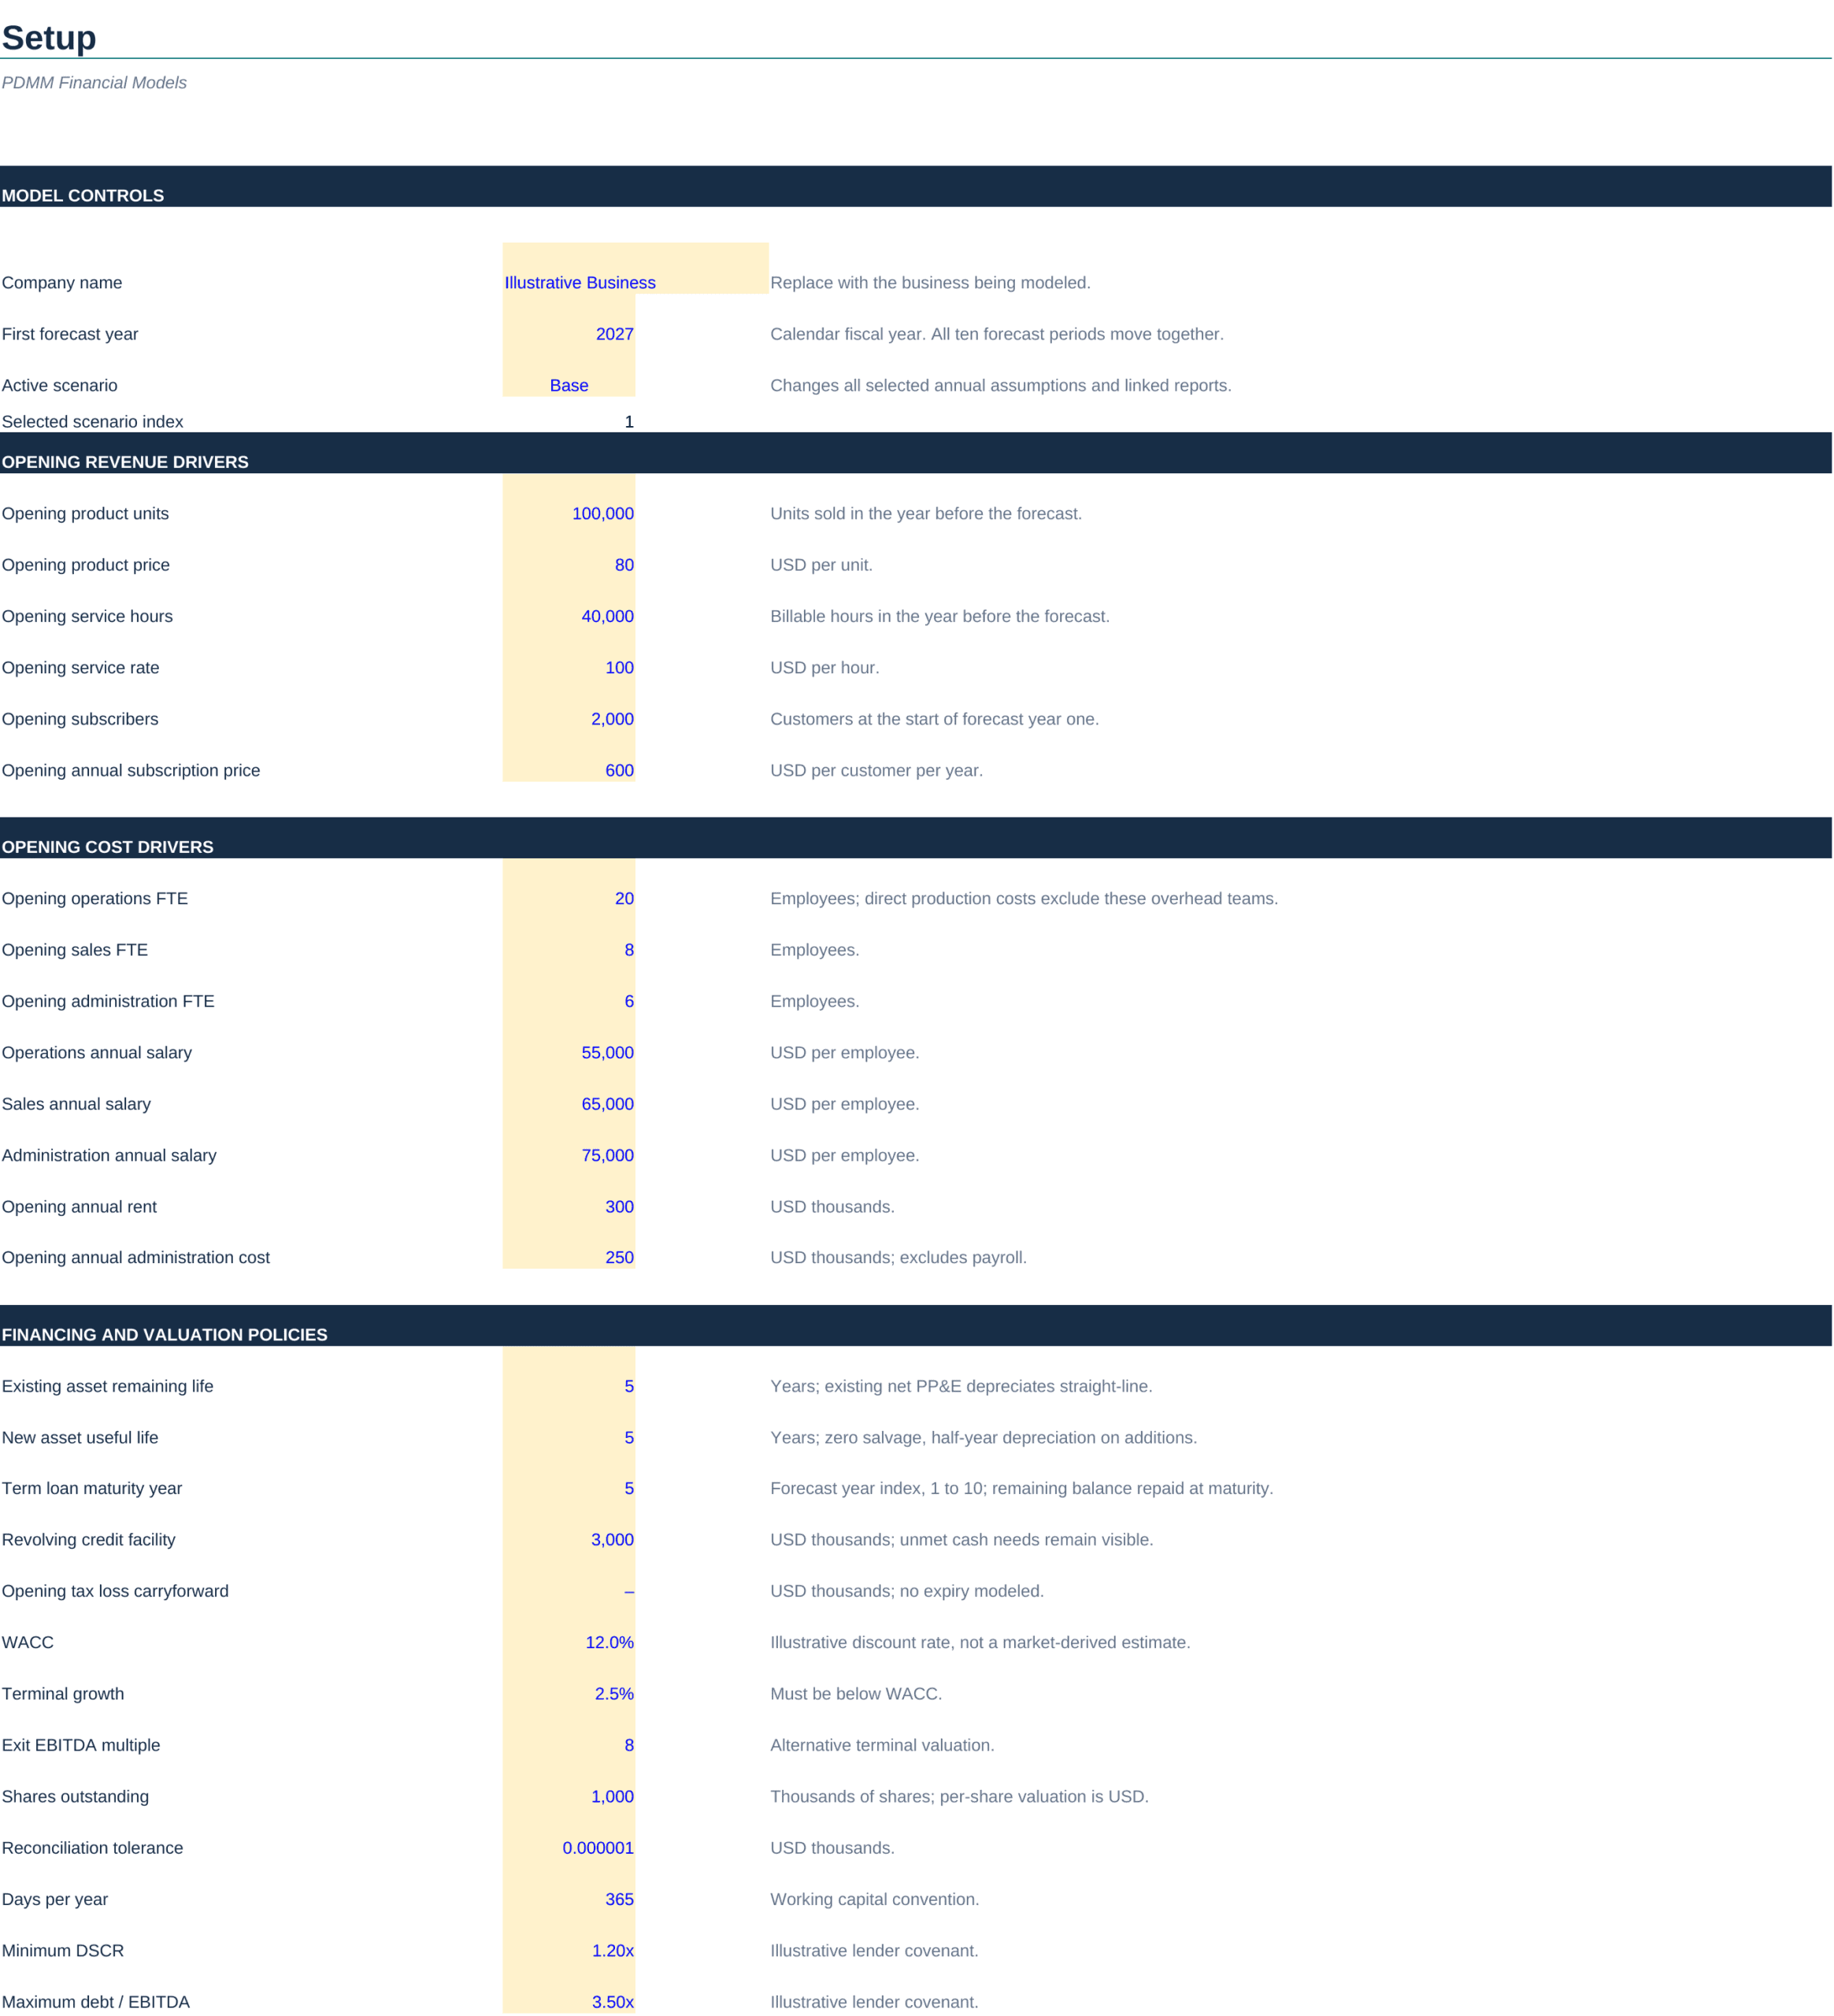
- Use Setup to enter the company name, first forecast year, active scenario, opening revenue drivers, opening staffing/cost drivers and financing/valuation policies.
- Replace the sample Opening Balances with a reconciled prior-year balance sheet.
- Edit ten annual assumption columns for Base, Upside and Downside cases in Assumptions.
- Review the operating schedules for revenue, costs, working capital, fixed assets, financing and tax.
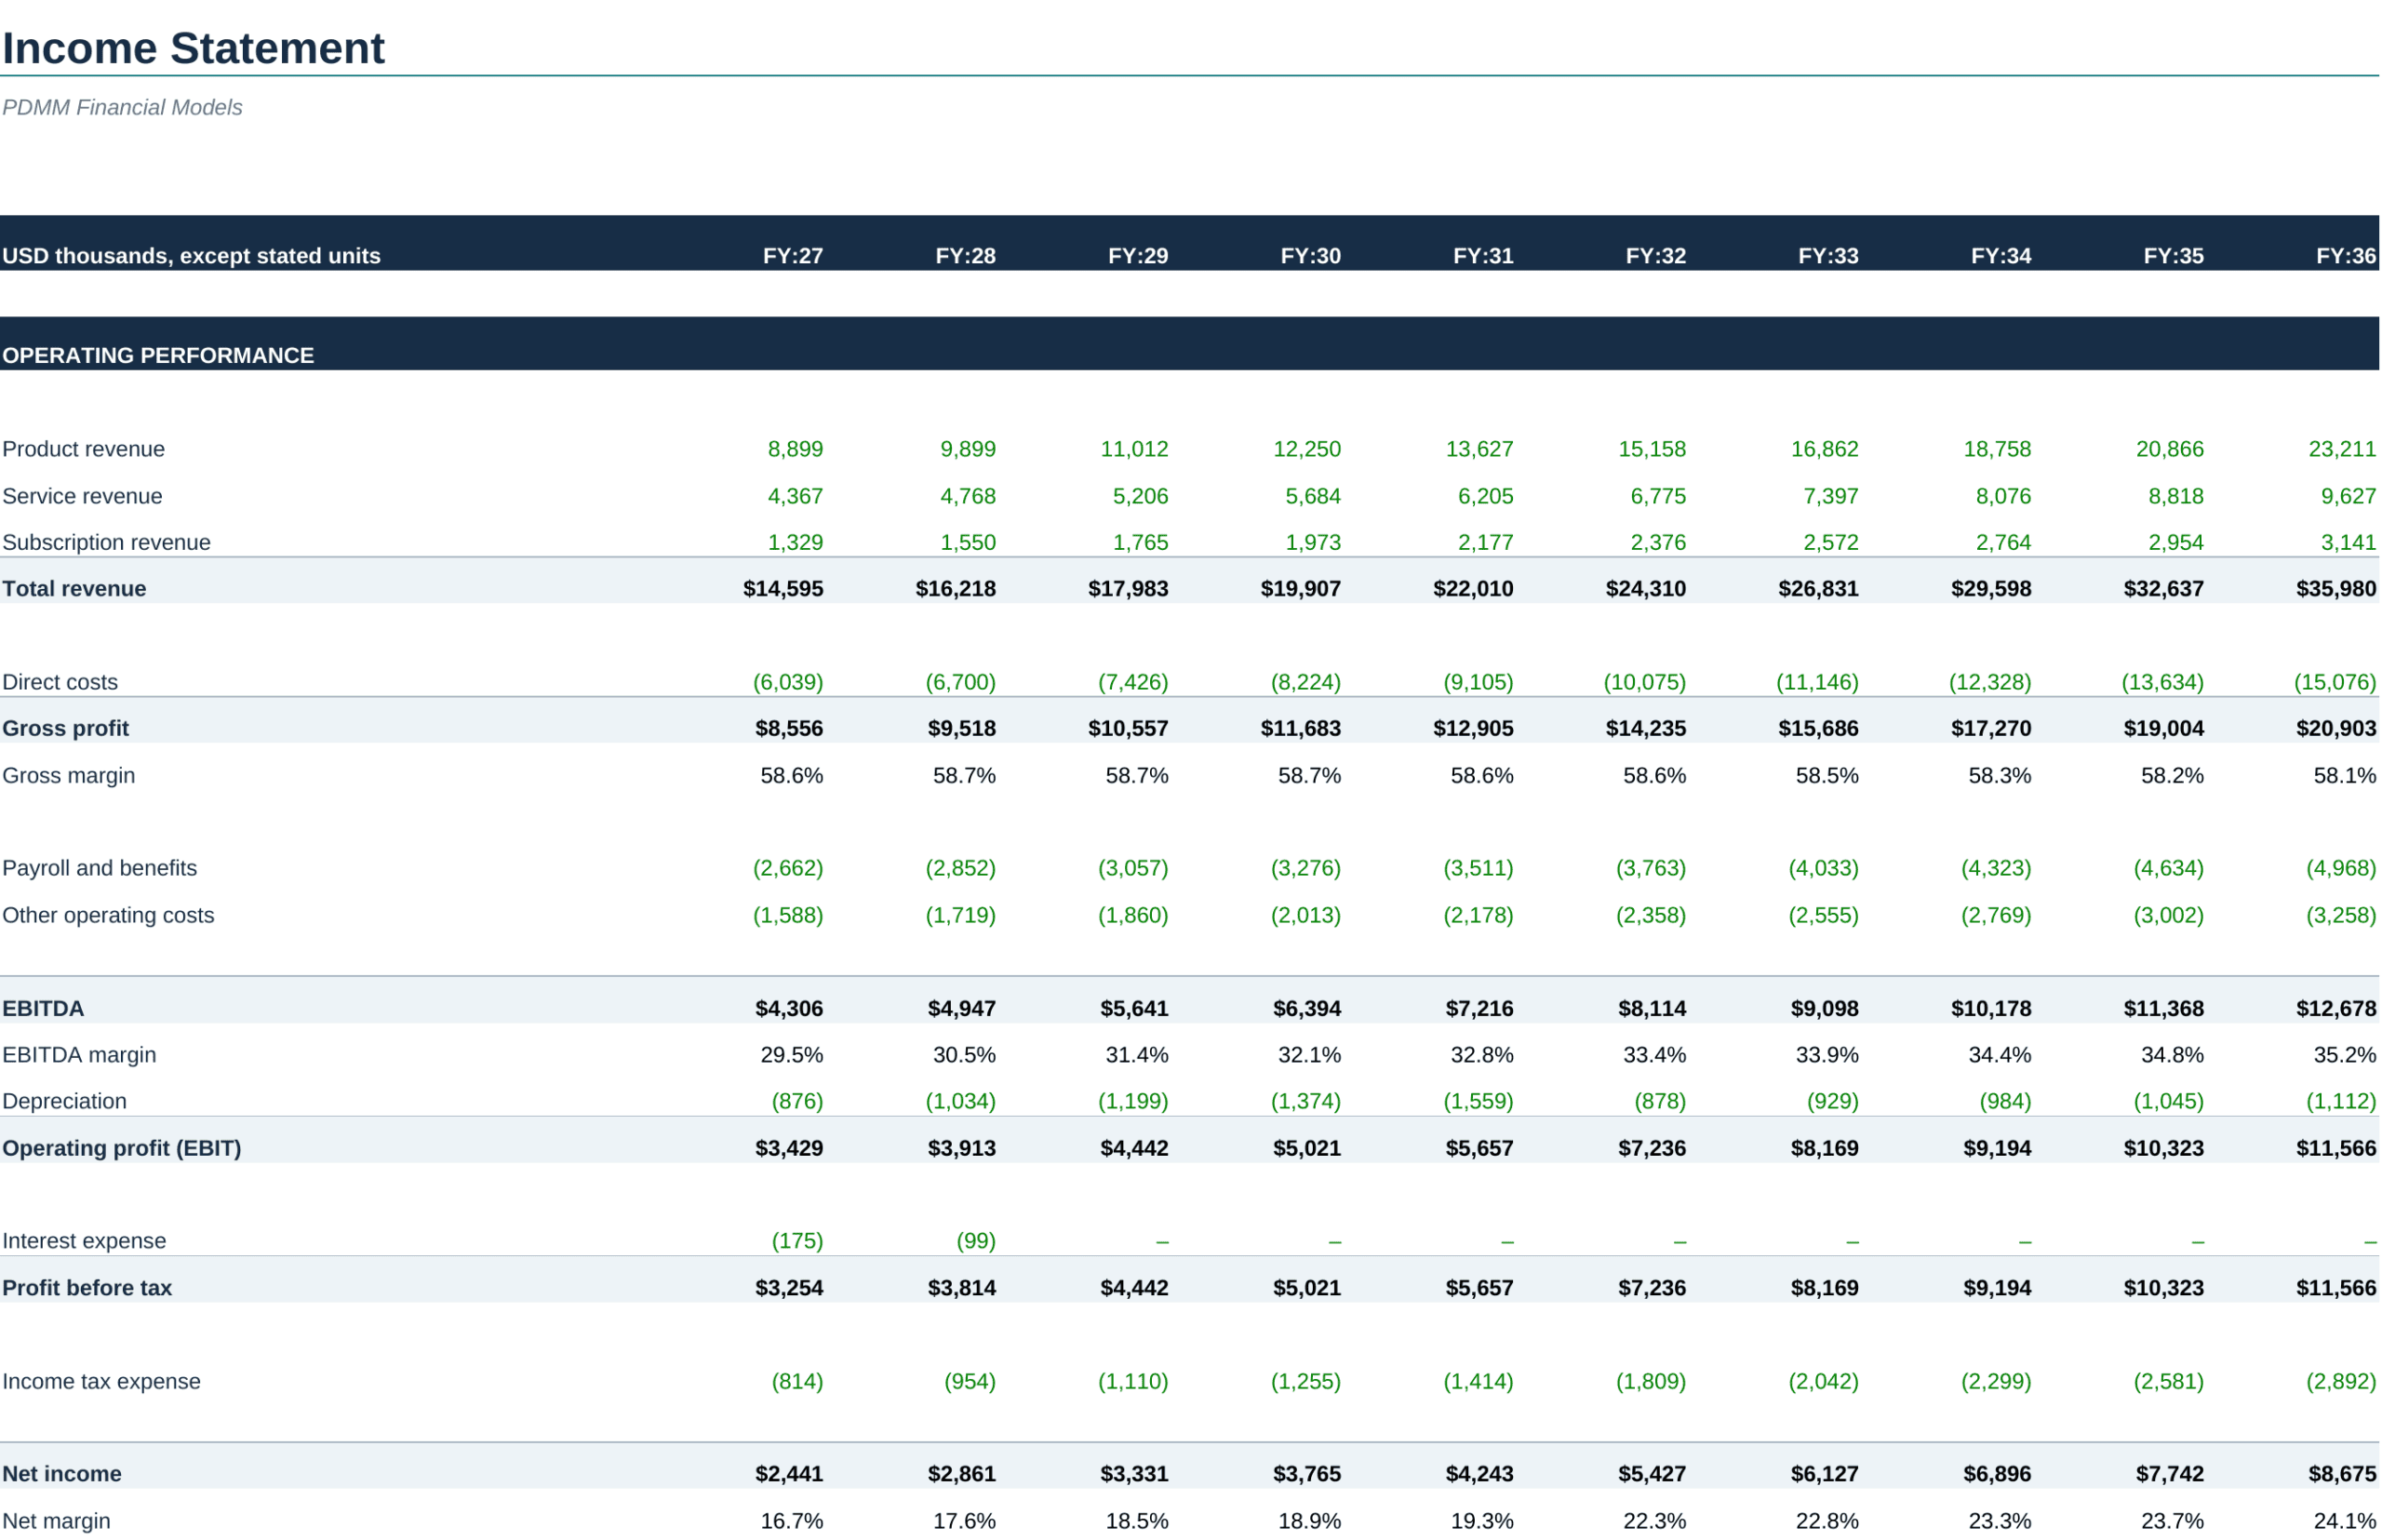
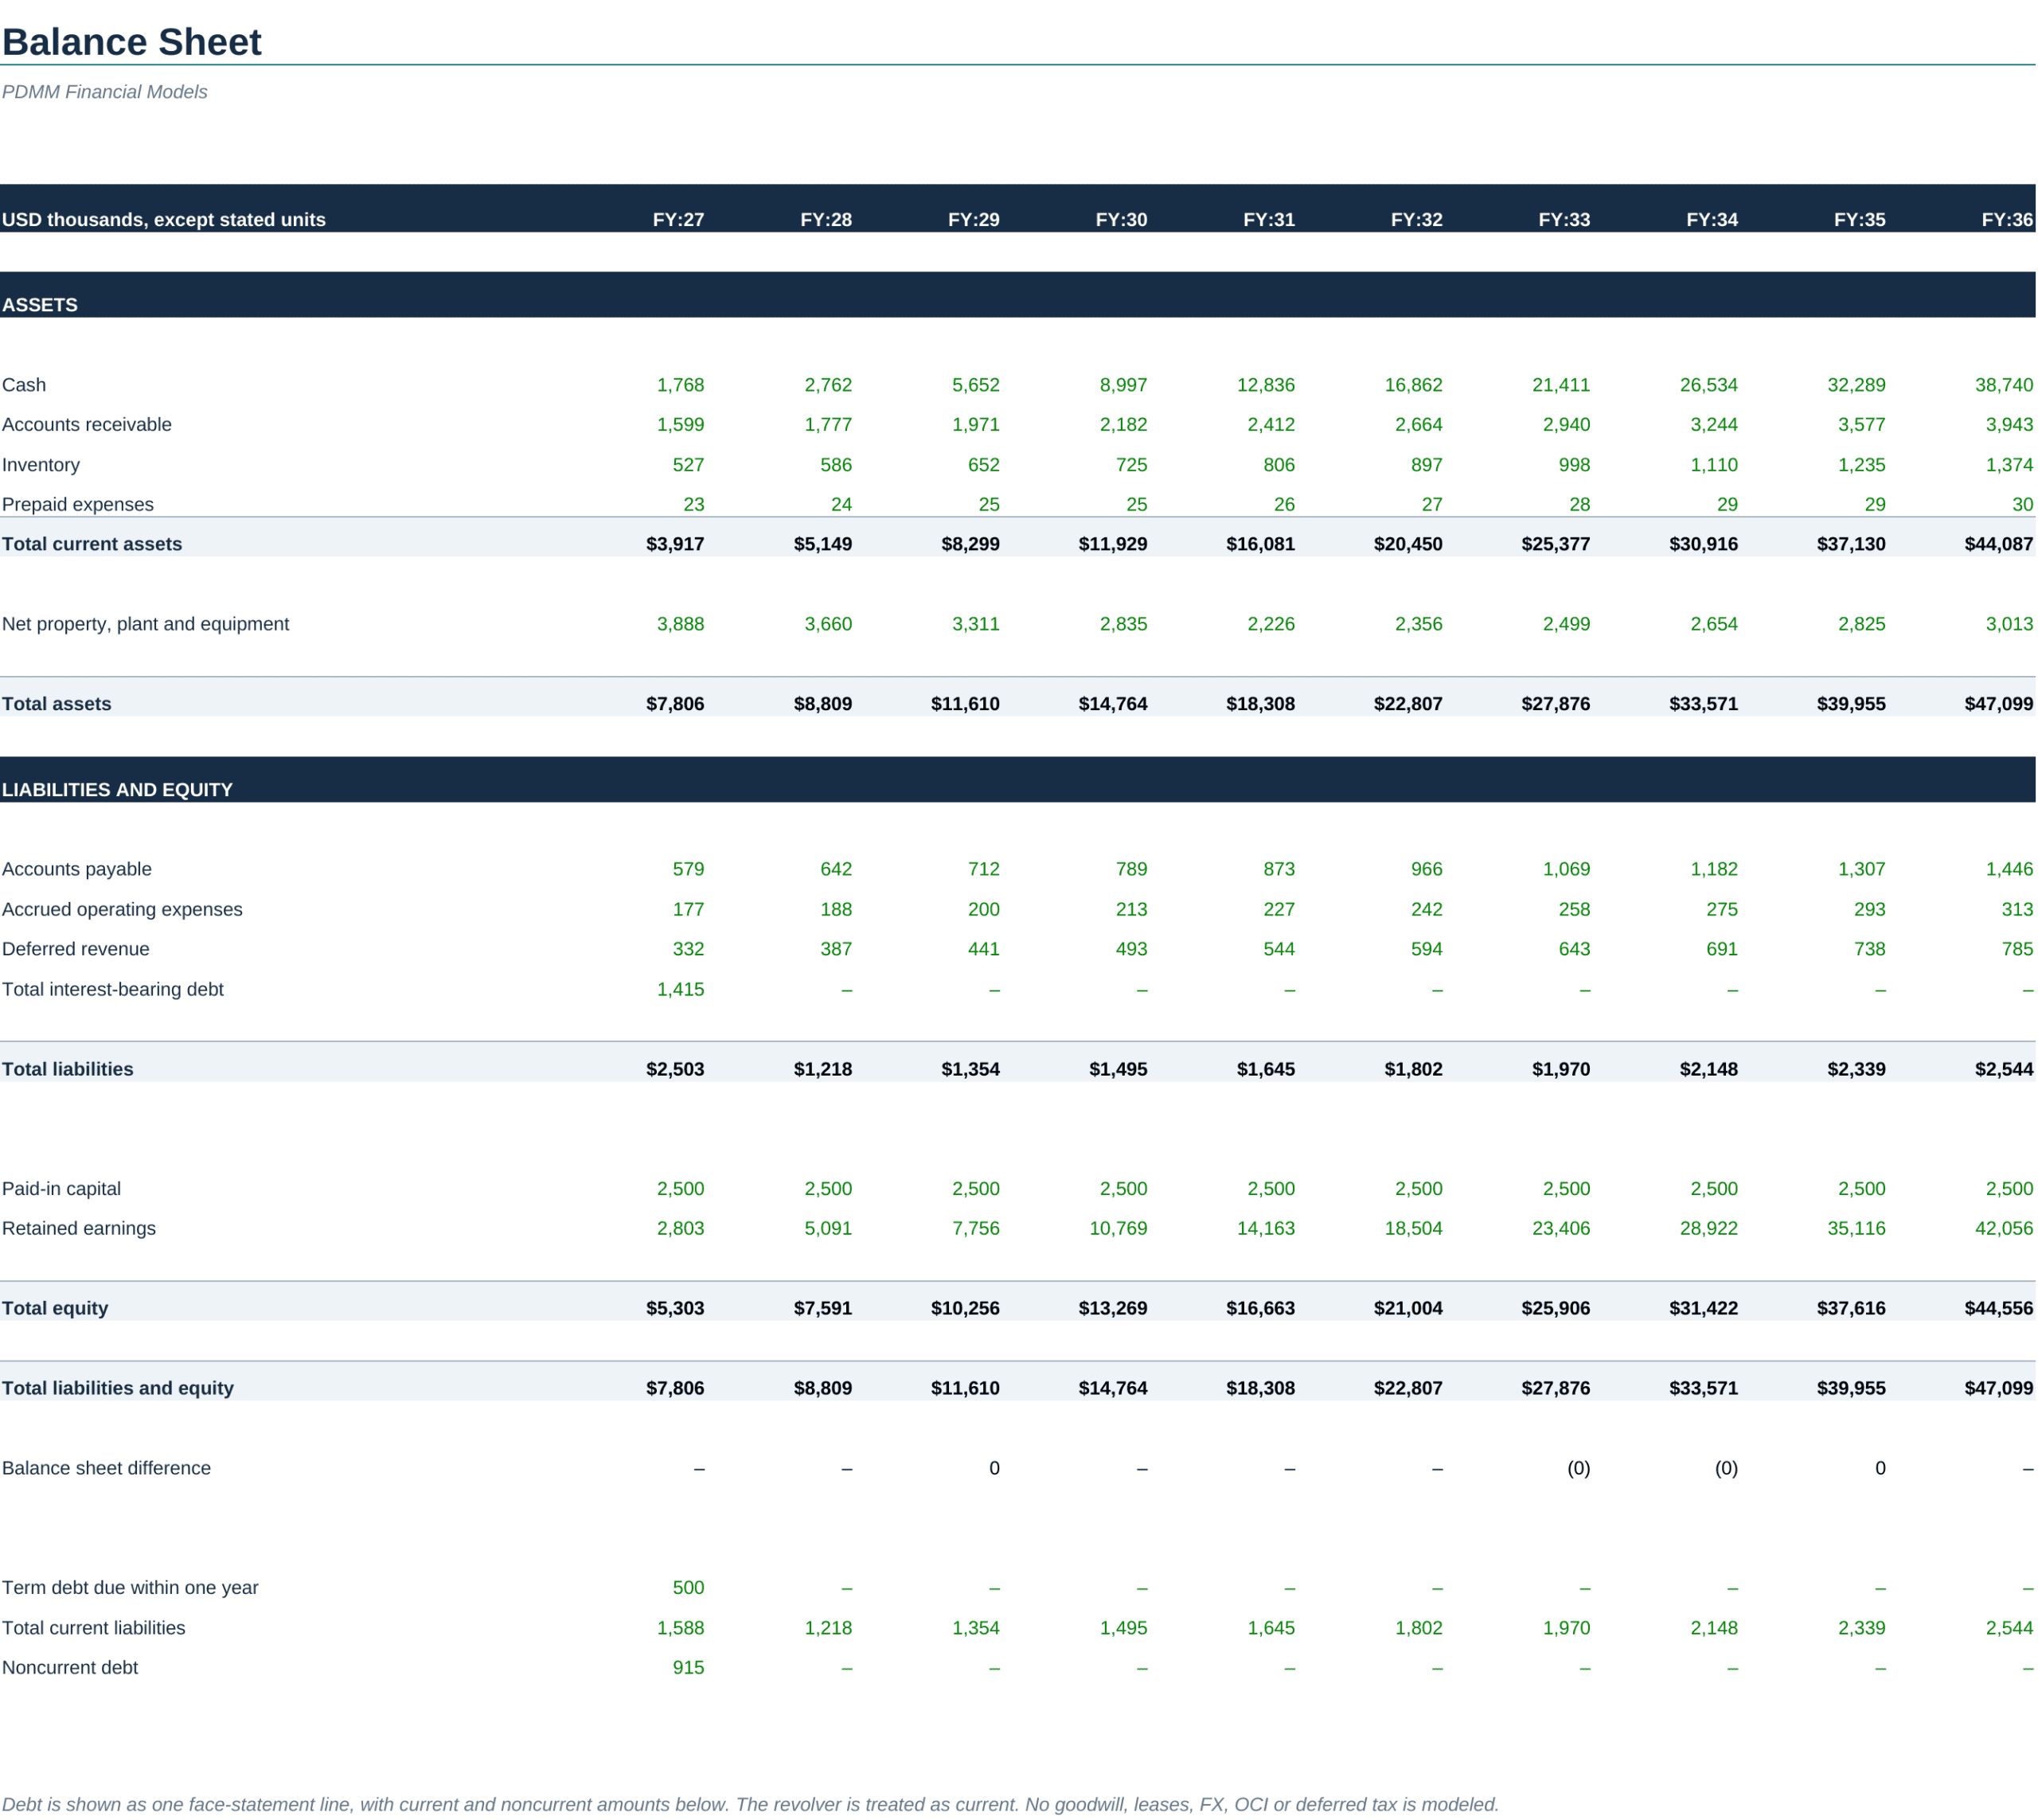
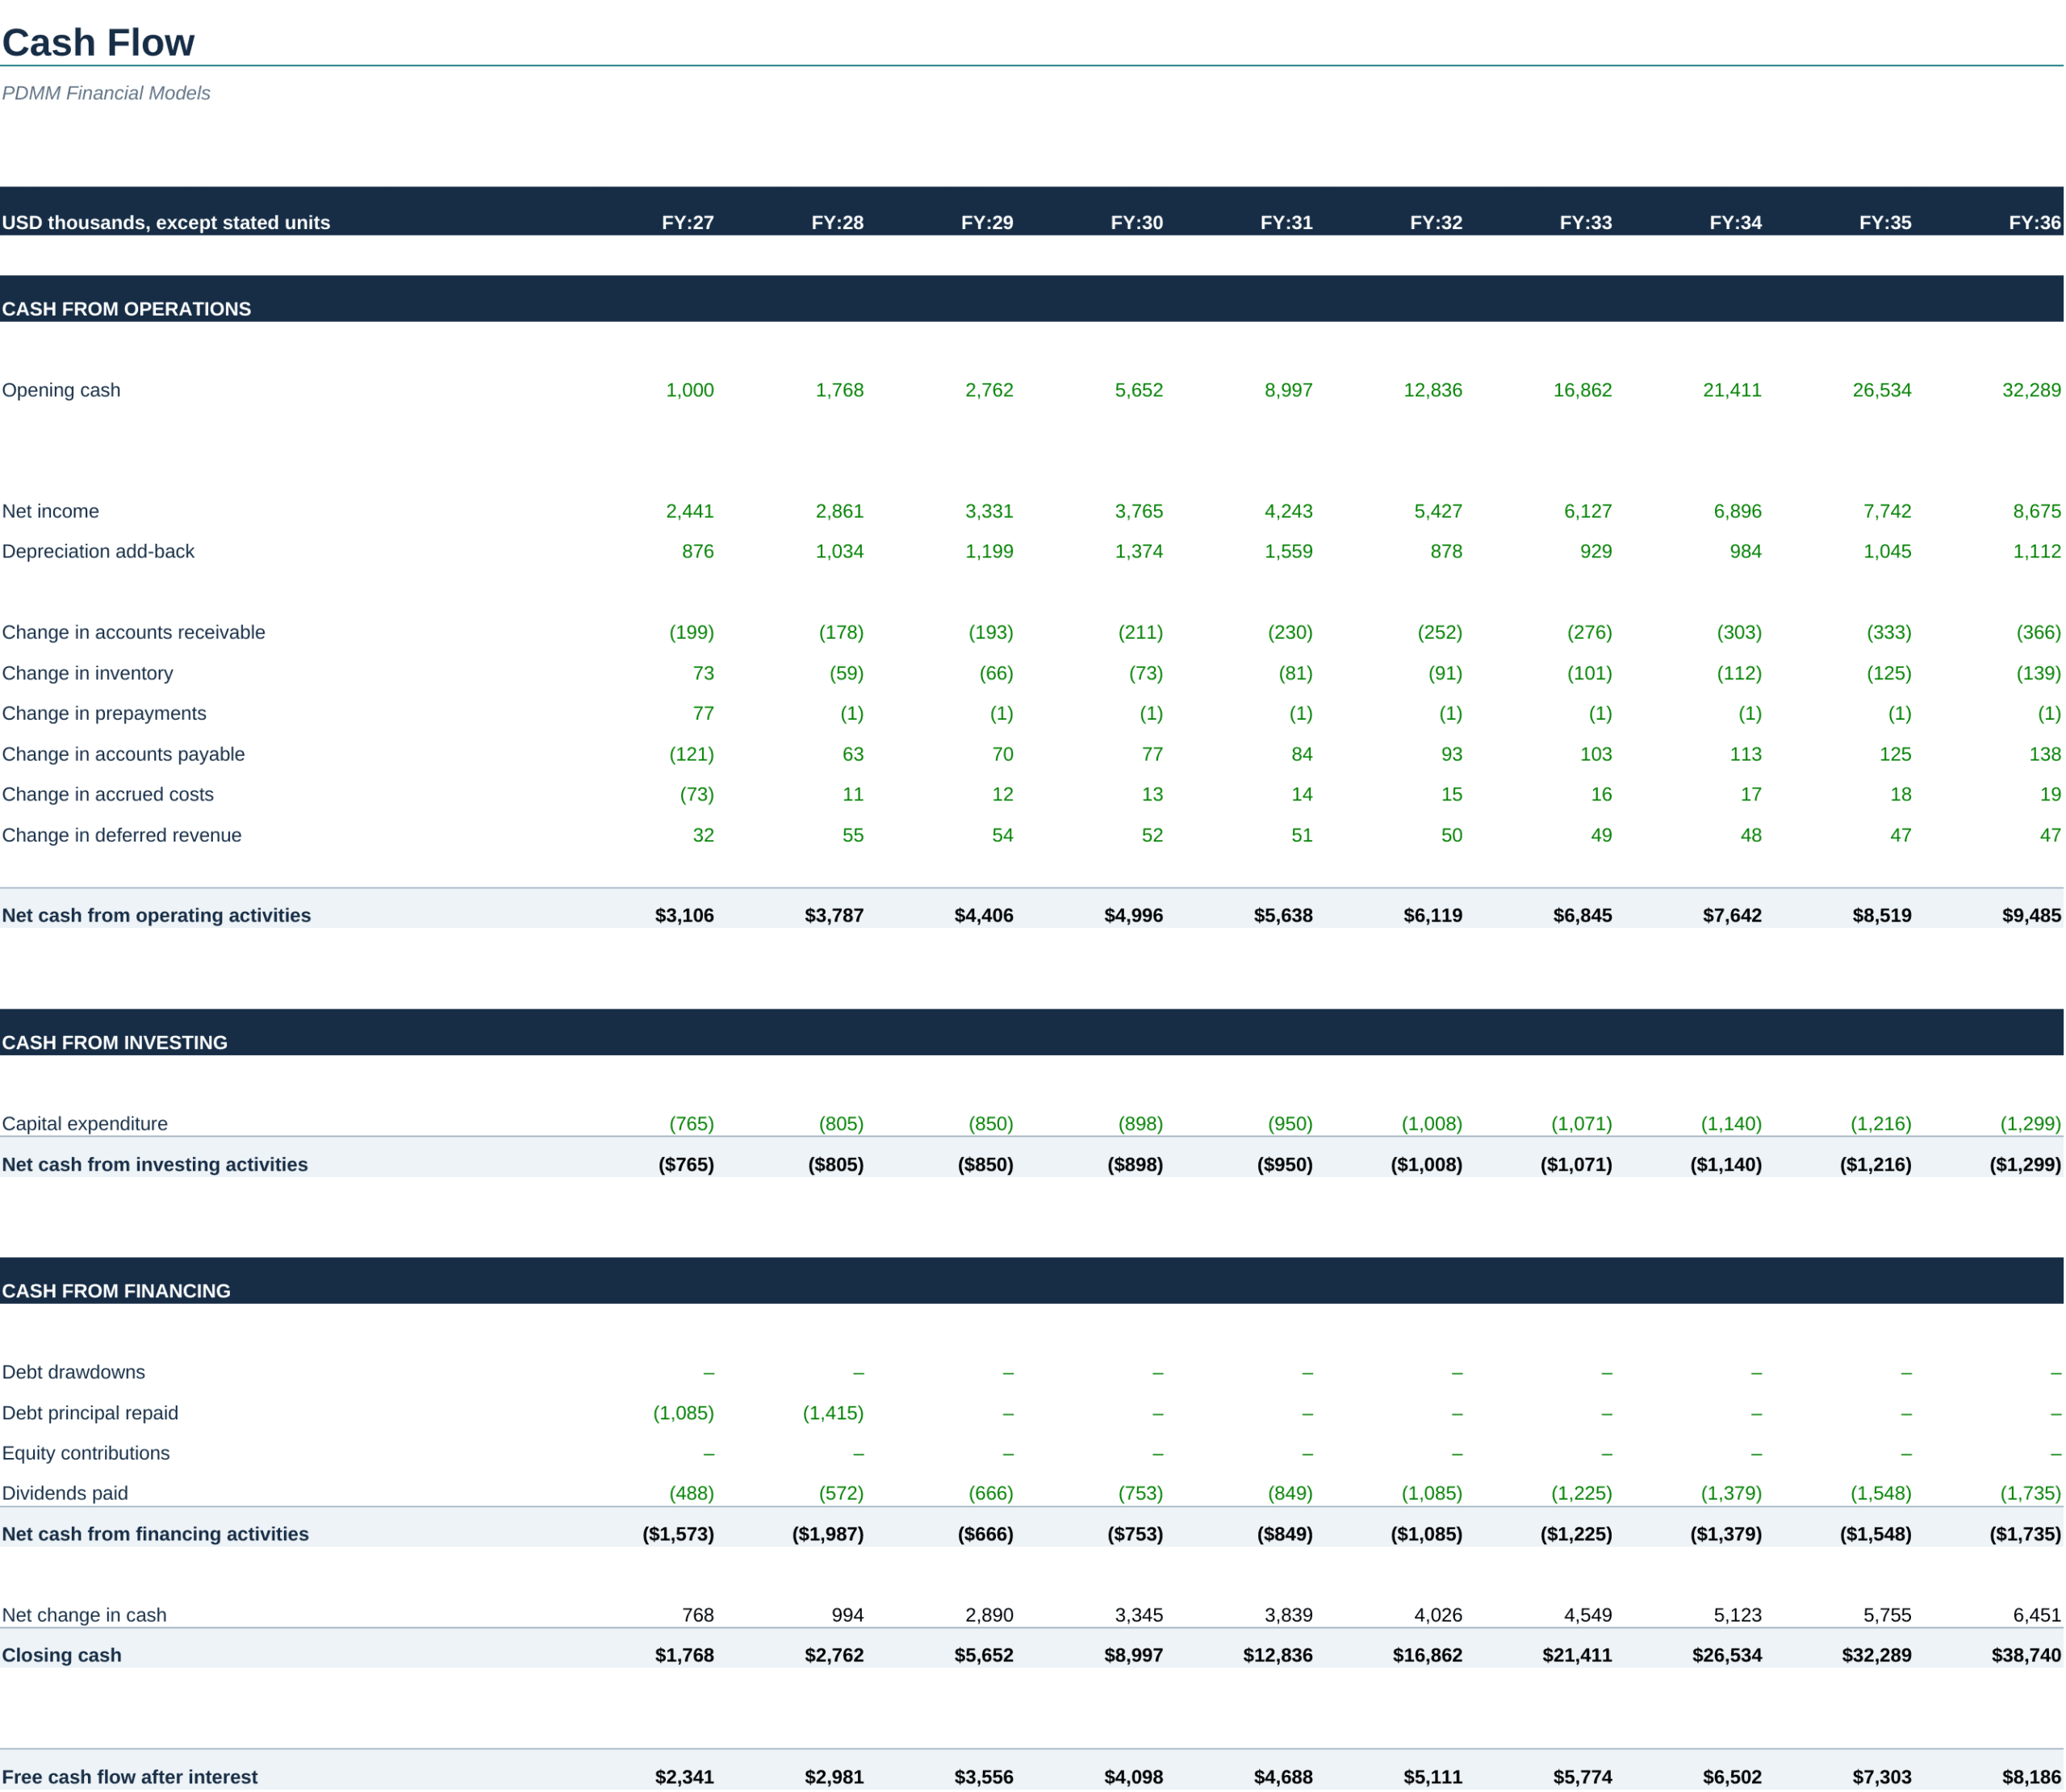
- Follow the linked income statement, balance sheet and cash flow, then review ratios, break-even and funding indicators.
- Use DCF valuation, exit-multiple cross-checks, sensitivity tables and the side-by-side scenario comparison for decision support.
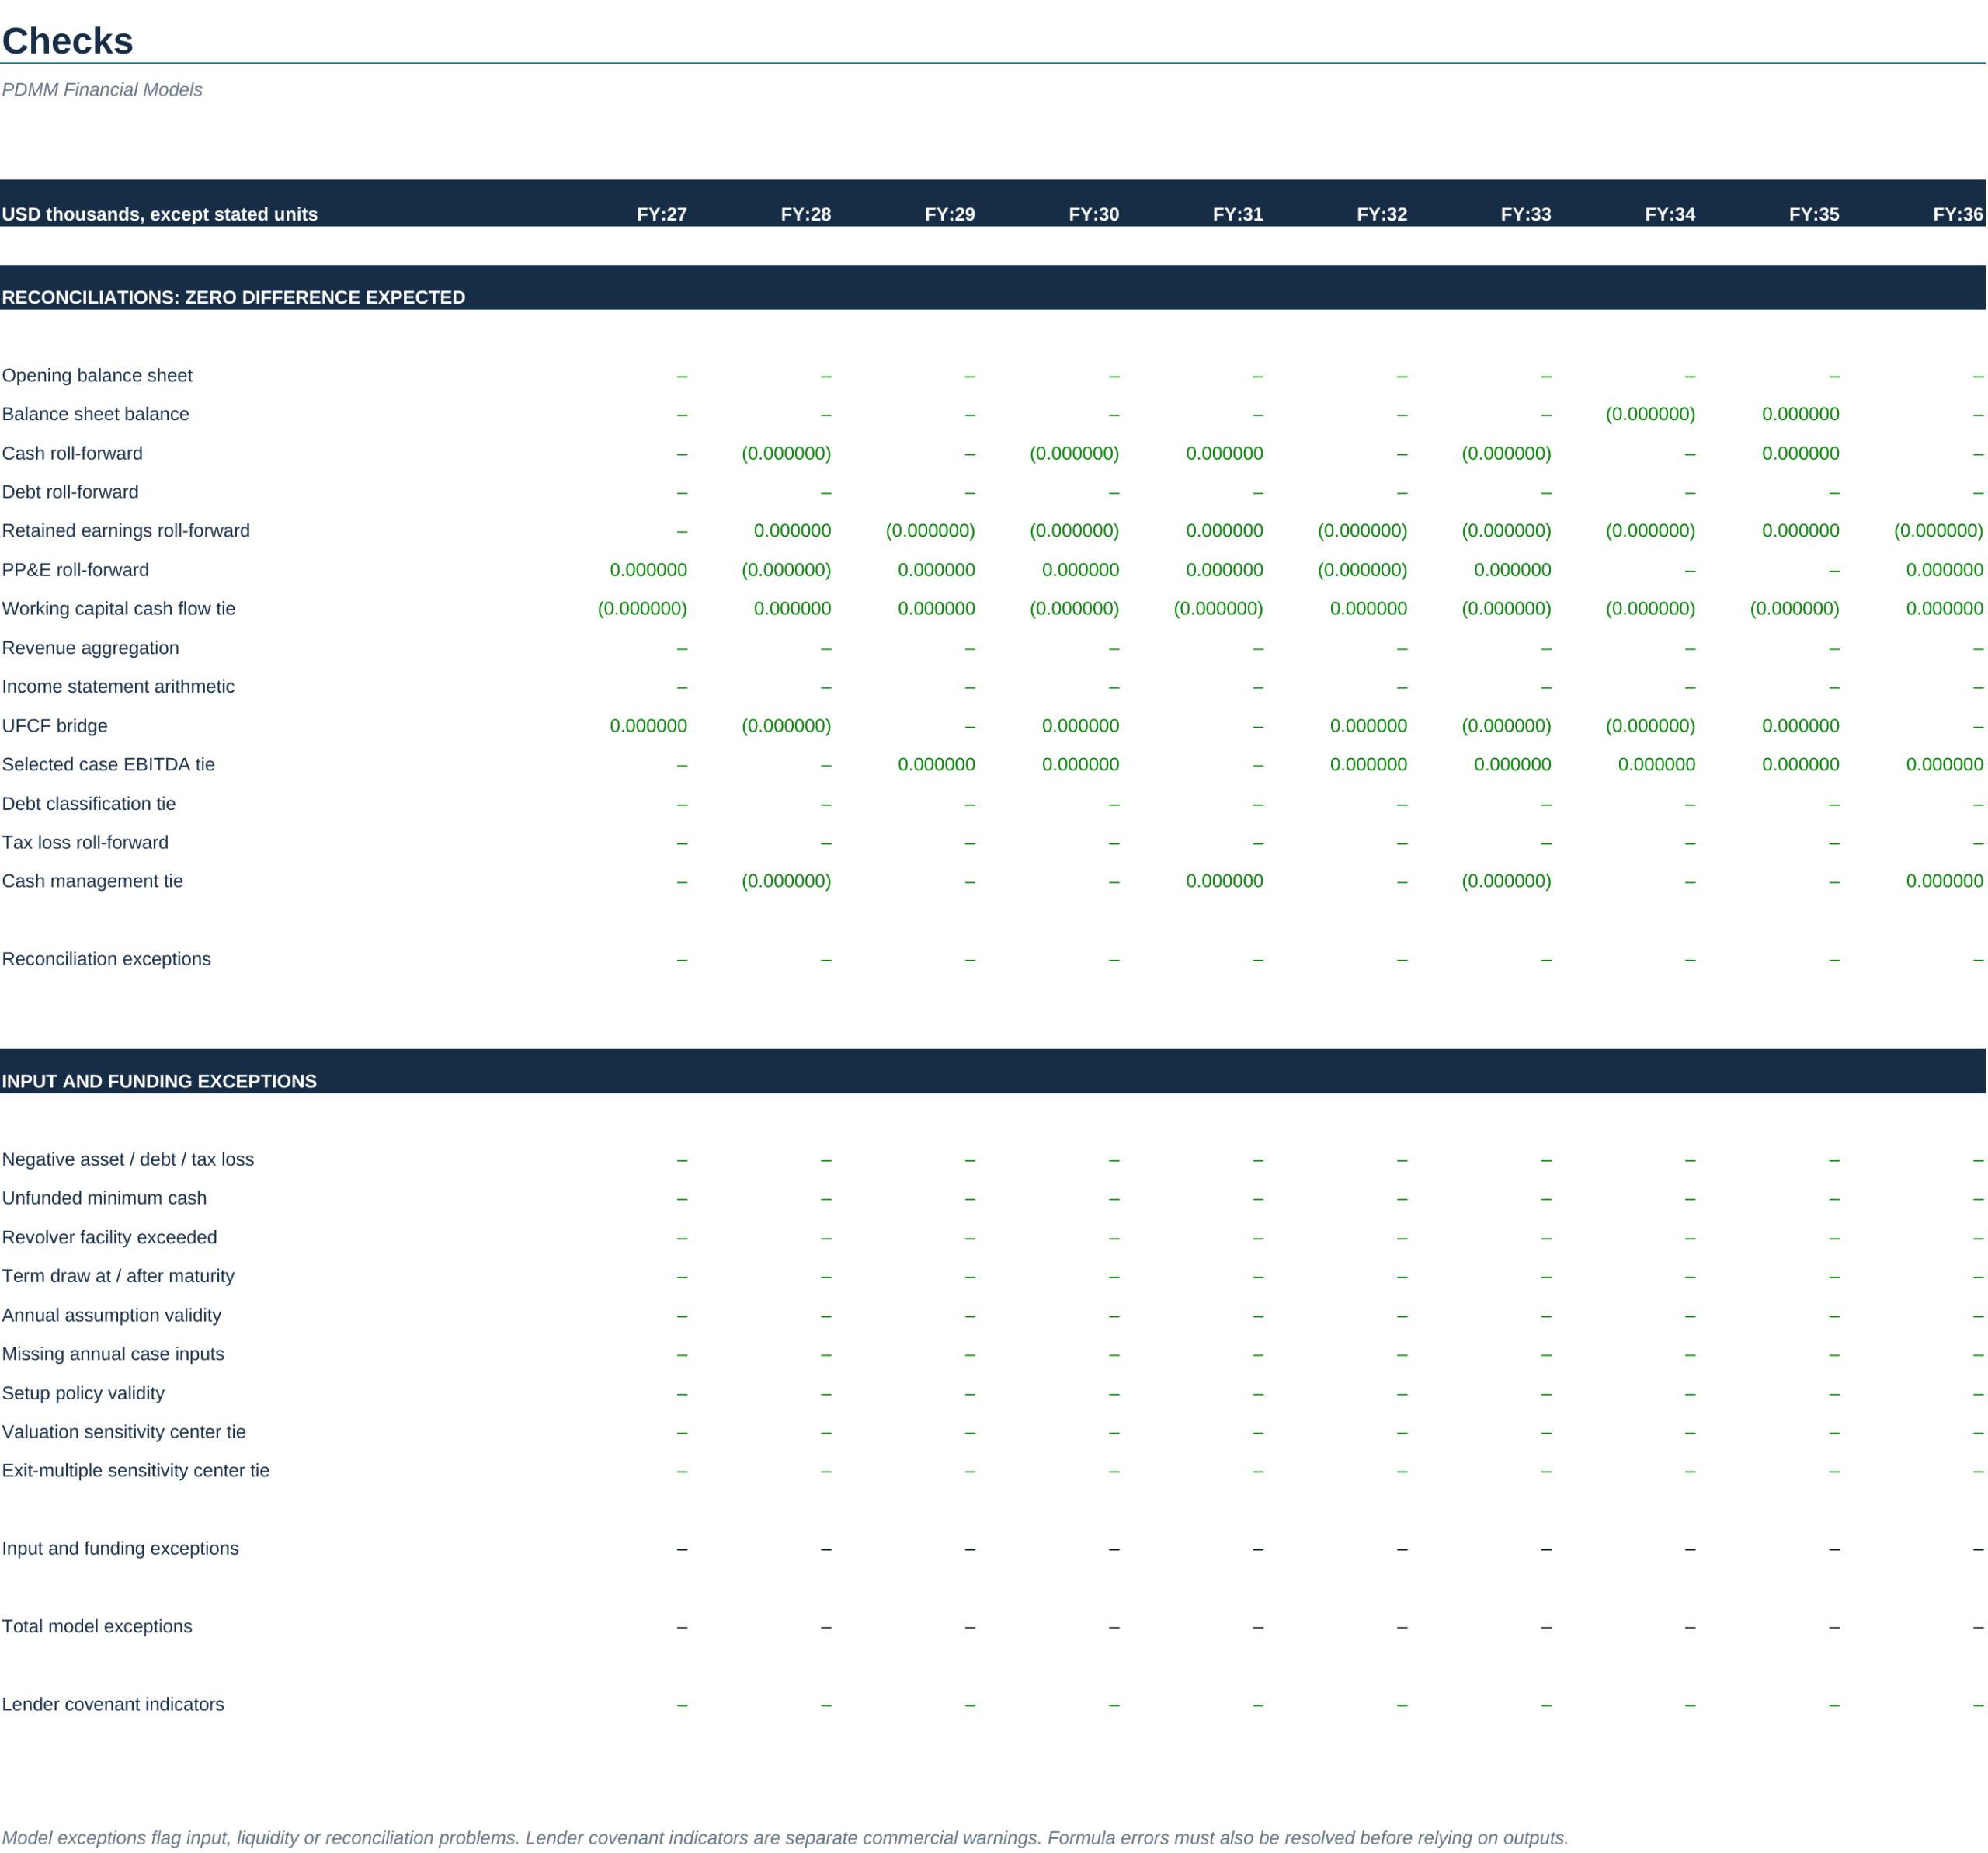
- Review the workbook’s Checks sheet for model exceptions, funding issues and covenant indicators.
✏️ Editable inputs and operating drivers
The Setup and Assumptions sheets expose a broad set of planning drivers, including company name, forecast start year, active scenario, opening product units and prices, service hours and rates, opening subscribers and subscription pricing, opening FTE by function, salary levels, rent and administration costs. Financing and valuation policies include asset lives, term-loan maturity, revolving-credit capacity, opening tax losses, WACC, terminal growth, exit EBITDA multiple, shares outstanding, reconciliation tolerance, minimum DSCR and maximum debt/EBITDA.
Annual scenario assumptions cover product volume and price growth, product direct-cost margin, service-hour and service-rate growth, service direct-cost margin, subscription additions, churn and pricing, subscription direct-cost margin, headcount growth, salary inflation, payroll burden, marketing, rent, administration, other overhead, receivable/inventory/payable days, accrued-cost days, prepaid-cost days, deferred subscription revenue, maintenance capex, expansion capex, term-debt draws and amortization, debt and revolver interest rates, minimum cash, equity contributions, dividends, cash sweep, tax rate and tax-loss utilization.
🧮 Core calculations
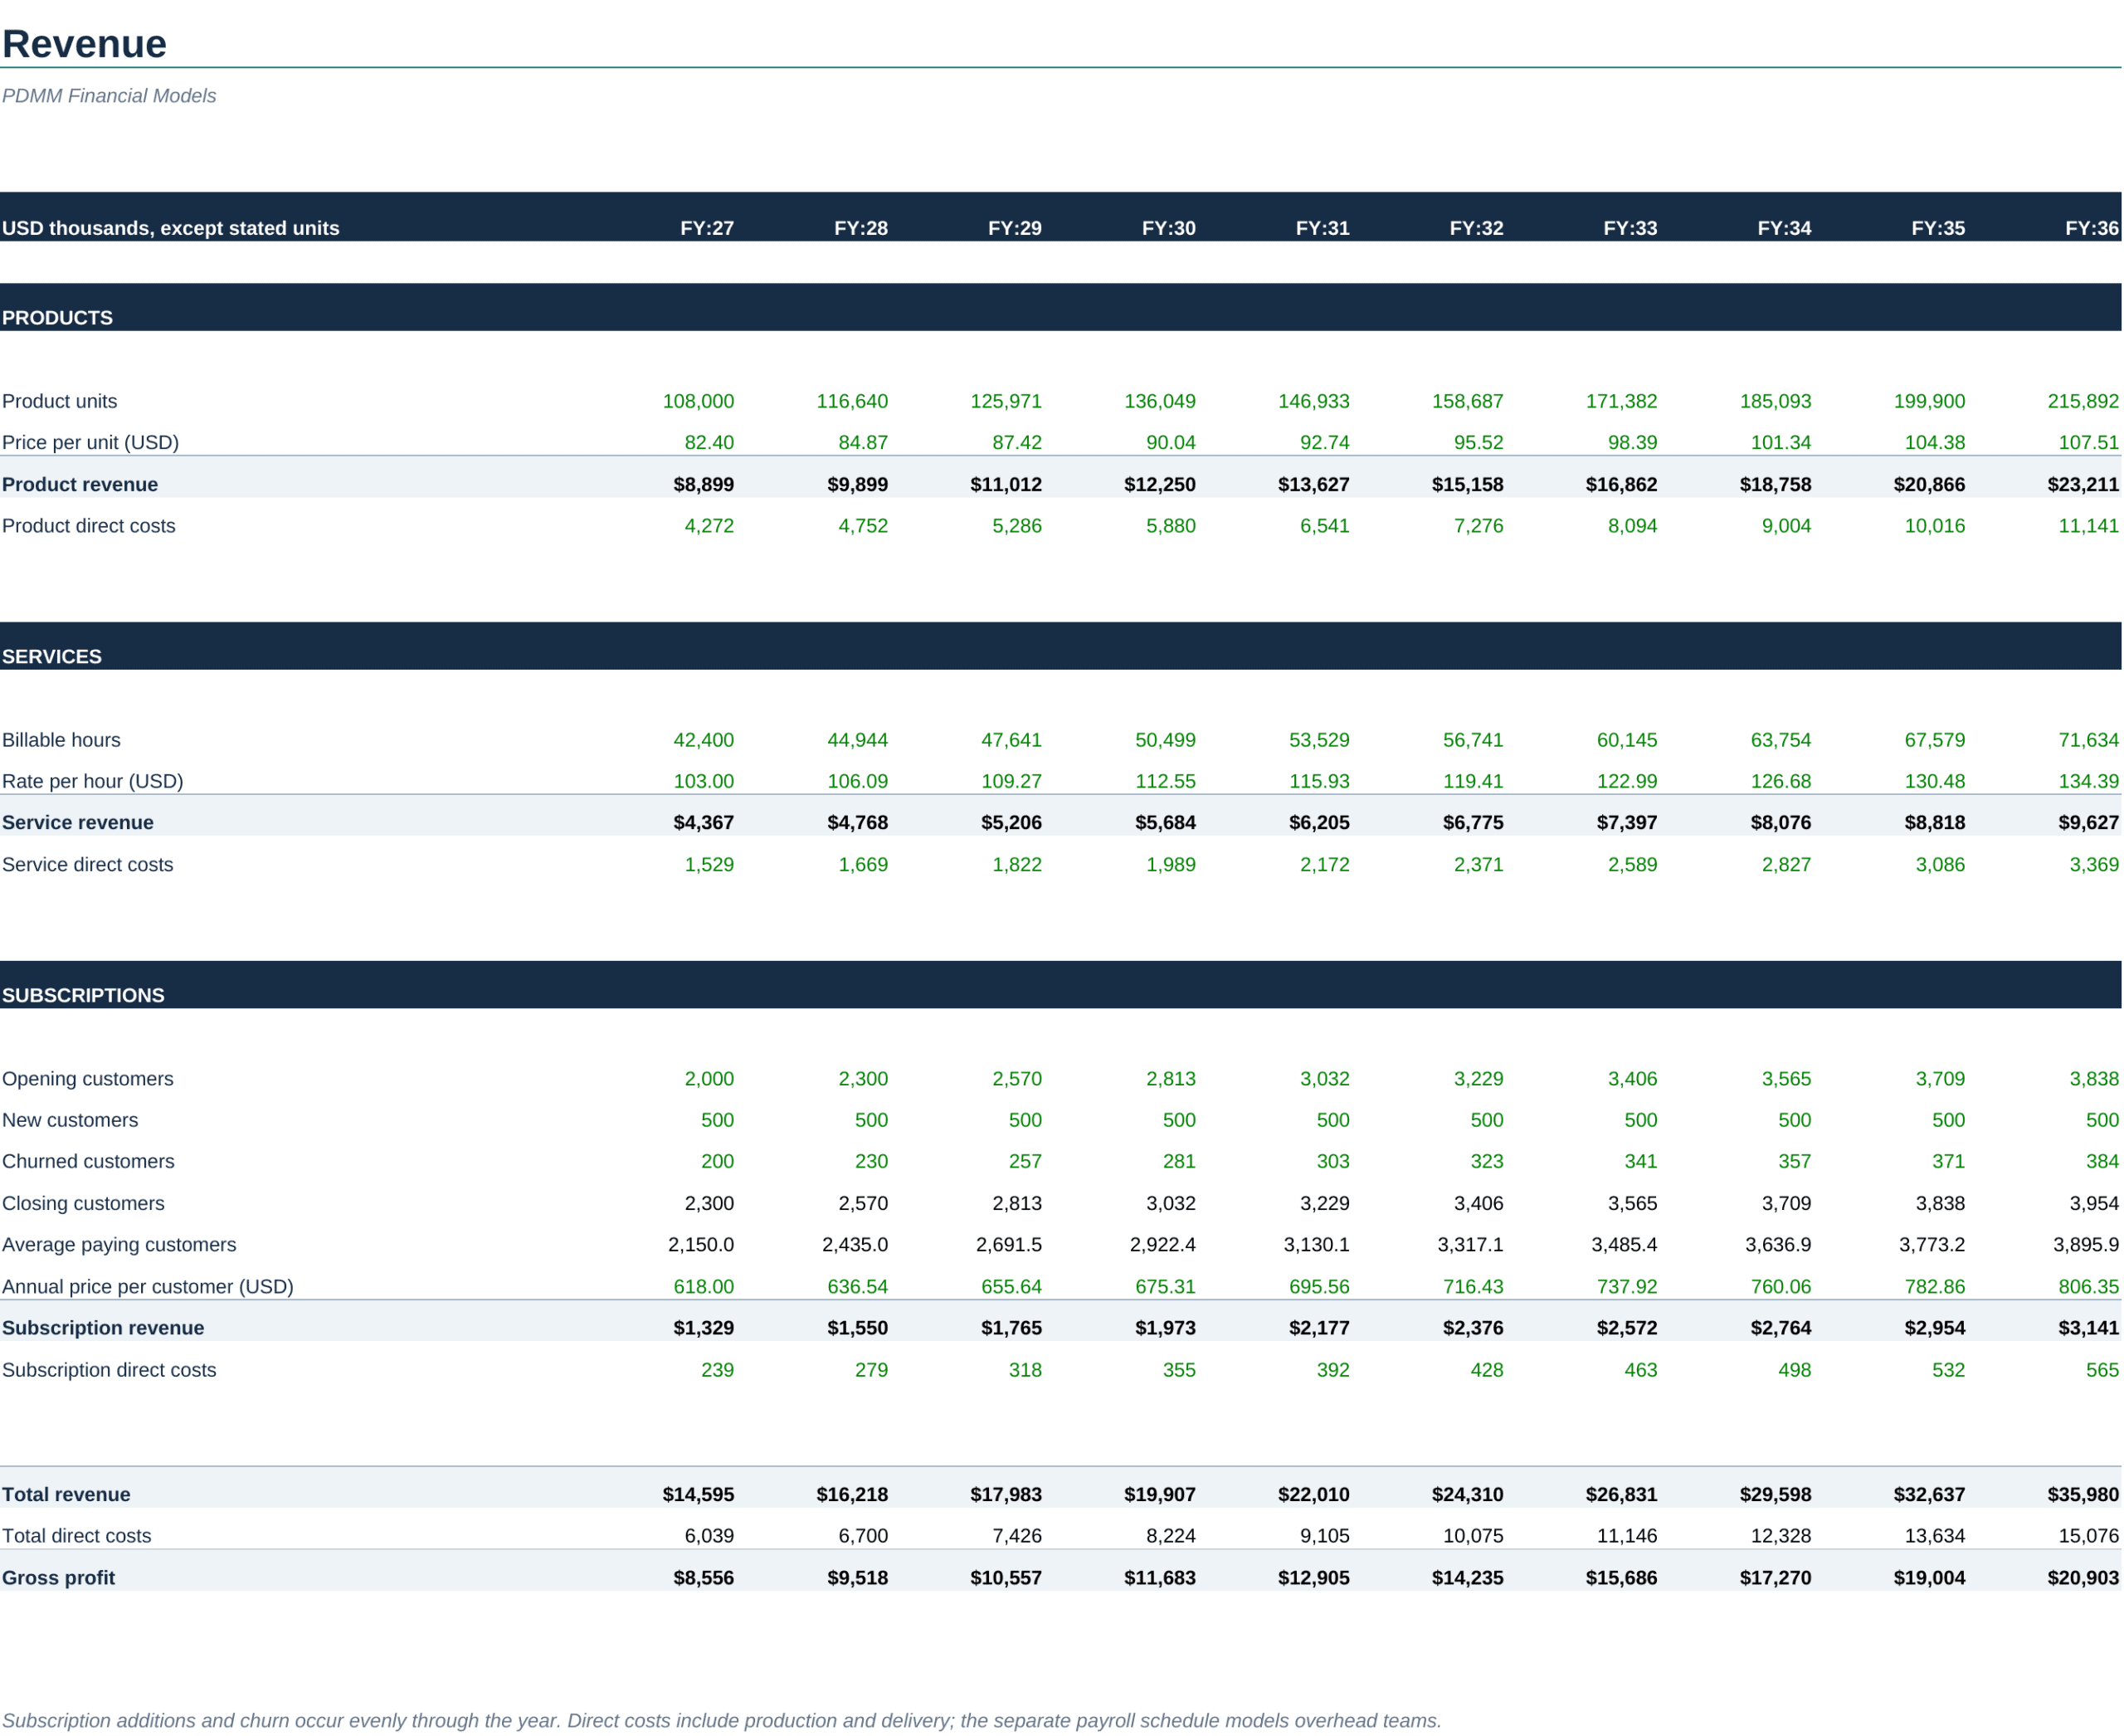
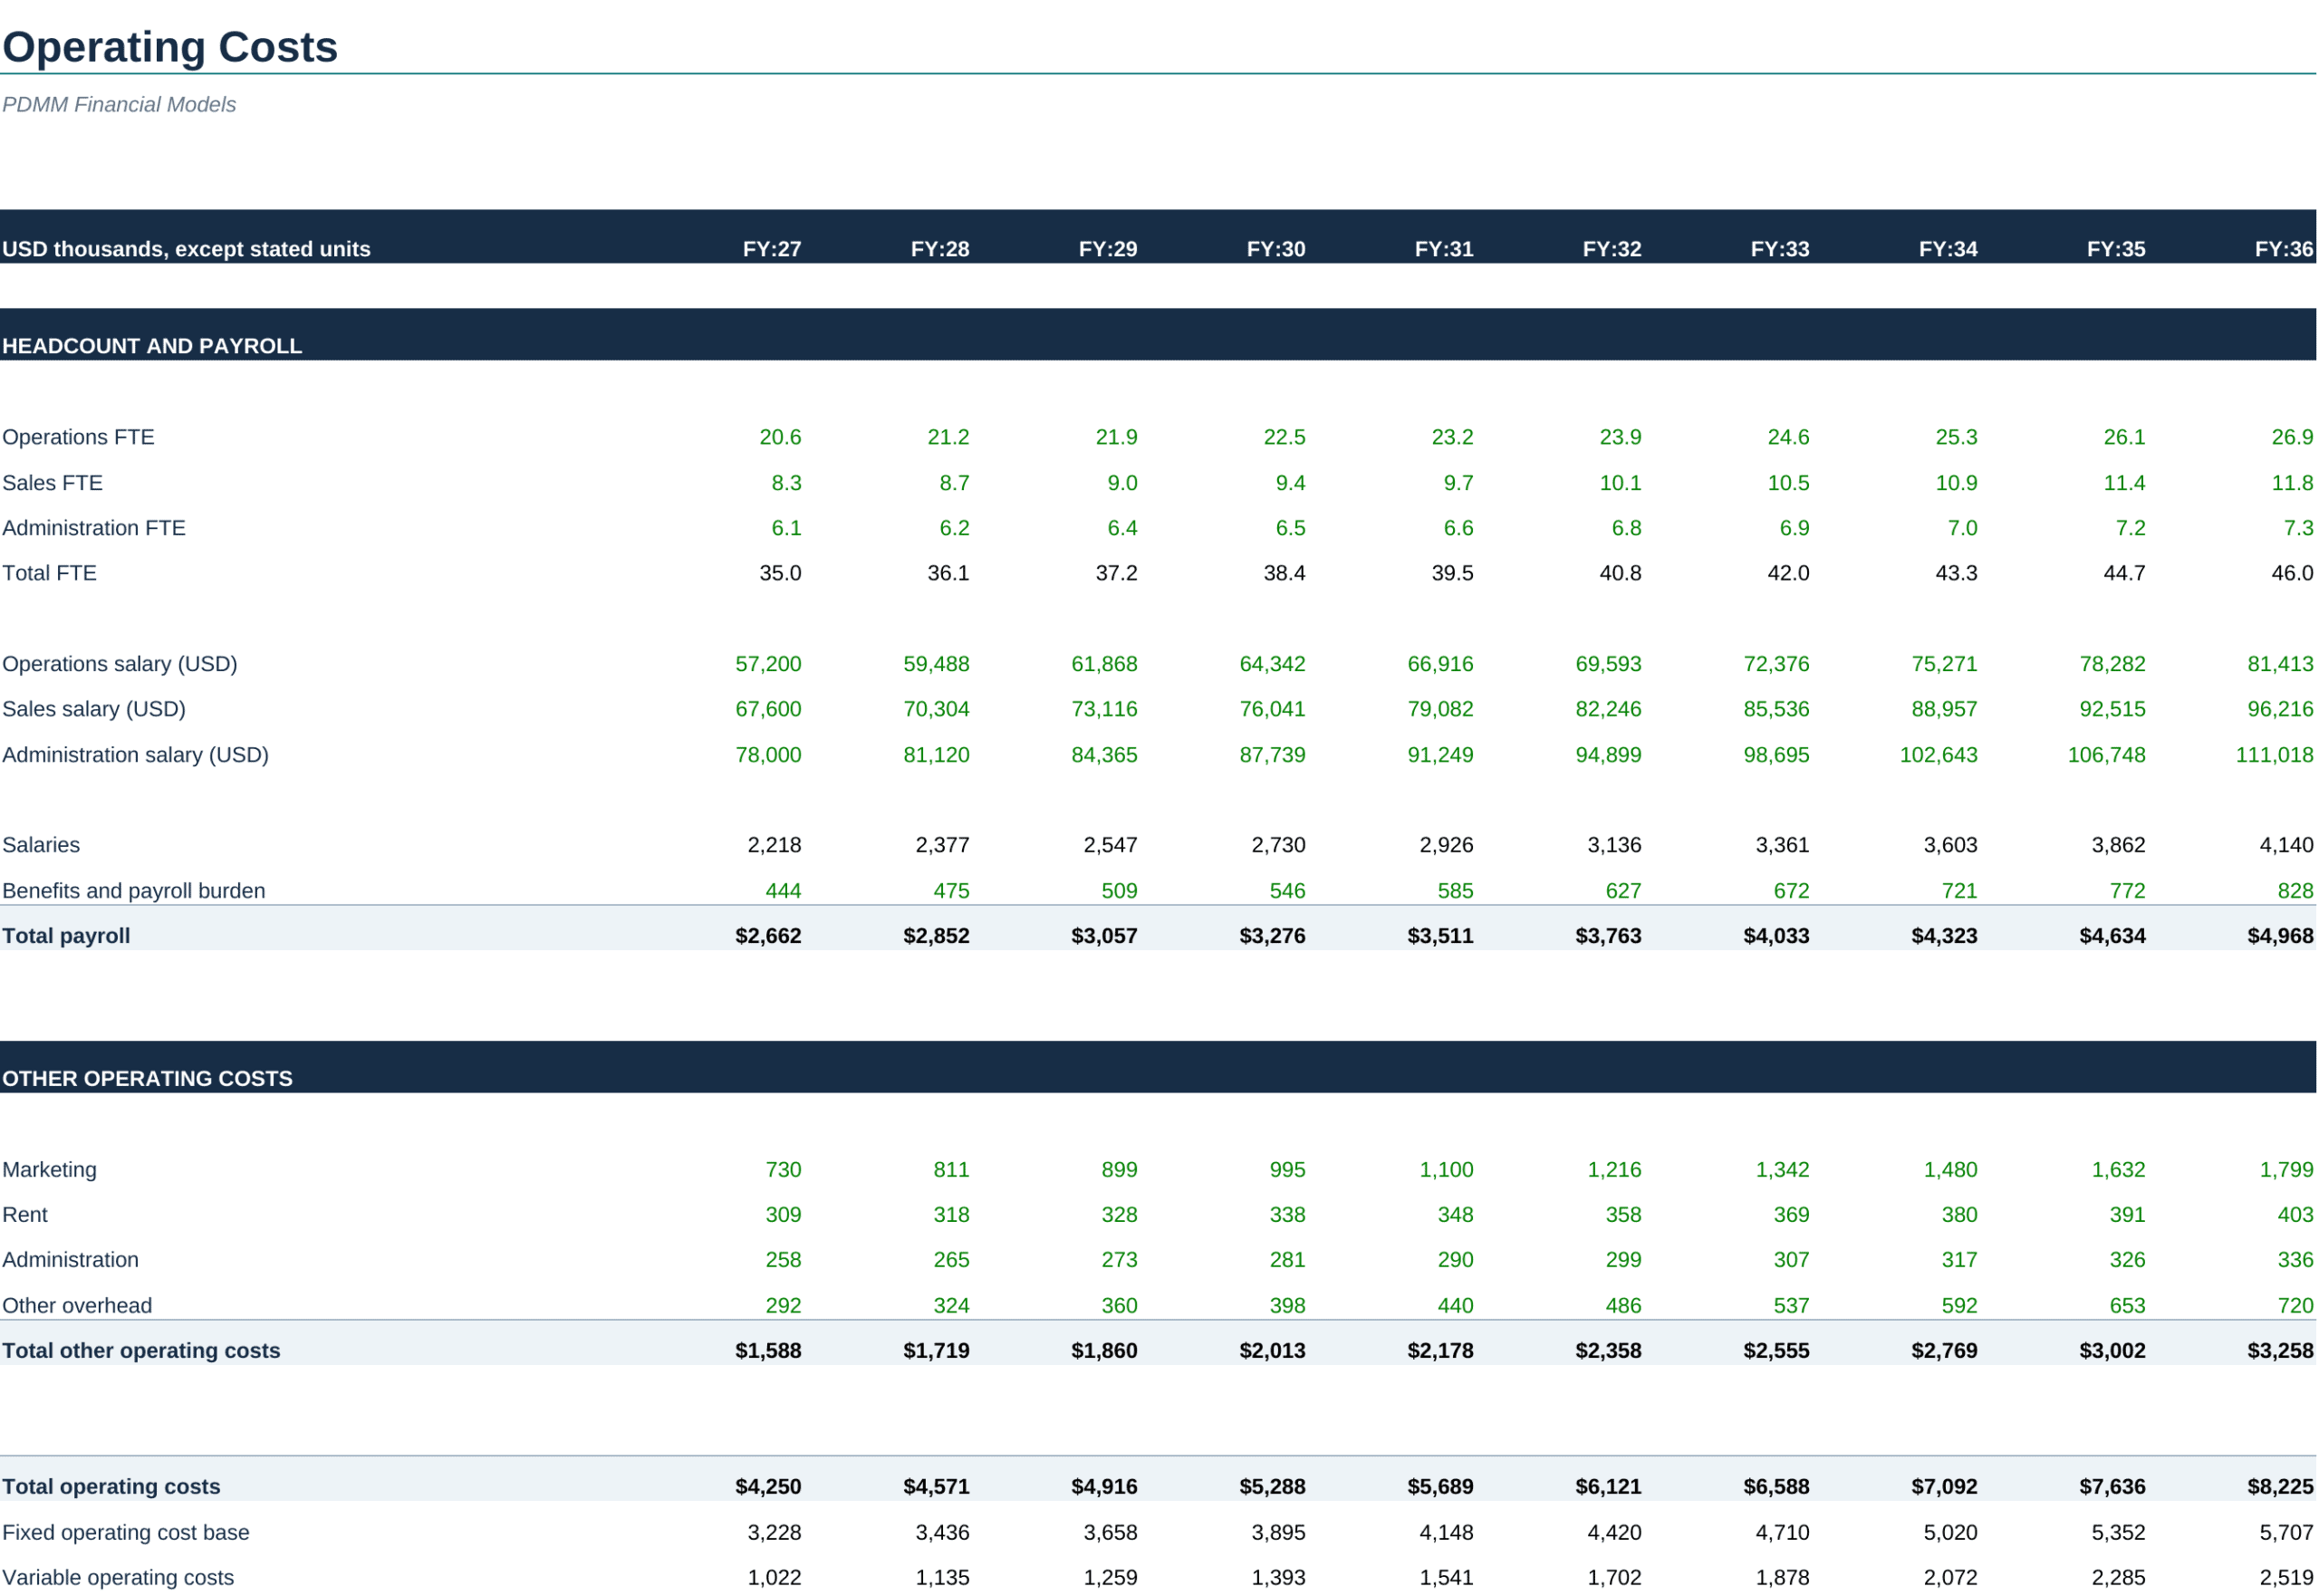
The model rolls product units and pricing into product revenue and direct costs; converts service hours and rates into service revenue and direct costs; and builds a subscriber roll-forward with opening customers, additions, churn, closing customers, average paying customers and subscription revenue. Staffing schedules calculate FTE, salaries, benefits and payroll, while other operating costs separate marketing, rent, administration and revenue-linked overhead.
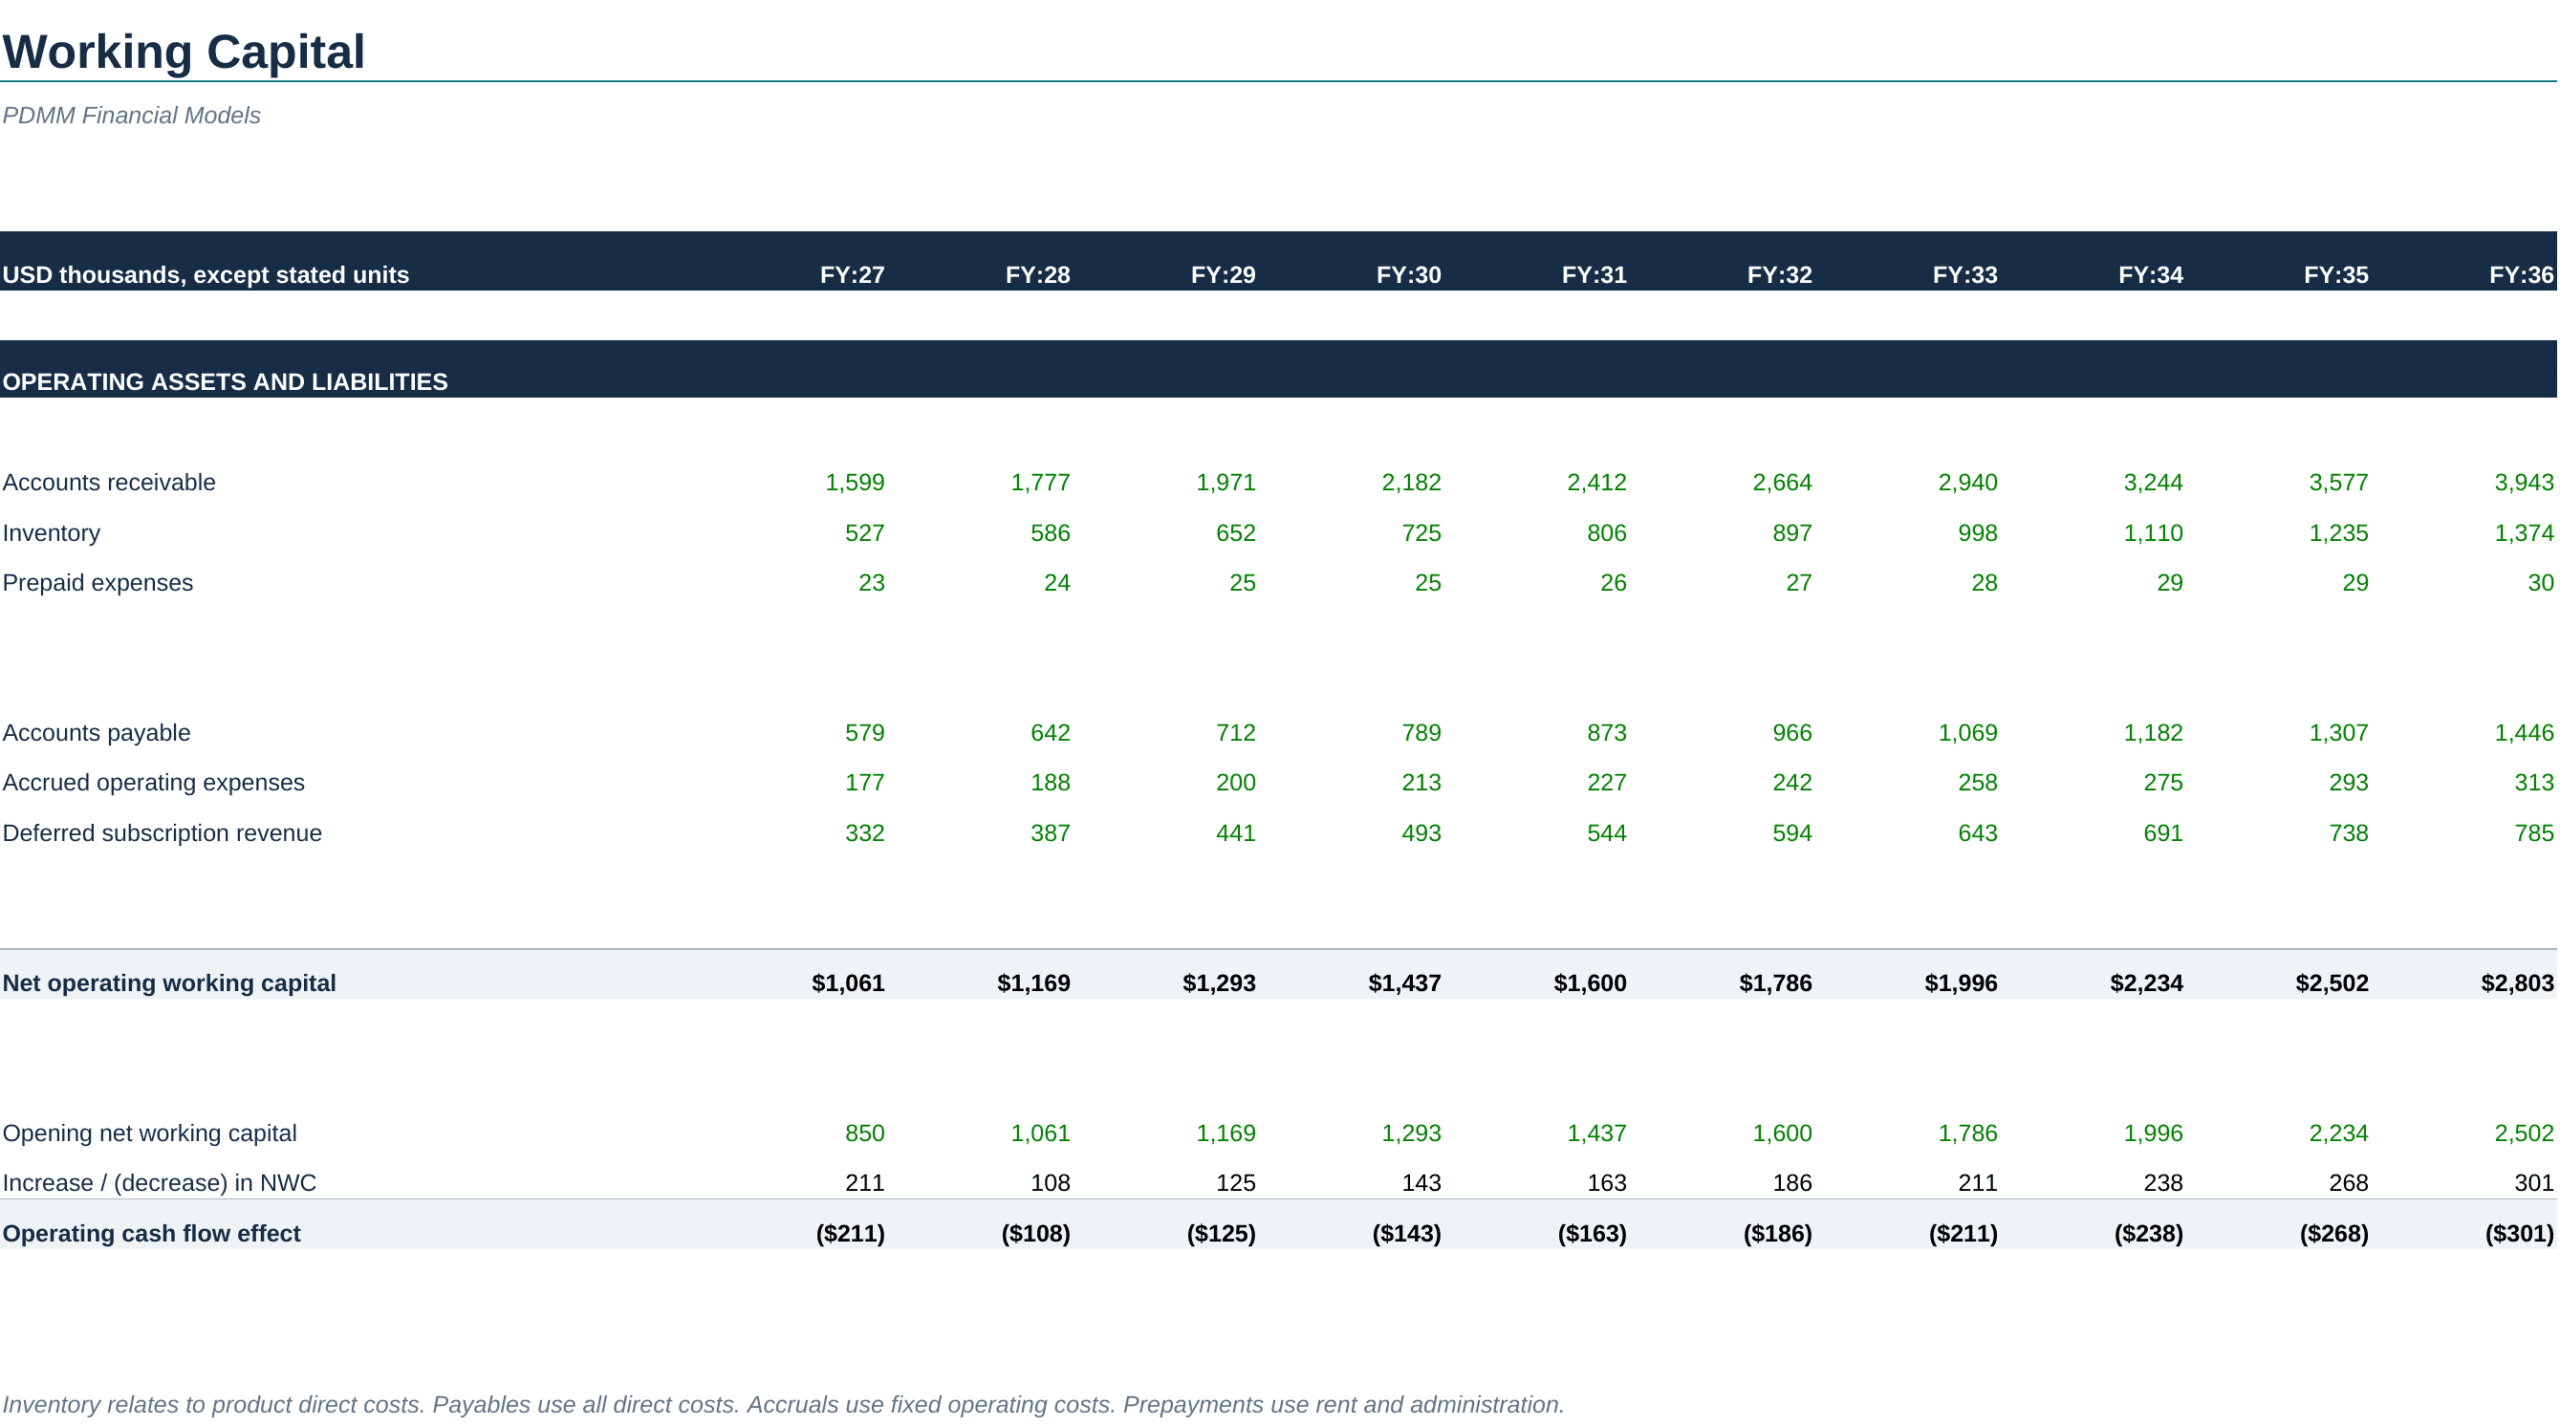
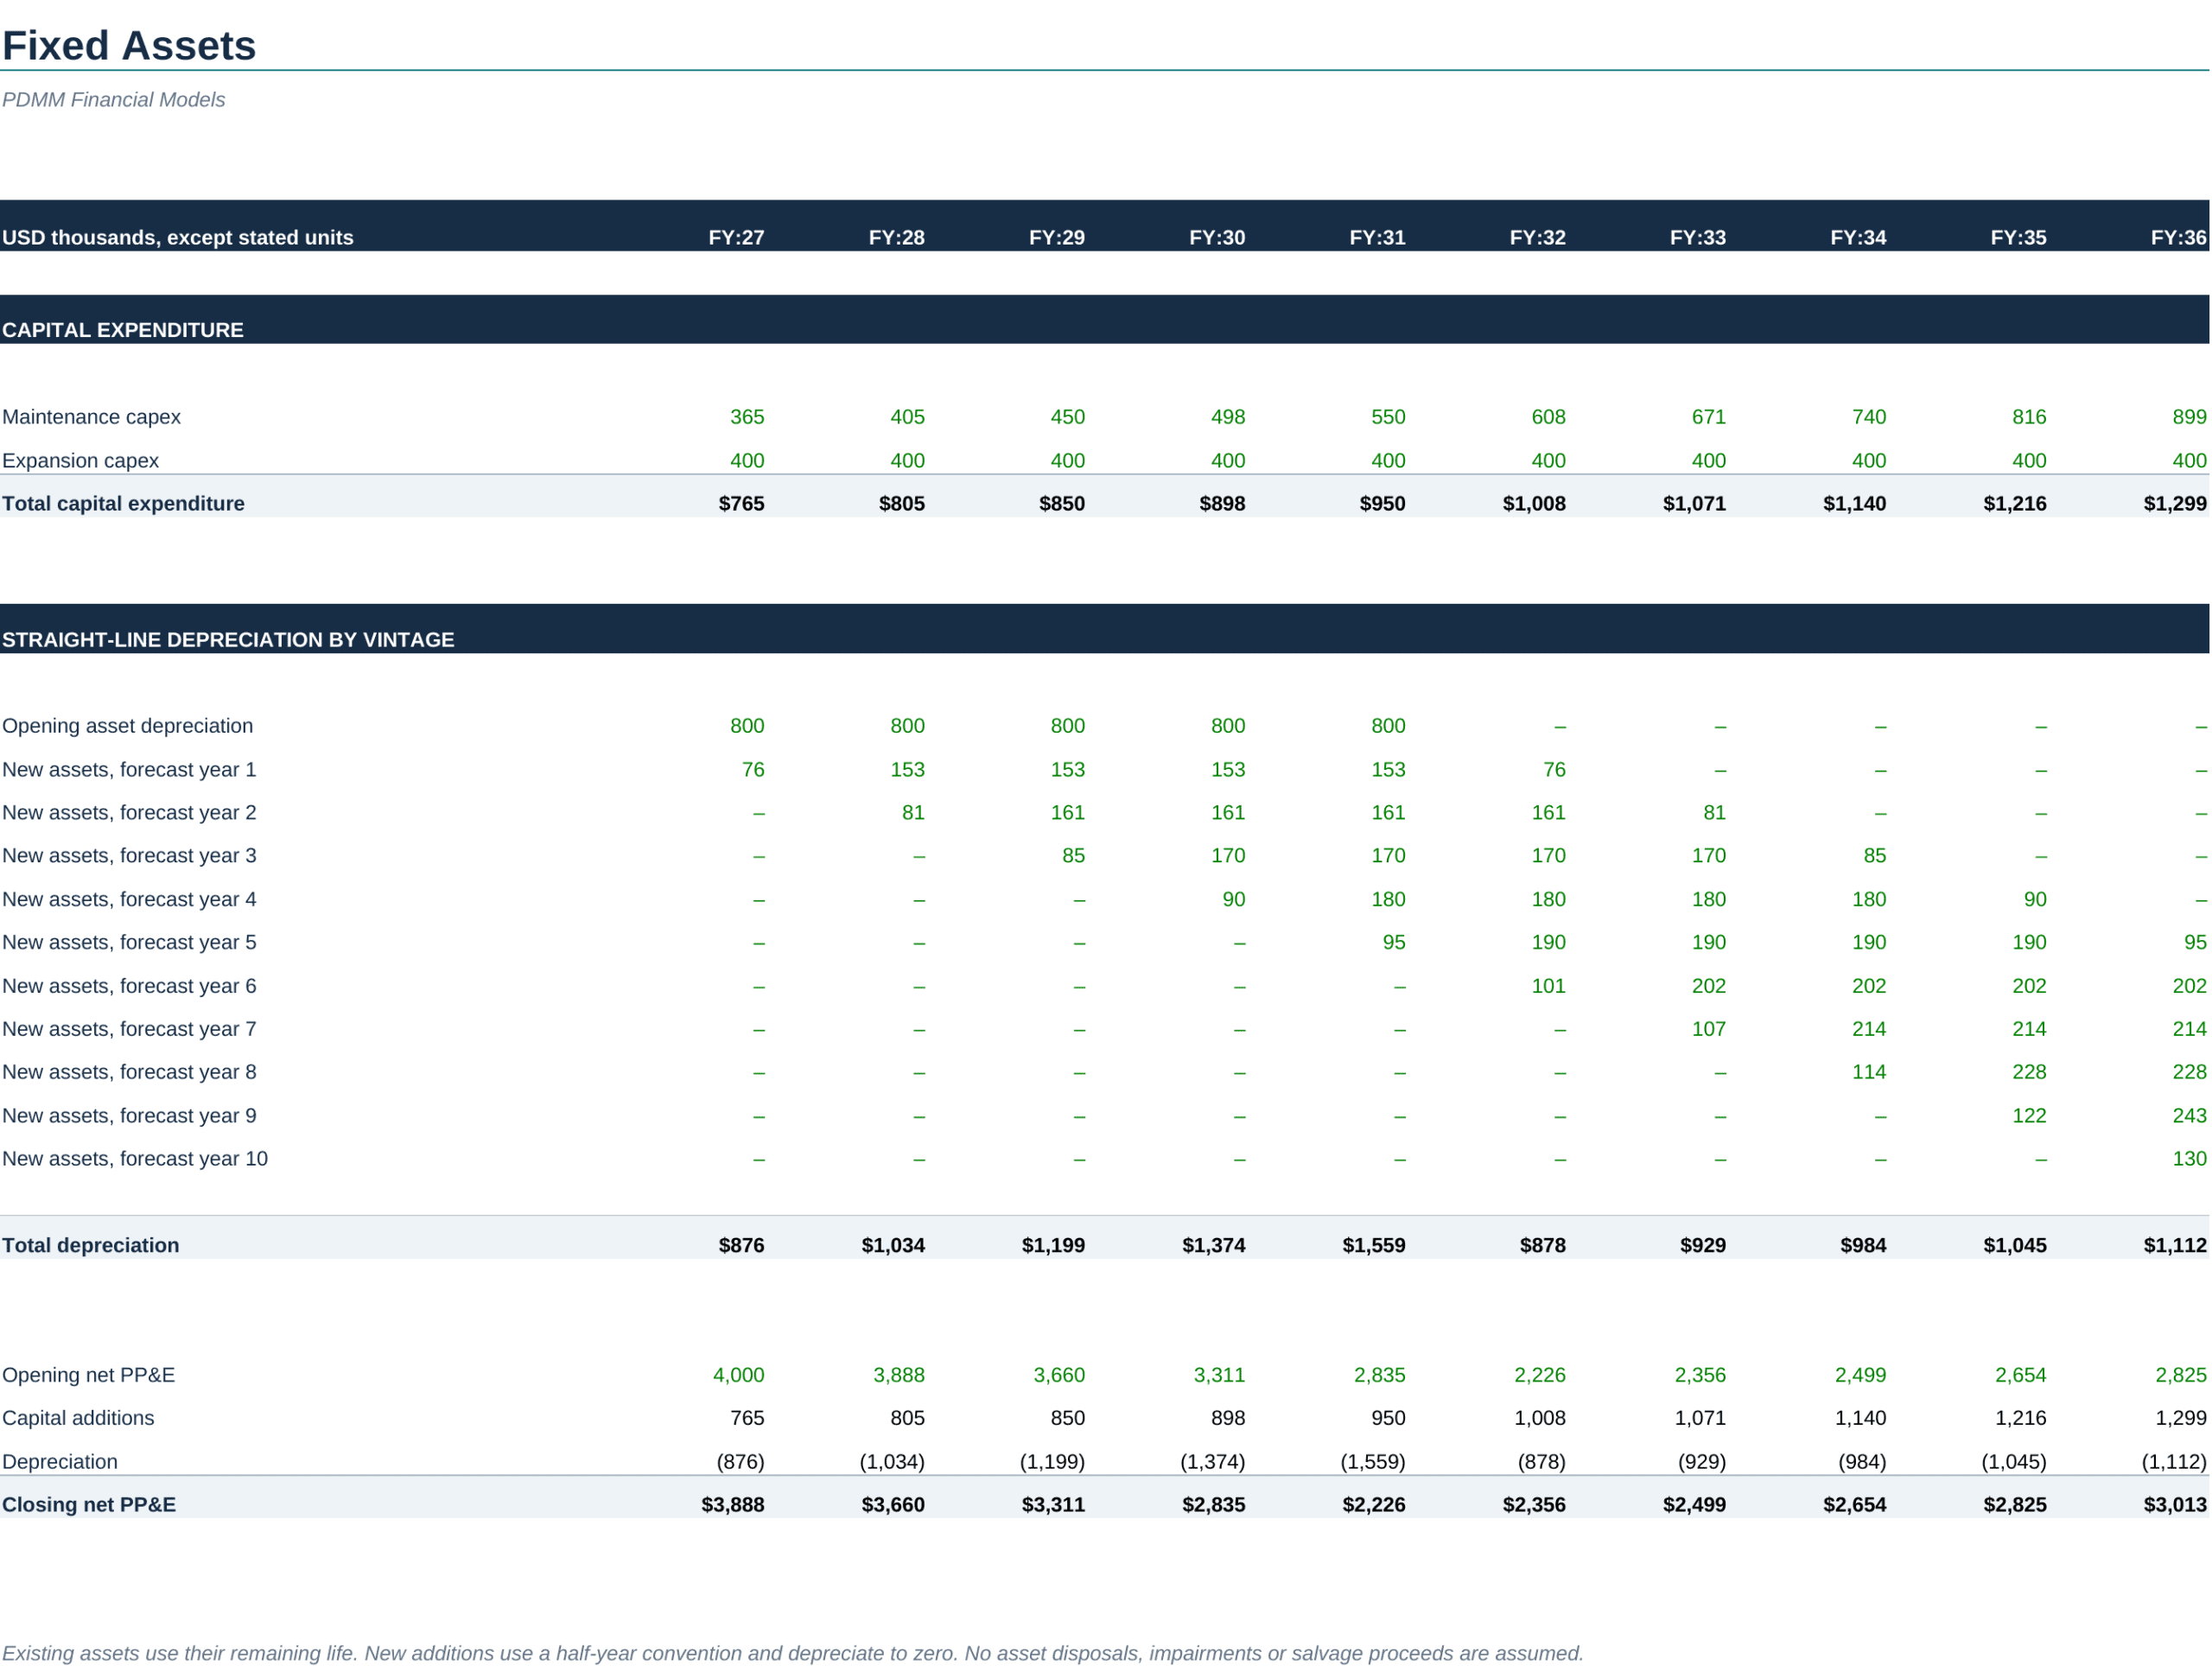
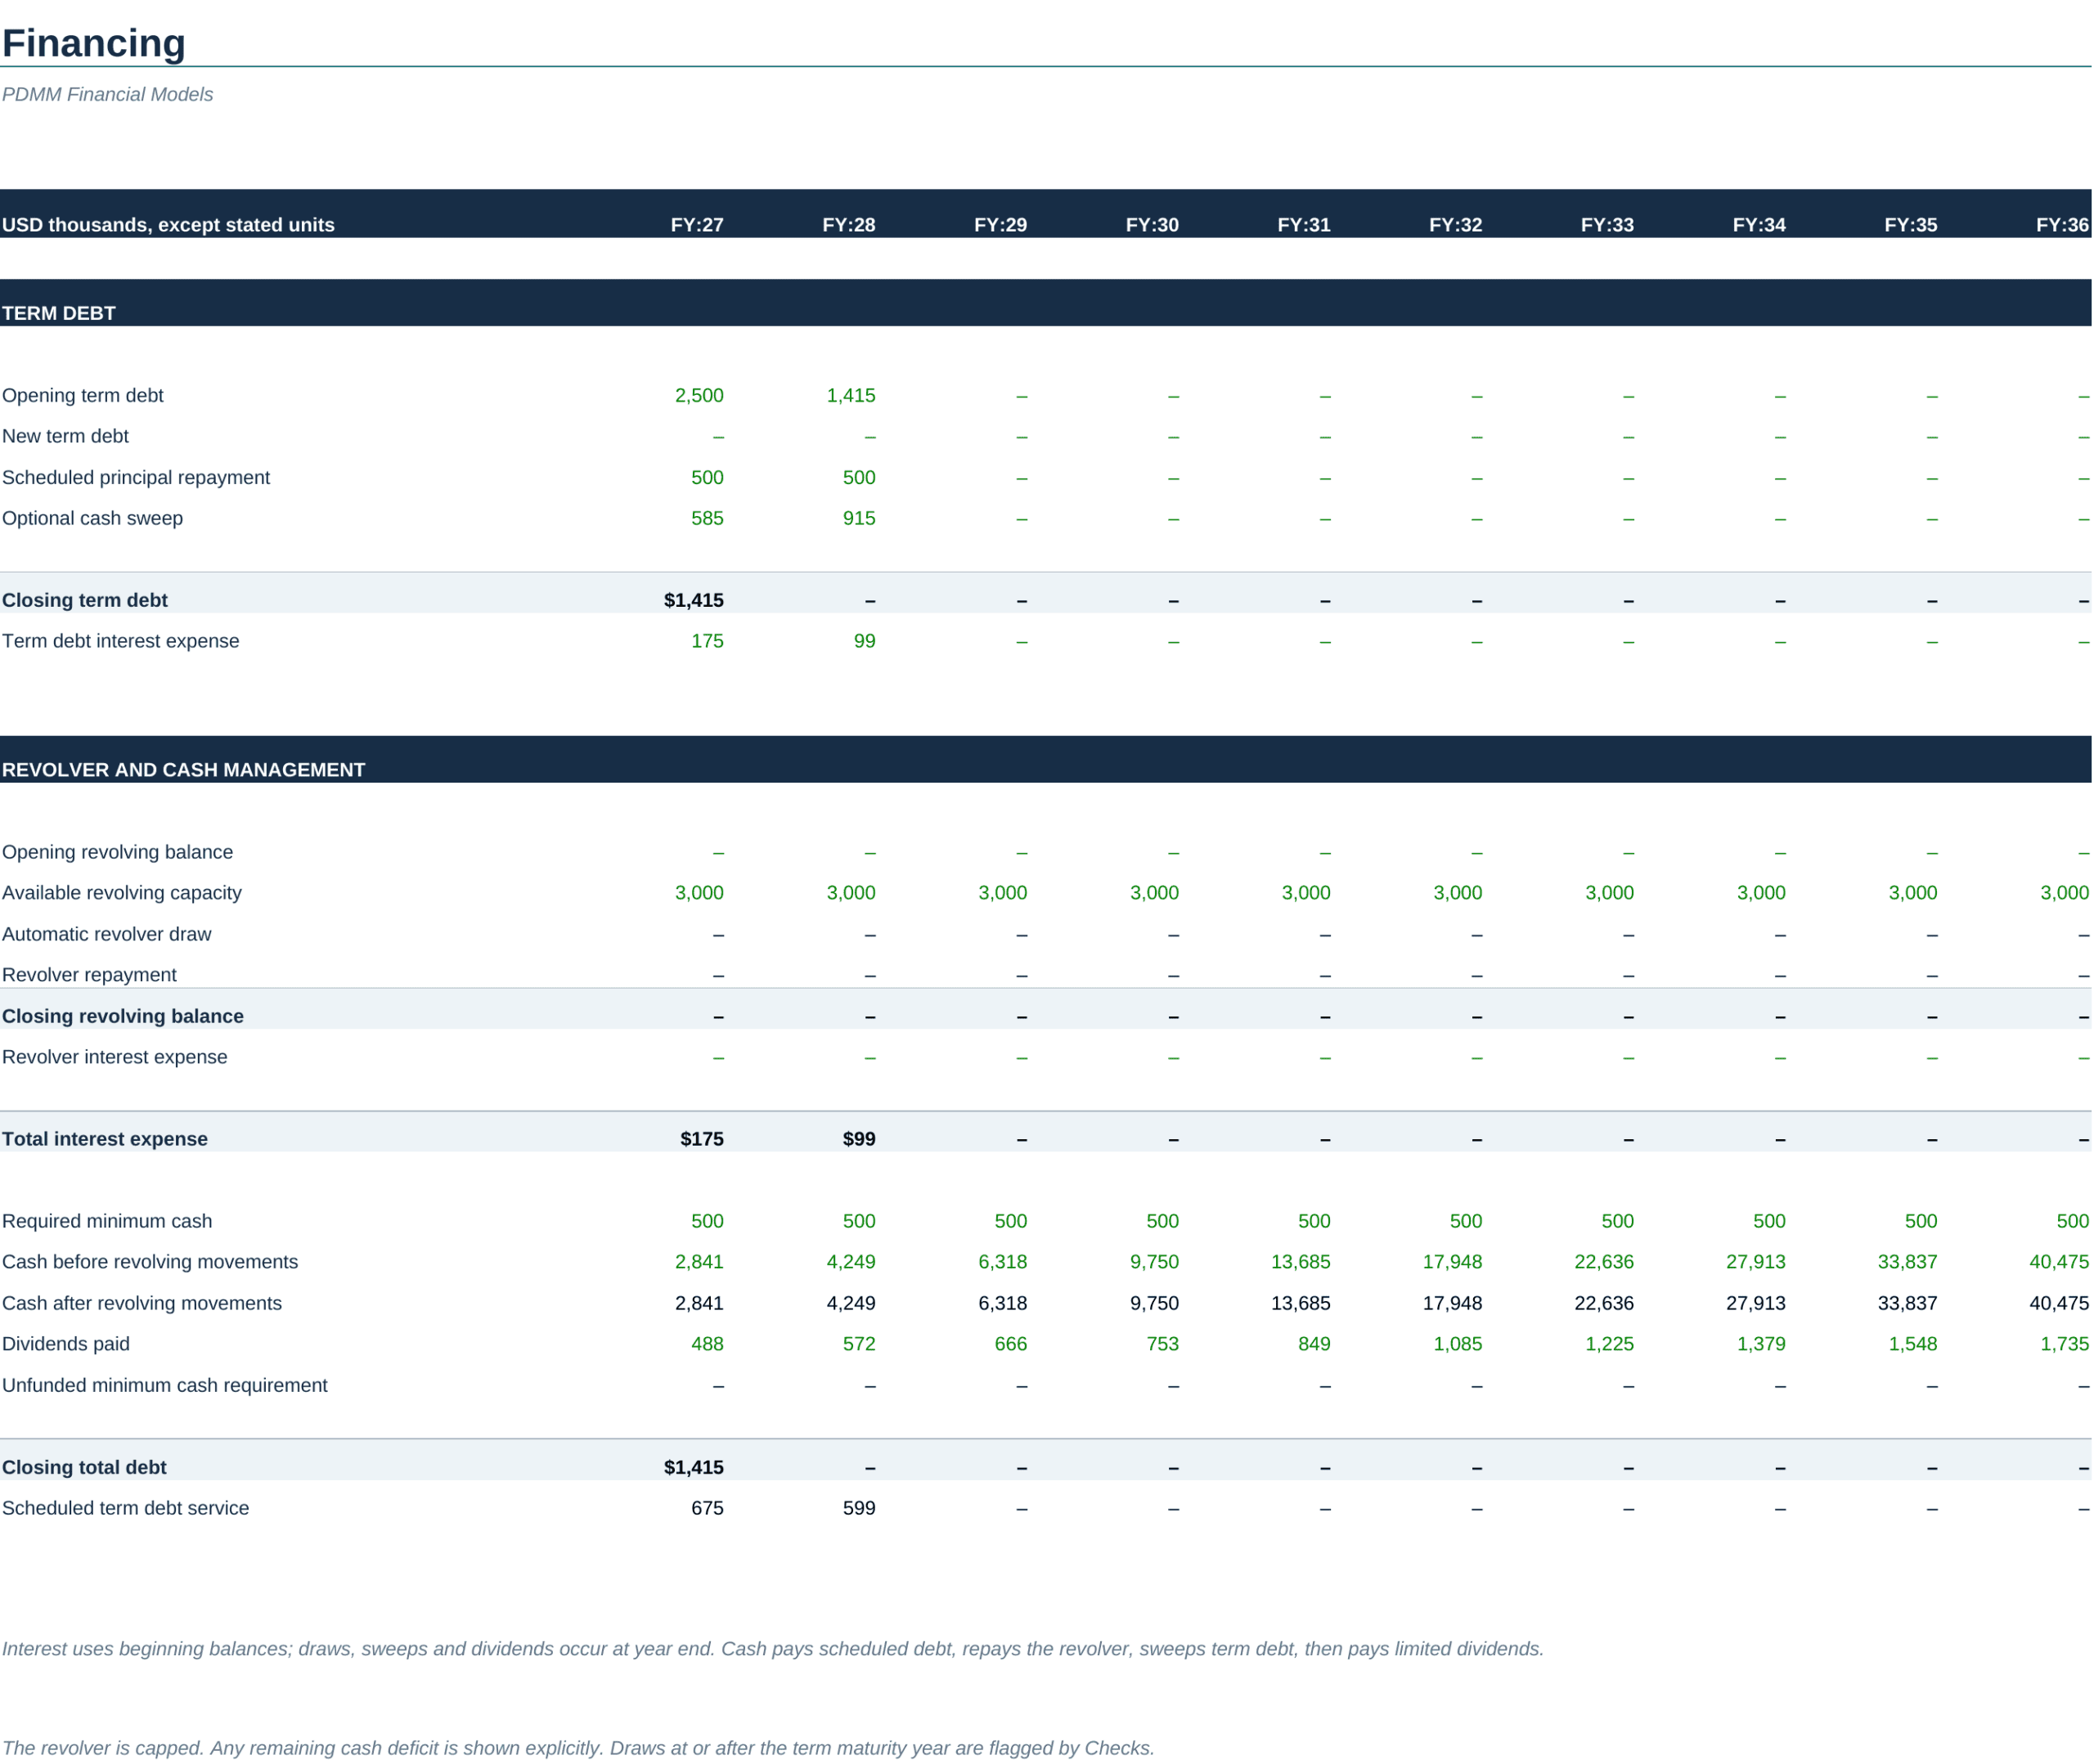
Working capital uses operating drivers such as receivable days, inventory days, payable days, accrued-cost days, prepaid-cost days and deferred subscription revenue. Fixed assets include maintenance and expansion capex, straight-line depreciation by forecast-year vintage, a half-year convention for new additions, and a PP&E roll-forward. Financing covers term debt, scheduled principal, optional cash sweeps, a capped revolver, beginning-balance interest, minimum cash, dividends and explicit unfunded cash requirements. Tax includes taxable profit, tax-loss generation/utilization and cash tax.
📑 Workbook structure – 19 worksheets
- Start Here: workflow, conventions, scope and usage guidance.
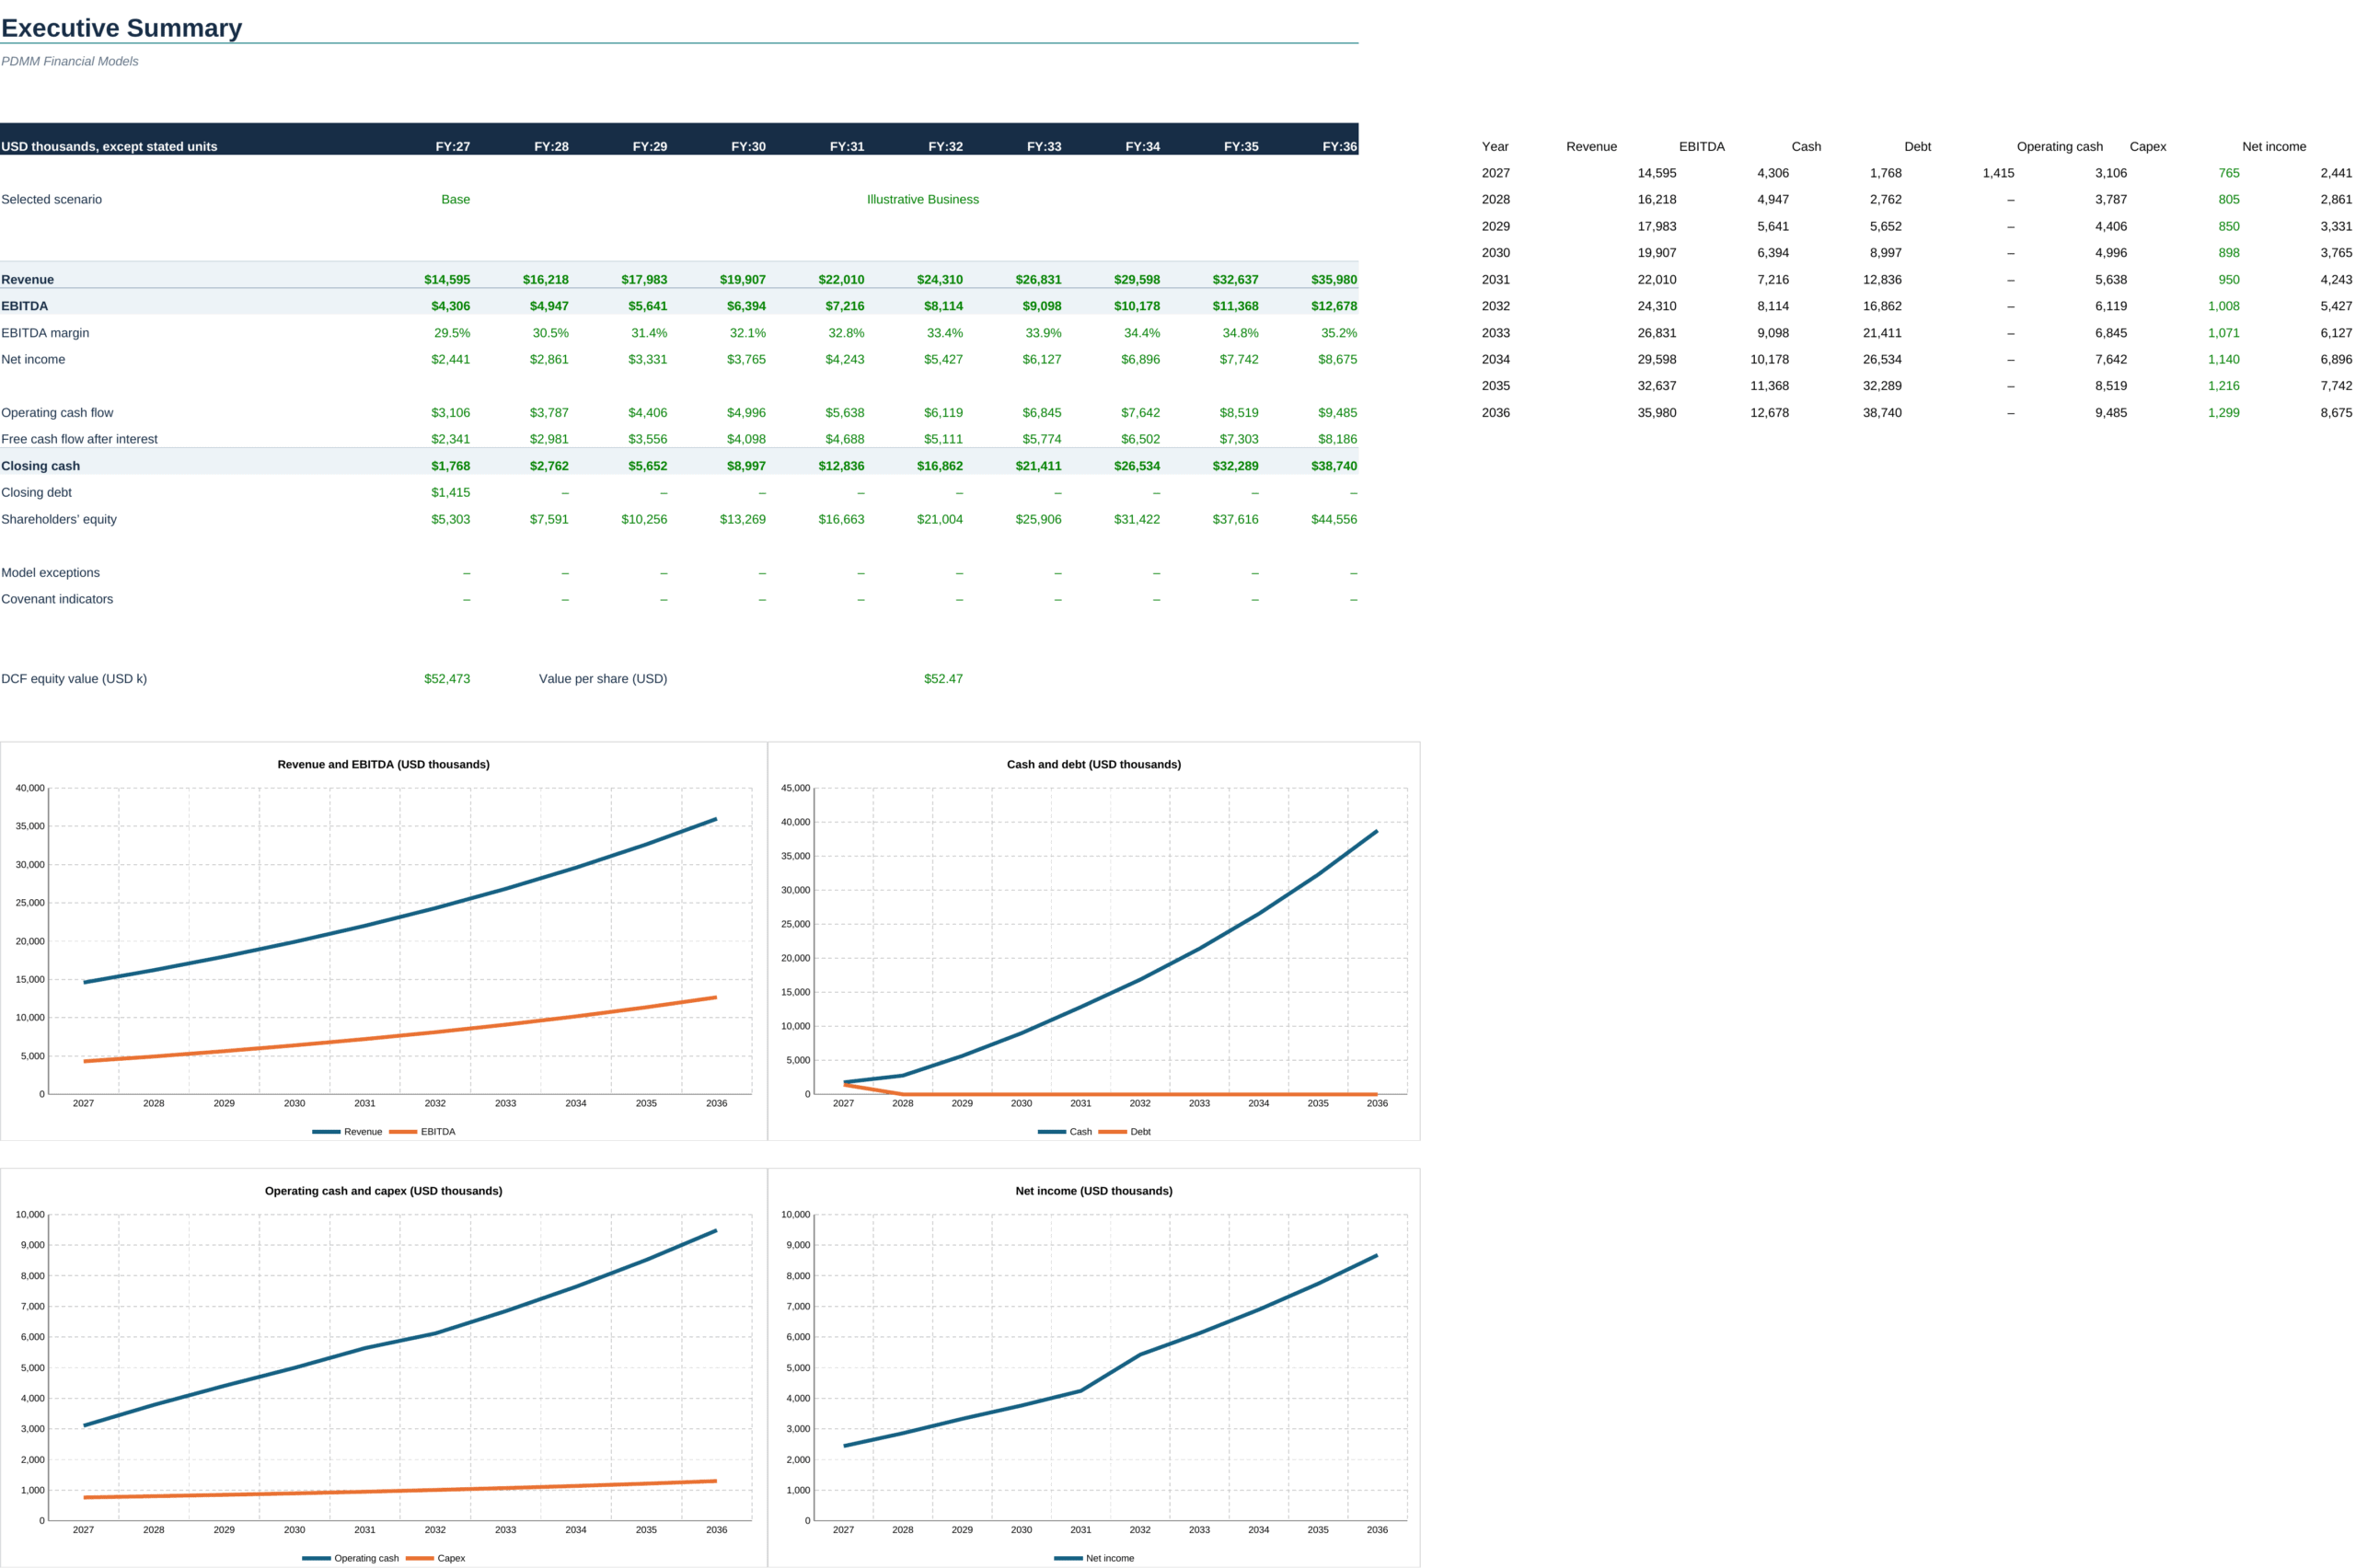
- Executive Summary: 10-year KPI summary plus four charts for revenue/EBITDA, cash/debt, operating cash/capex and net income.
- Setup: central model controls and opening operating, financing and valuation policies.
- Assumptions: ten annual columns for Base, Upside and Downside operating and financing assumptions.
- Opening Balances: starting assets, liabilities and equity with an opening-balance difference line.
- Revenue: product, service and subscription operating schedules and gross profit.
- Operating Costs: headcount, salaries, benefits, marketing, rent, administration and overhead.
- Working Capital: receivables, inventory, prepayments, payables, accruals, deferred revenue and cash-flow effect.
- Fixed Assets: capex, depreciation by vintage and net PP&E roll-forward.
- Financing: term debt, revolver, cash management, interest, dividends, cash sweep and debt service.
- Tax: profit before tax, tax-loss carryforwards, taxable profit and cash tax.
- Income Statement: revenue through net income and margin analysis.
- Balance Sheet: current assets, PP&E, liabilities, debt classification and equity.
- Cash Flow: operating, investing and financing cash flows plus free cash flow after interest.
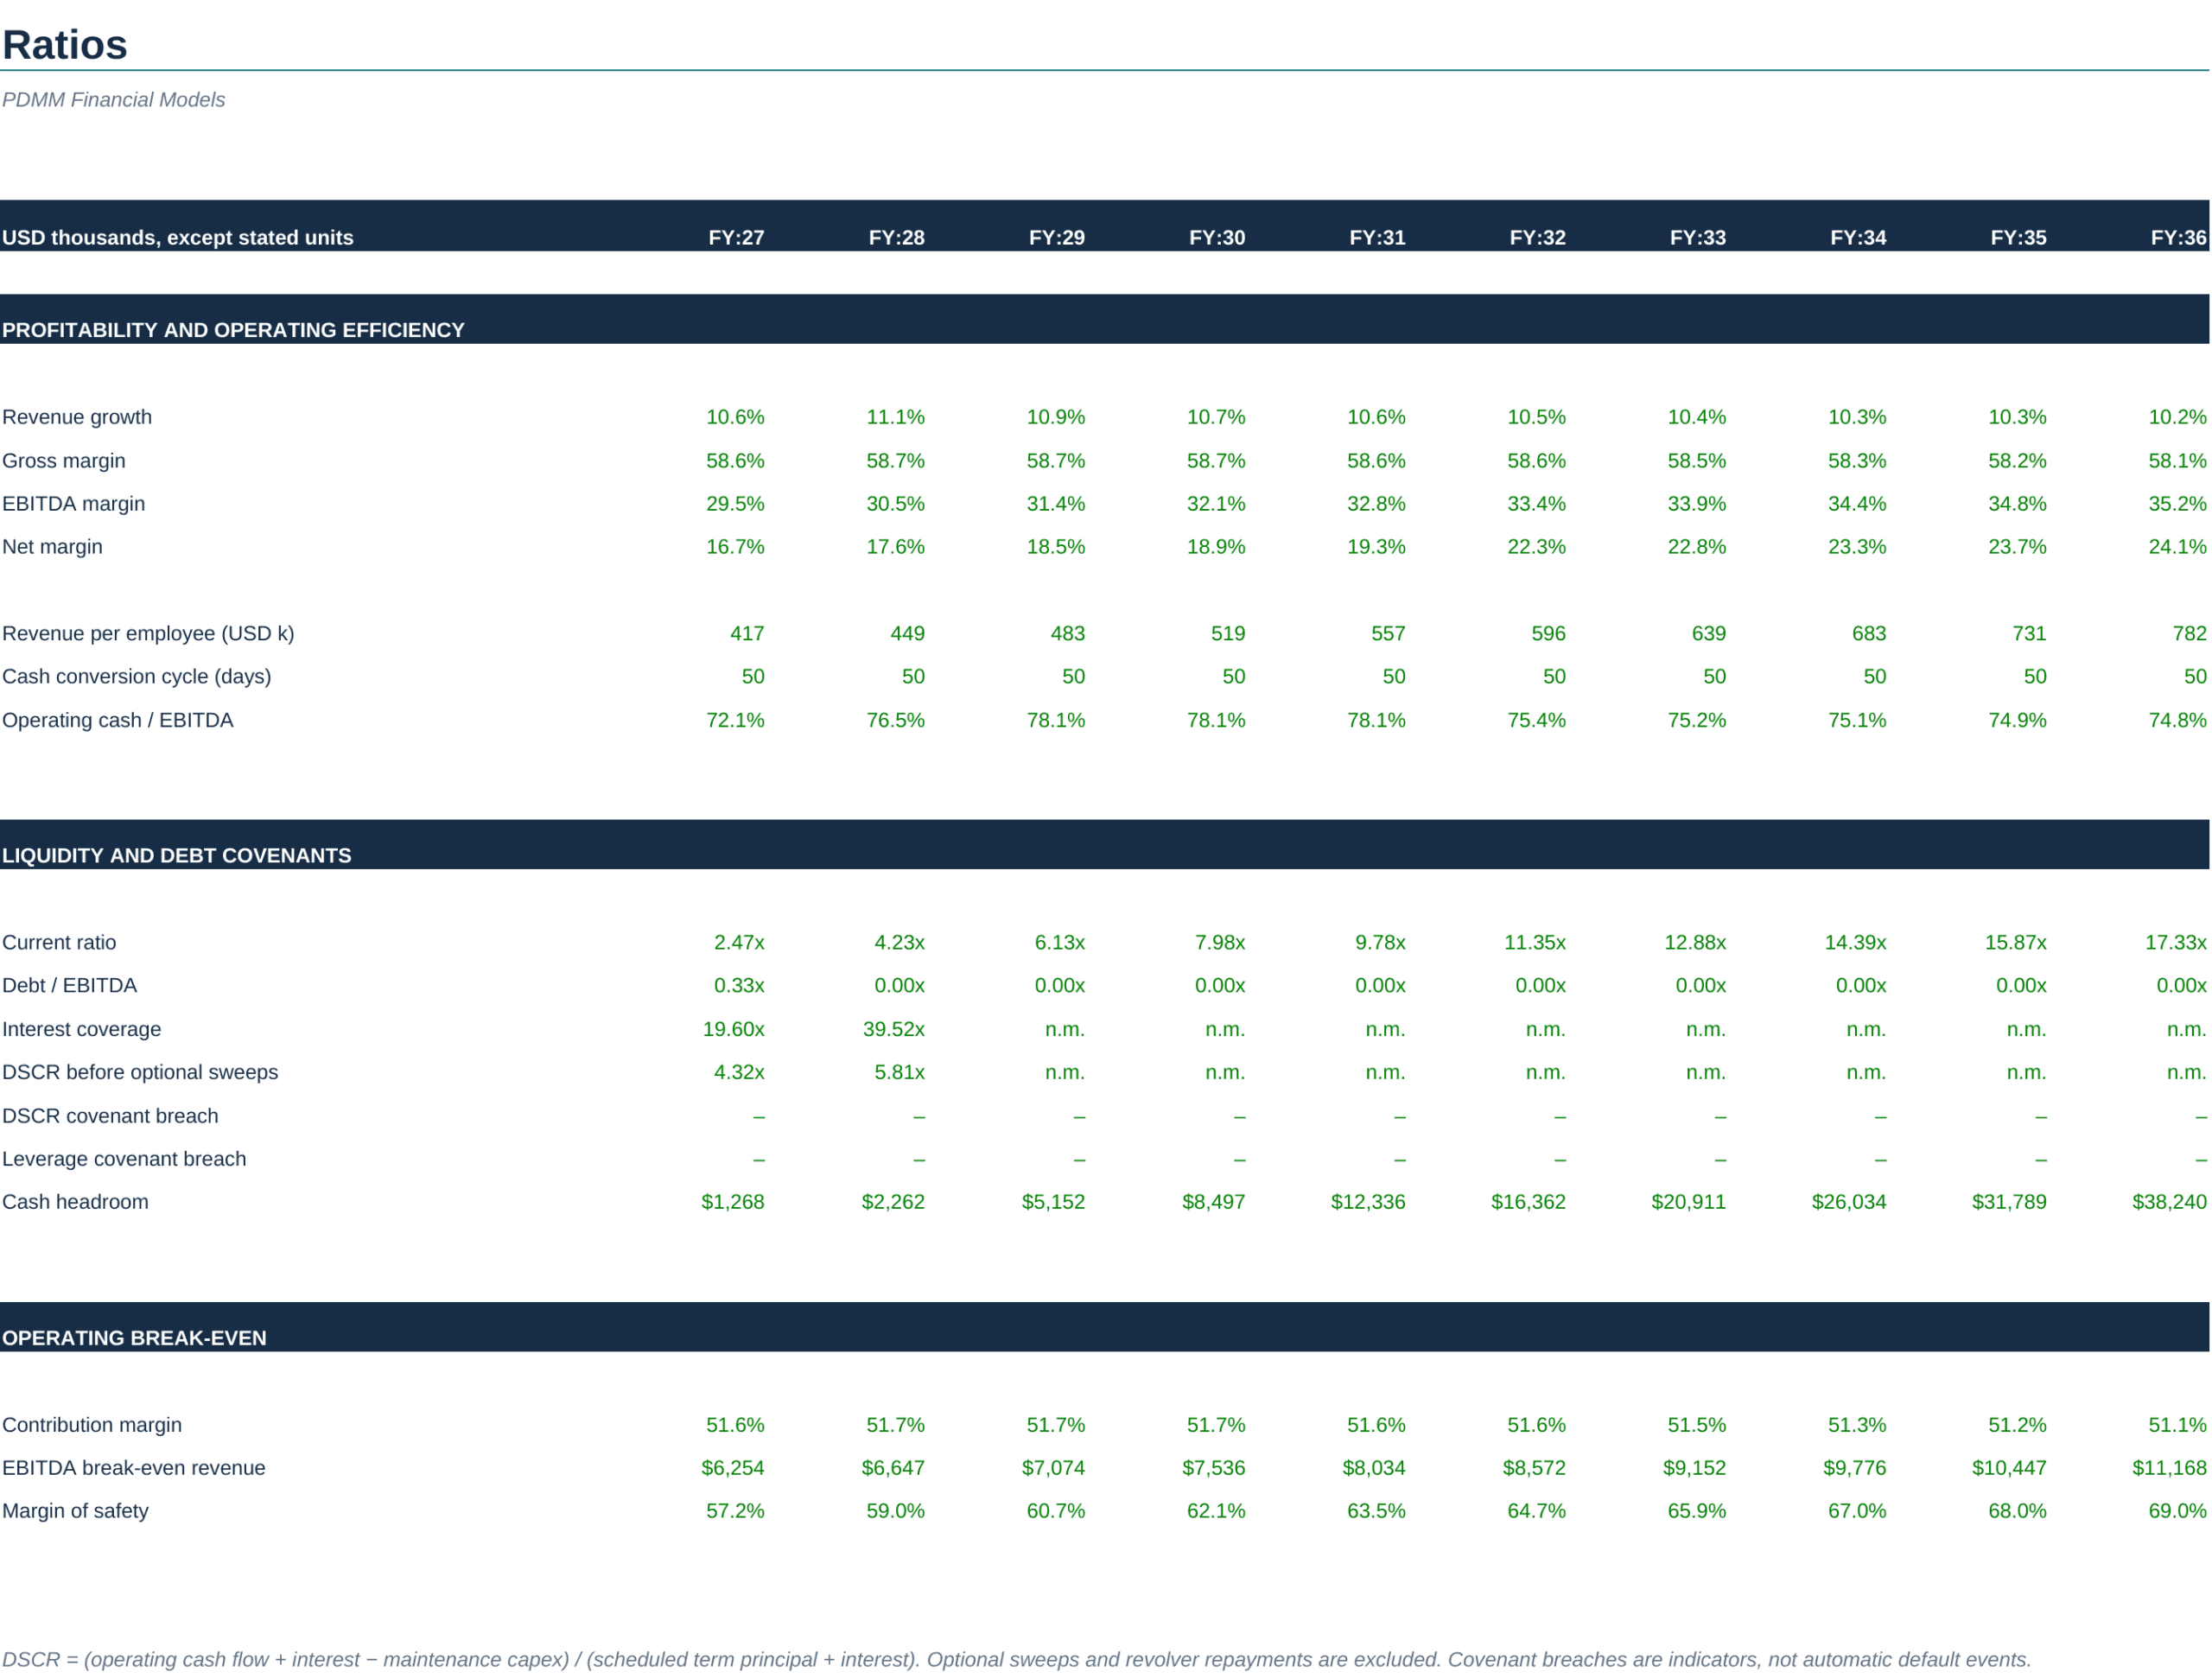
- Ratios: growth, margins, revenue per employee, cash conversion, liquidity, leverage, covenant indicators and break-even.
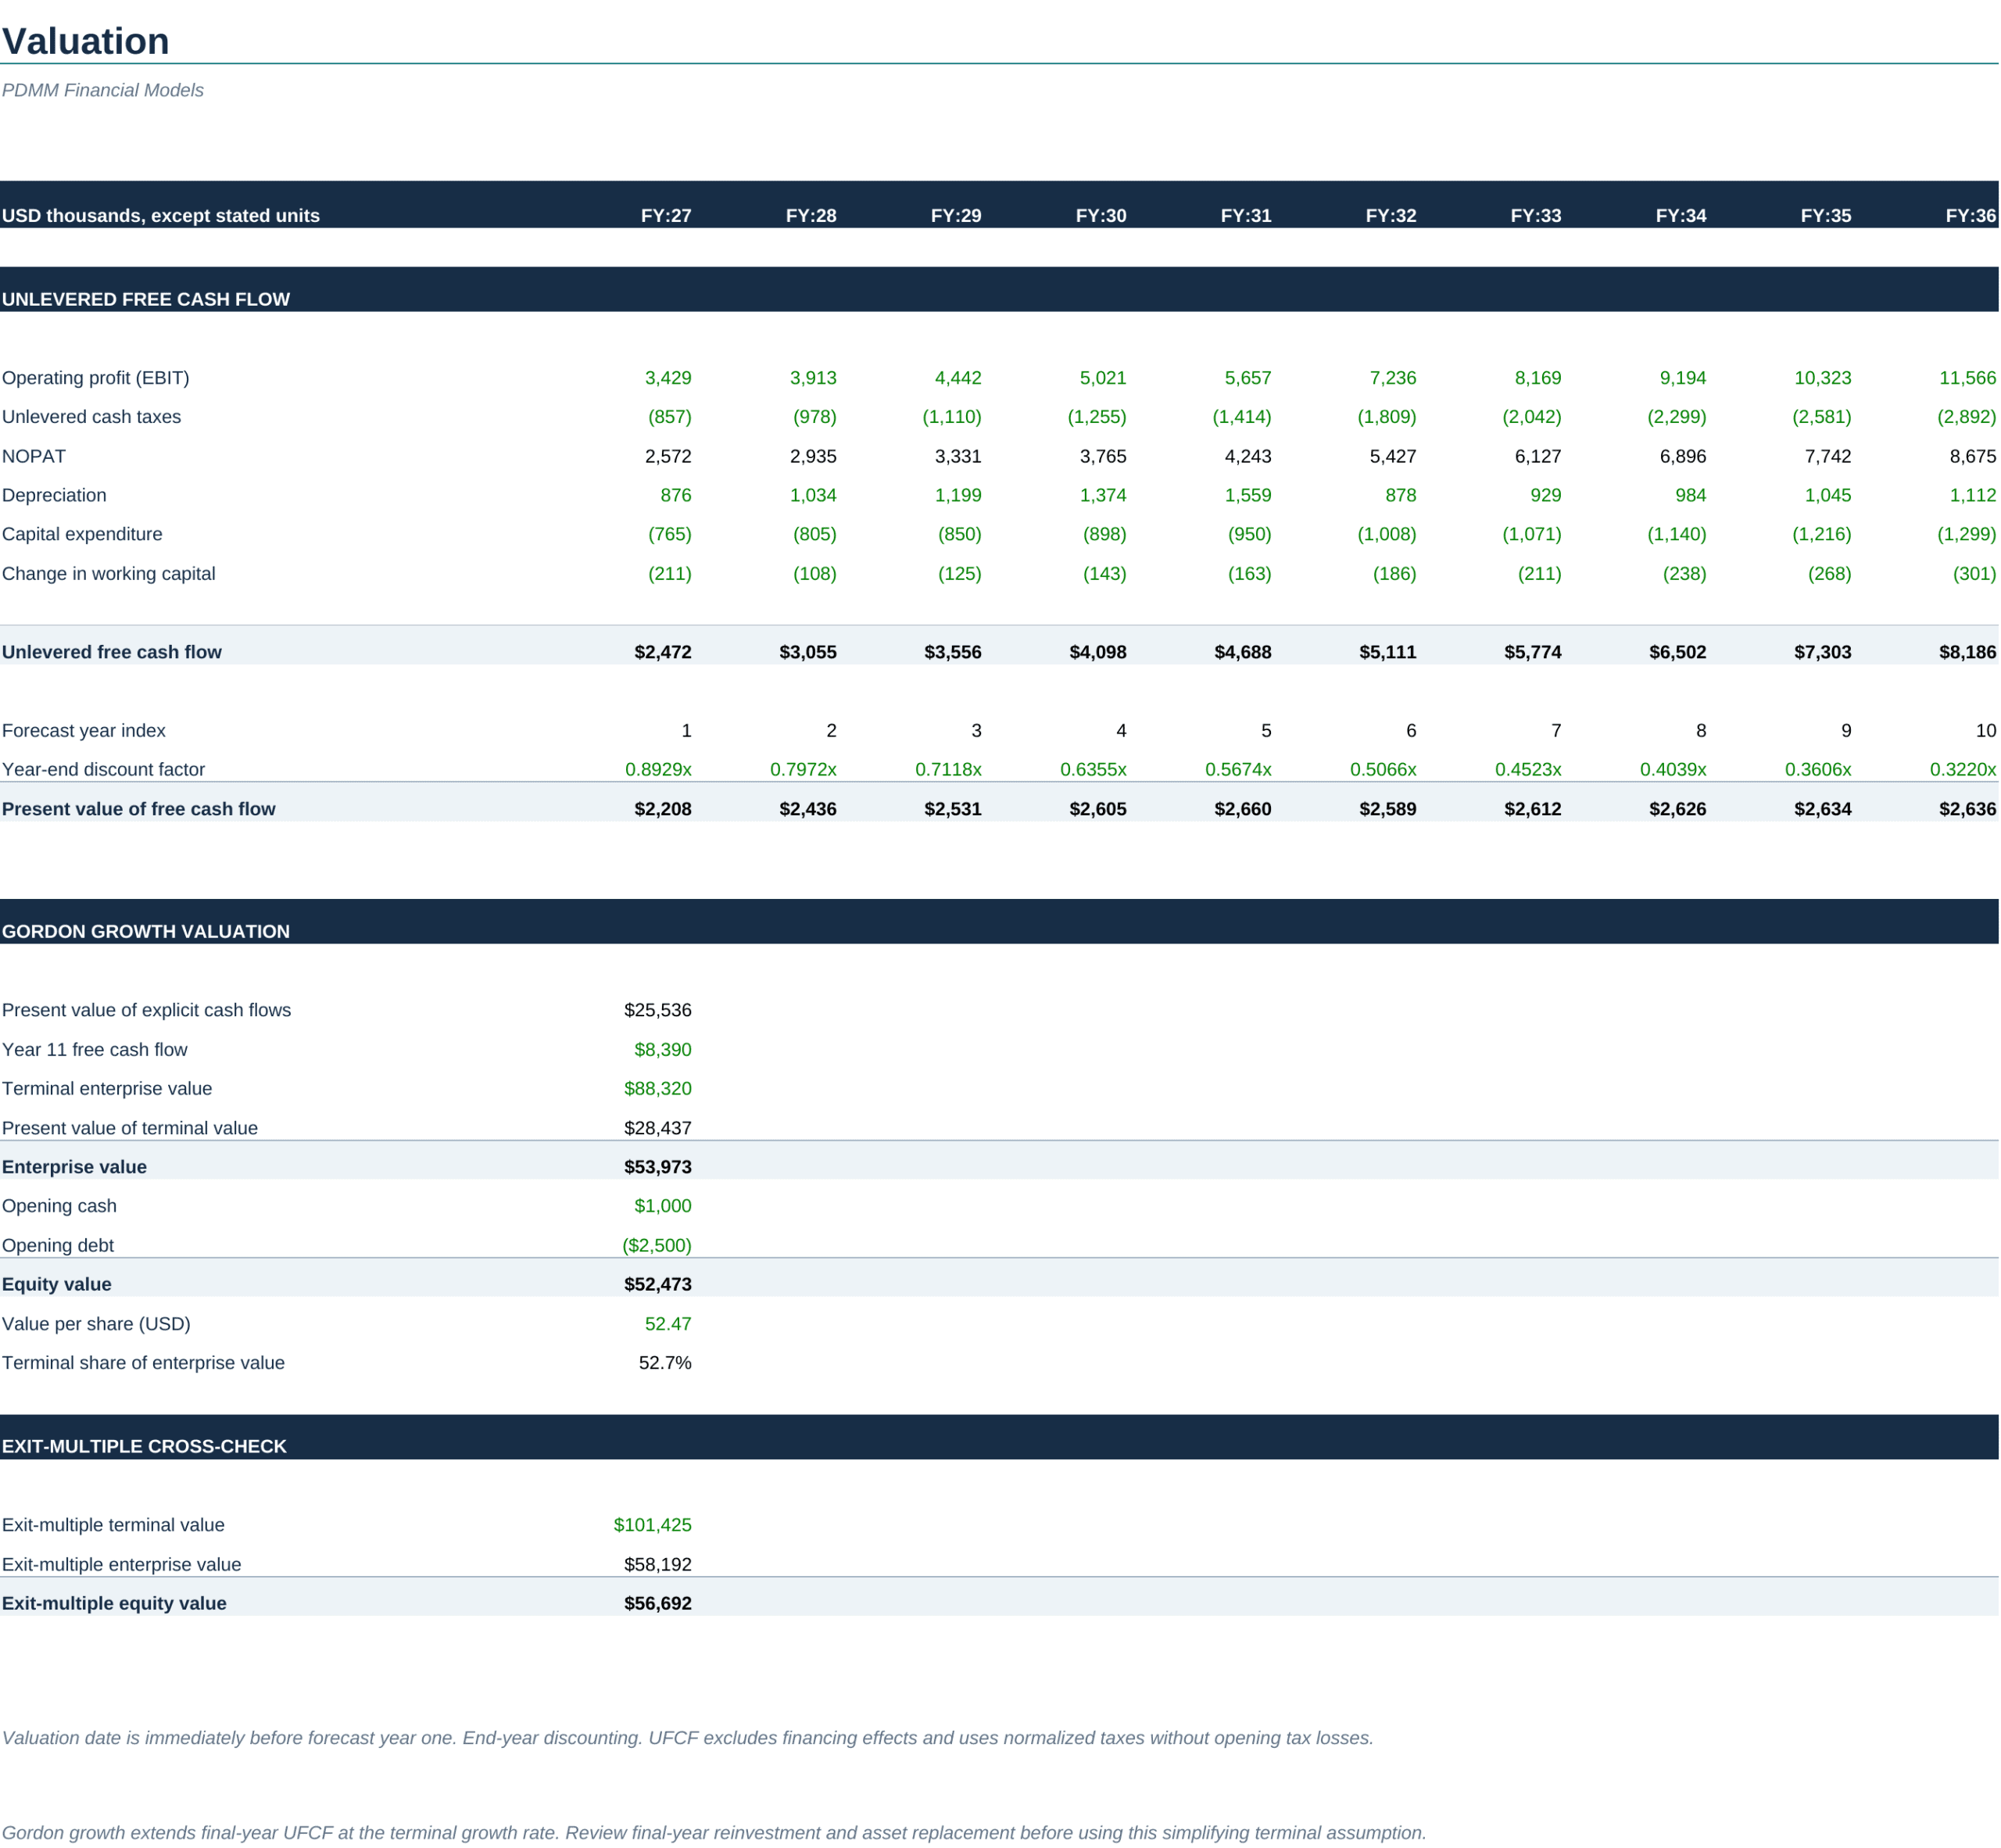
- Valuation: unlevered free cash flow, Gordon-growth DCF, equity value, value per share and exit-multiple cross-check.
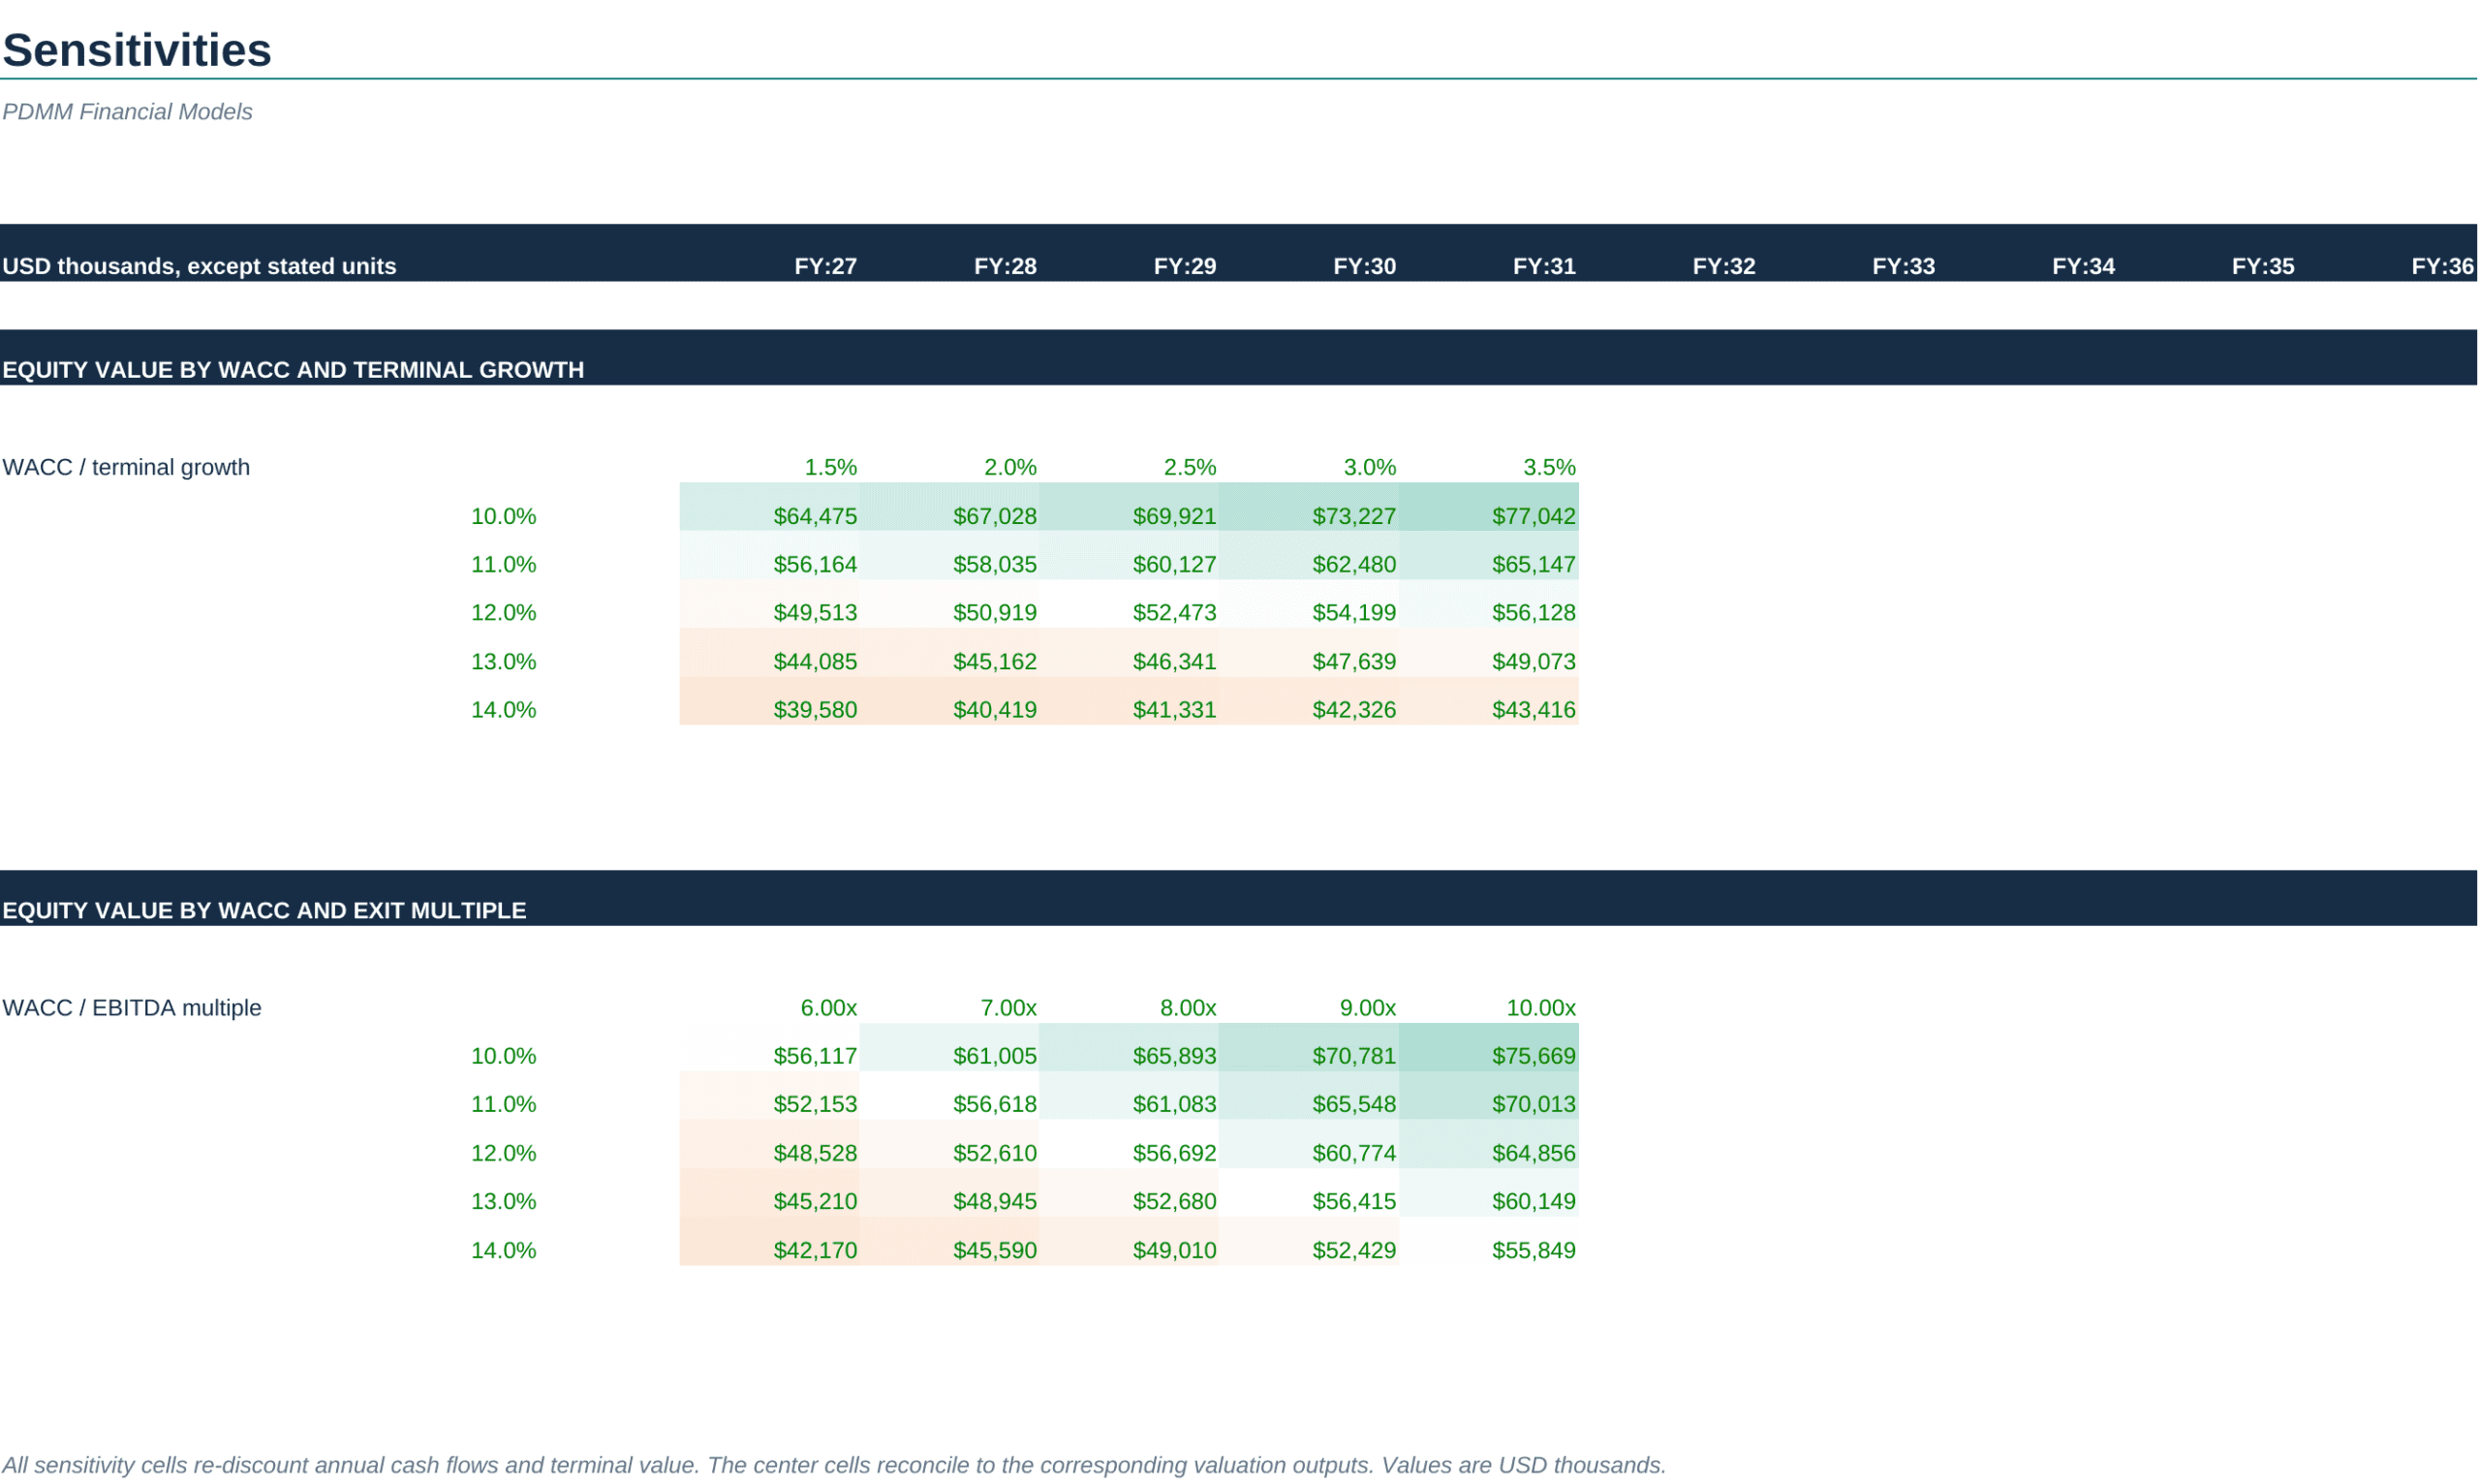
- Sensitivities: equity value by WACC/terminal growth and by WACC/exit EBITDA multiple.
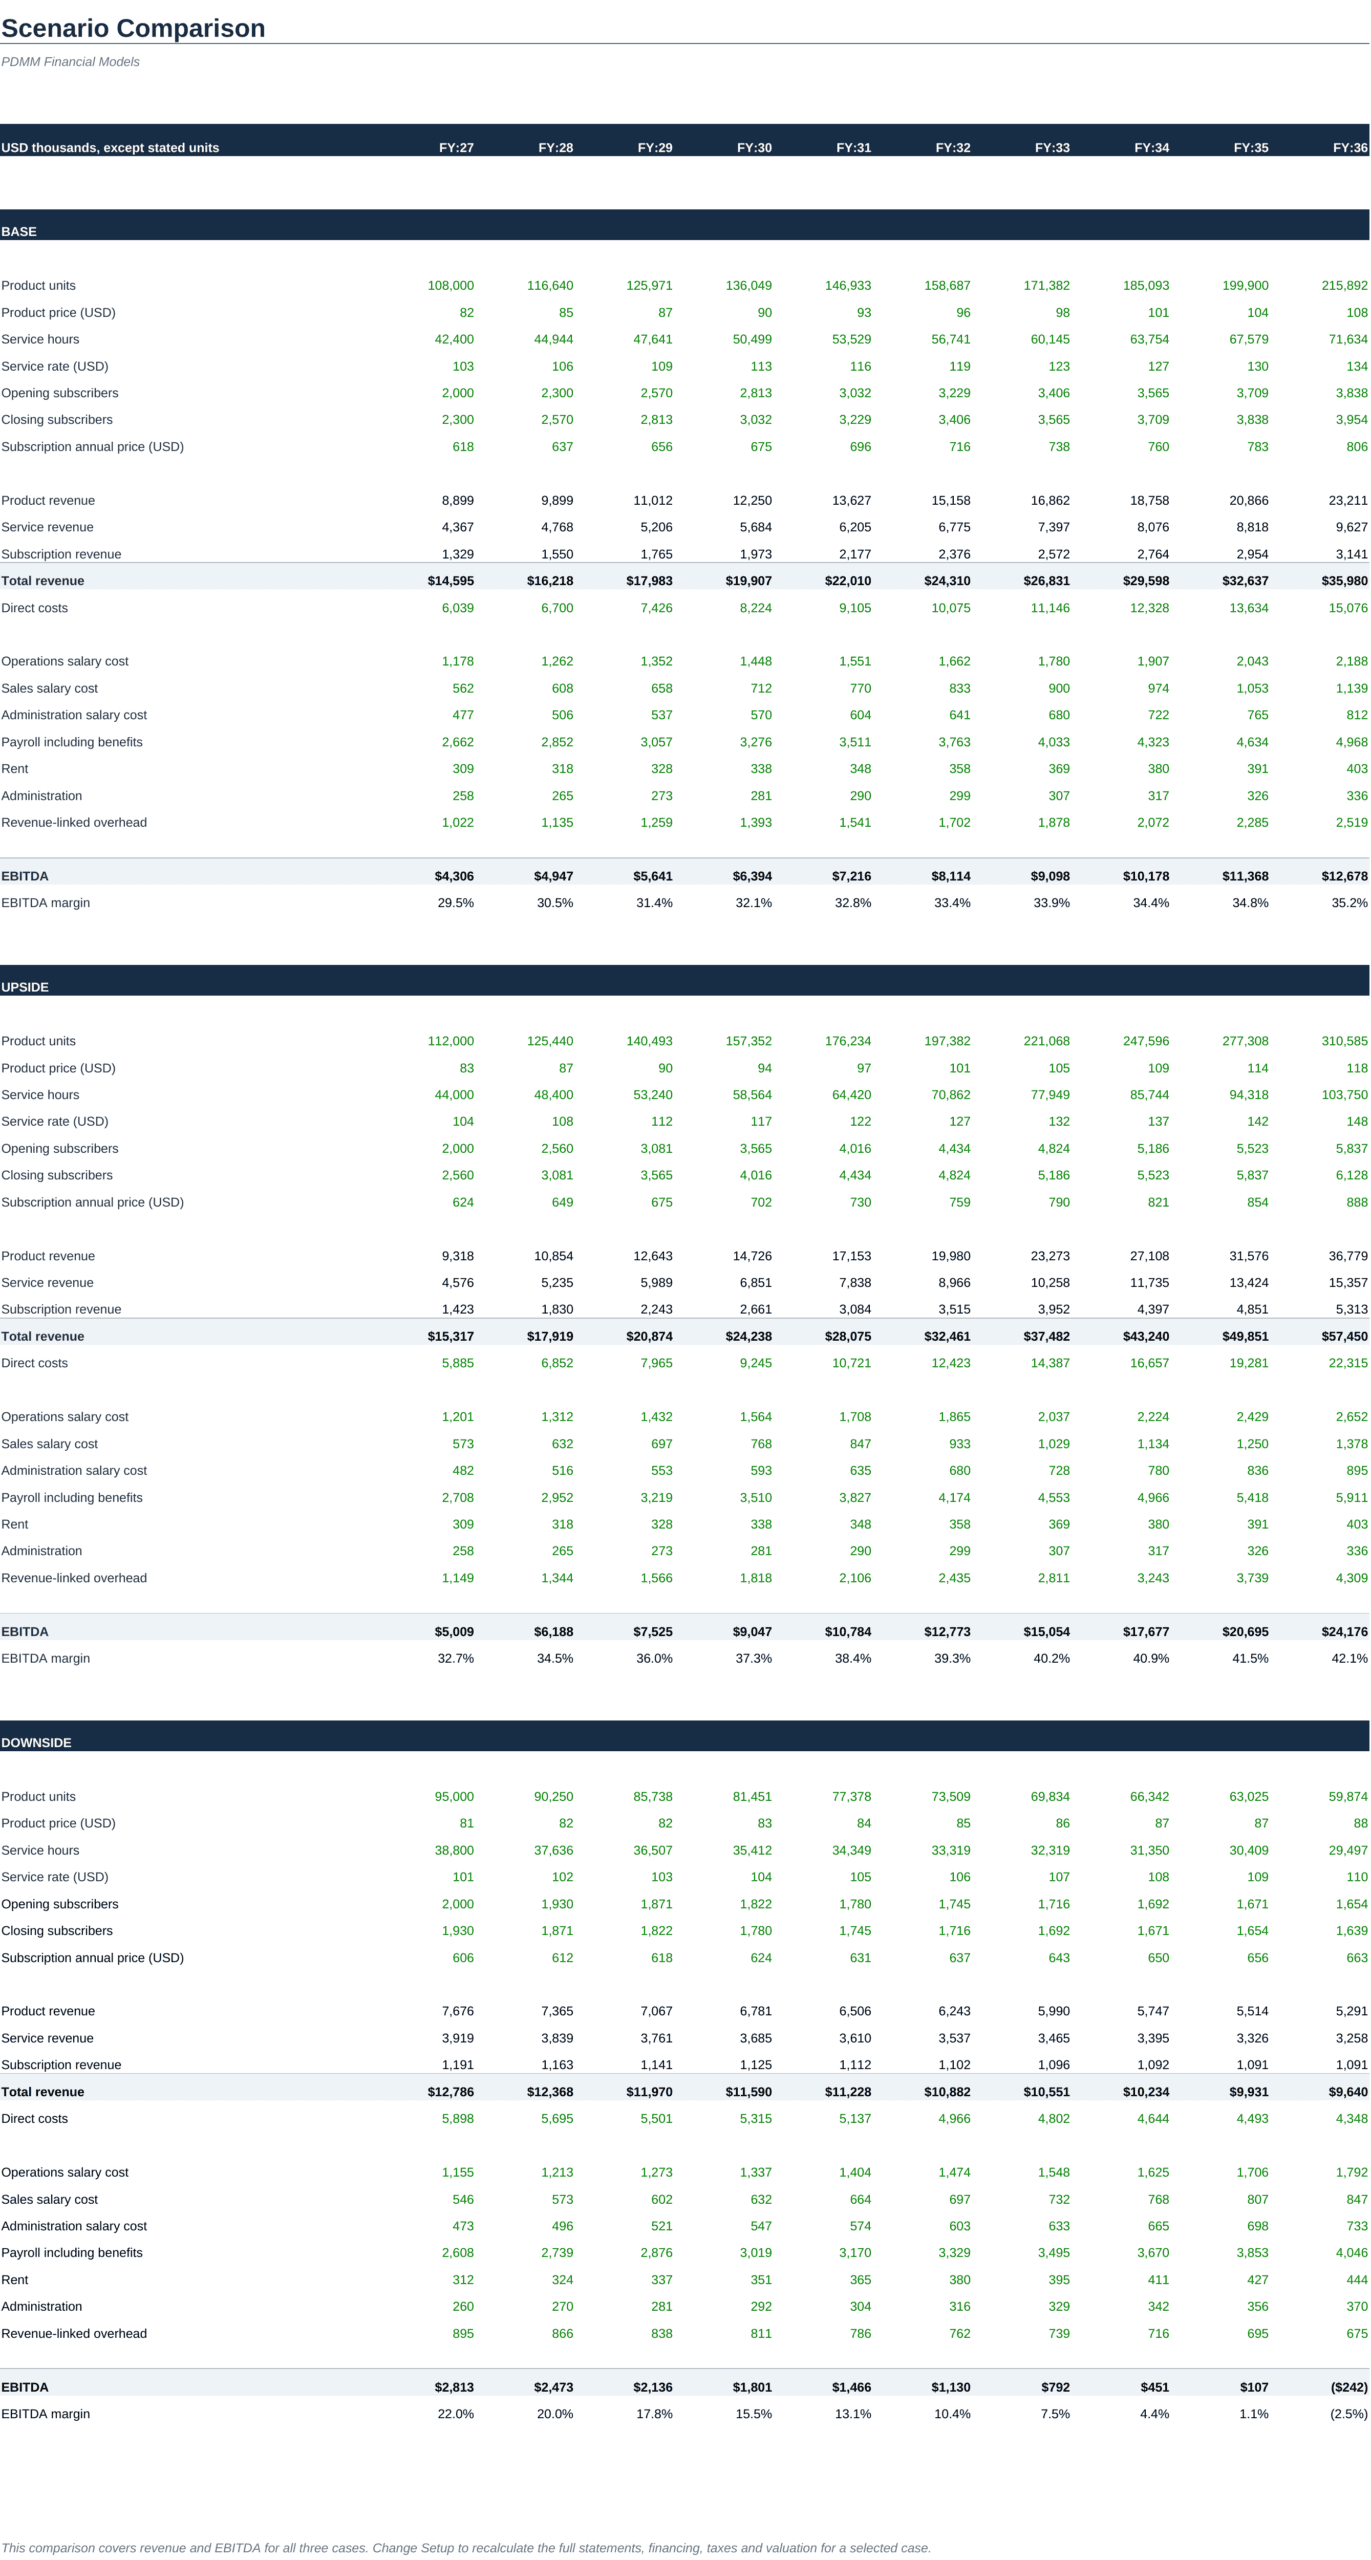
- Scenario Comparison: Base, Upside and Downside revenue and EBITDA operating forecasts shown side by side.
- Checks: reconciliations, funding/input exception flags and lender covenant indicators.
🔁 Scenarios, sensitivities and valuation
The three cases are stored independently in the Assumptions sheet. The Scenario Comparison sheet shows operating revenue and EBITDA outcomes for all three cases, while the active scenario selected in Setup drives the linked statements, financing, tax, ratios and valuation. The valuation section calculates unlevered free cash flow, discounts the ten annual forecast periods, applies a Gordon-growth terminal value, bridges enterprise value to equity value using opening cash and debt, and calculates value per share. An exit-EBITDA-multiple approach provides a second terminal-value cross-check. Two sensitivity grids show how equity value responds to changes in WACC, terminal growth and exit multiple.
📈 Executive KPIs and decision outputs
The Executive Summary consolidates revenue, EBITDA, EBITDA margin, net income, operating cash flow, free cash flow after interest, closing cash, closing debt, shareholders’ equity, model exceptions, covenant indicators, DCF equity value and value per share. The Ratios sheet adds revenue growth, gross margin, net margin, revenue per employee, cash conversion cycle, operating cash/EBITDA, current ratio, debt/EBITDA, interest coverage, DSCR, cash headroom, contribution margin, EBITDA break-even revenue and margin of safety.
💼 Recommended use cases
- Build a 10-year integrated business plan and three-statement forecast.
- Forecast product, service and subscription revenue in one operating model.
- Test pricing, volume, churn, staffing and cost assumptions against profitability.
- Plan cash flow, minimum liquidity and revolving-credit requirements.
- Analyze working-capital needs and the cash impact of receivables, inventory and payables.
- Forecast capex, depreciation and the PP&E balance over multiple asset vintages.
- Evaluate term-debt amortization, cash sweeps, interest expense, dividends and leverage.
- Compare Base, Upside and Downside operating cases before selecting the full reporting scenario.
- Measure margins, break-even revenue, cash headroom and covenant indicators.
- Estimate enterprise and equity value through a 10-year DCF.
- Test valuation sensitivity to WACC, terminal growth and exit EBITDA multiples.
- Support budgeting, management reporting, financing discussions and strategic planning with linked outputs.
👥 Intended users
This model is suited to founders, business owners, finance managers, FP&A professionals, consultants, advisors, lenders and transaction teams that need a reusable integrated forecast for a business with product, service, subscription or blended revenue streams. It is especially useful when the decision requires both operating-driver detail and a complete financial-statement/valuation view rather than a simple P&L forecast.
📦 Delivered files
The package includes the editable `.xlsx` workbook, a 19-page full-sheet PDF preview with one page per worksheet. Financial statements are presented in USD thousands unless a line states another unit; product prices, service rates and salaries are shown in USD, and shares are in thousands.
Seller-supplied and already tested; no Studio workbook audit was performed.
Similar ProductsOther customers were also interested in...



 eFinancialModels
Electric Vehicle (EV) Charging Station Financial M...
With this comprehensive 5- or 10-year monthly tool, investors can assess the viability of setting up... Read more

Financial Model for Mobile App | Mobile App Busine...
The Mobile App Financial Plan Template in Excel allows you to develop financial projections when lau... Read more

 HenrySheykin
Food Truck Financial Model Excel Template
The Food Truck Financial Model helps entrepreneurs, founders, business owners, consultants, and anal... Read more

Green Hydrogen Production from Wind Energy Financi...
The Green Hydrogen from Wind Financial Model aims to comprehensively forecast a horizon of 40 years ... Read more

Simple Mutual Non-Disclosure Agreement Template
Protect your business secrets with ease using our Simple Mutual Non-Disclosure Agreement Template. S... Read more

Solar Energy Financial Model
The Solar Energy Financial Model Spreadsheet Template in Excel assists you in preparing a sophistica... Read more

 Peter Graf
The Customer-Centric Financial Model for Restauran...
Starting a restaurant without a financial plan is like driving a car blindfolded. You wouldn´t do i... Read more
You must log in to submit a review.