
0 ITEMS

Extended-Stay Hotel Development, Conversion, Length-of-Stay & Debt Financial Model – 10-Year Forecast
🏨 Extended-Stay Hotel Development, Conversion, Length-of-Stay & Debt Financial Model – 10-Year Forecast This premium Excel model is built for extended-stay hotel developers, owners, franchisees, investors, lenders, operators and advisors who need to connect property-level operating assumptions with development cost, financing, cash flow, valuation and investor returns. Instead of treating a hotel as a simple rooms × ADR forecast, the workbook models the operating drivers that are especially important in extended-stay hospitality: length-of-stay mix, contracted demand, weekly housekeeping, lean staffing, brand economics, opening ramp-up and debt capacity.

🏨 Extended-Stay Hotel Development, Conversion, Length-of-Stay & Debt Financial Model – 10-Year Forecast
This premium Excel model is built for extended-stay hotel developers, owners, franchisees, investors, lenders, operators and advisors who need to connect property-level operating assumptions with development cost, financing, cash flow, valuation and investor returns. Instead of treating a hotel as a simple rooms × ADR forecast, the workbook models the operating drivers that are especially important in extended-stay hospitality: length-of-stay mix, contracted demand, weekly housekeeping, lean staffing, brand economics, opening ramp-up and debt capacity.
The model covers 120 monthly periods from January 2026 through December 2035, with annual financial statements and management outputs across the 10-year horizon. It is fully editable and populated with coherent sample assumptions so buyers can immediately understand how the model works, then replace the sample inputs with their own property, market, financing and operating case.
🧭 What decisions can this model support?
- Evaluate a new-build, existing hotel conversion, or acquisition + conversion strategy.
- Test whether the proposed ADR and occupancy profile can support the hotel’s operating cost structure.
- Quantify the value of longer stays through lower checkout frequency and weekly housekeeping economics.
- Determine how much recurring contracted room-night demand is needed relative to transient demand.
- Compare branded vs independent positioning, including franchise fee burden and required revenue uplift.
- Size development equity and debt through a detailed Sources & Uses schedule.
- Review monthly debt draws, interest-only periods, amortization and optional refinancing choices.
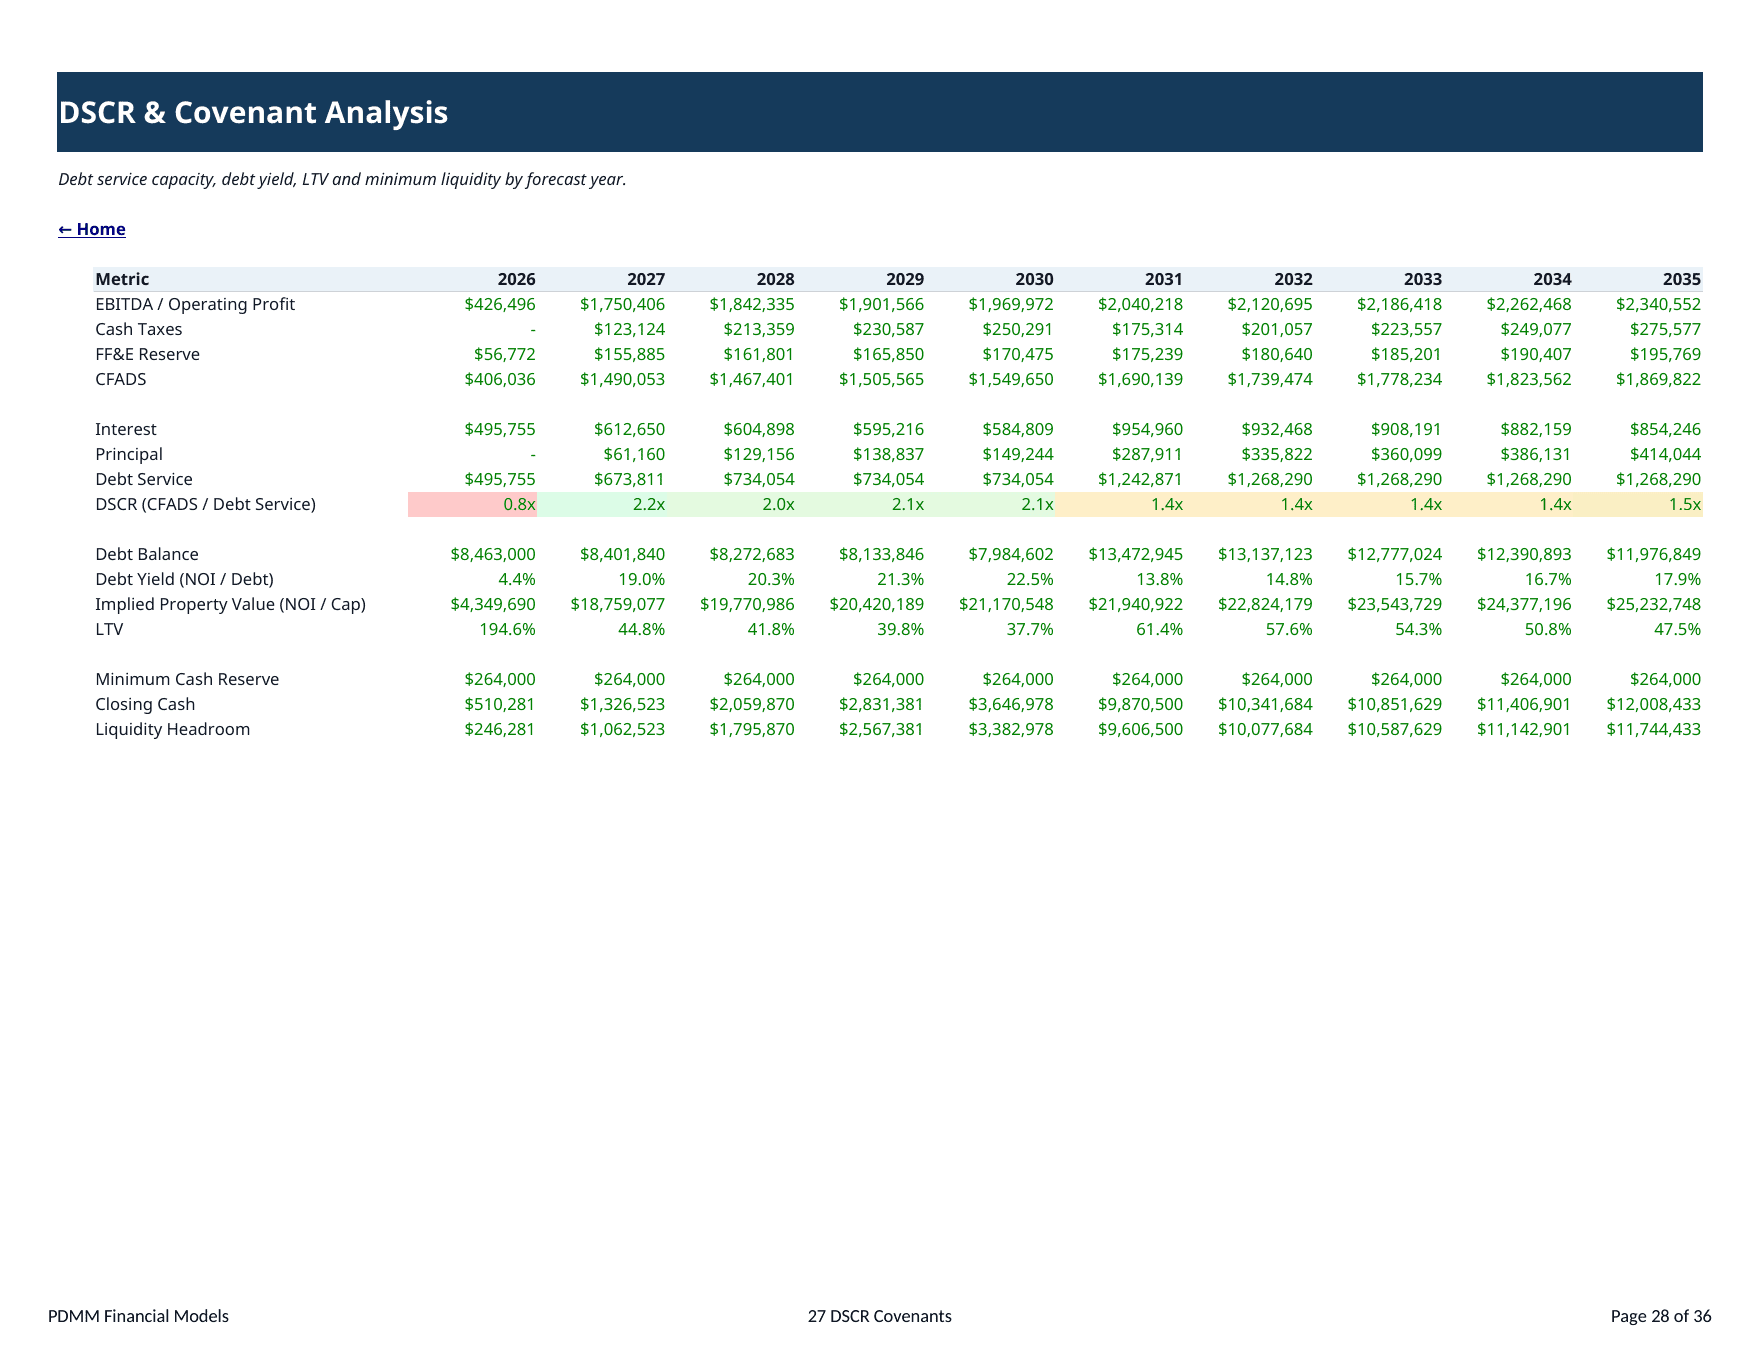
- Test whether cash flow supports lender-focused metrics such as DSCR, debt yield and LTV.
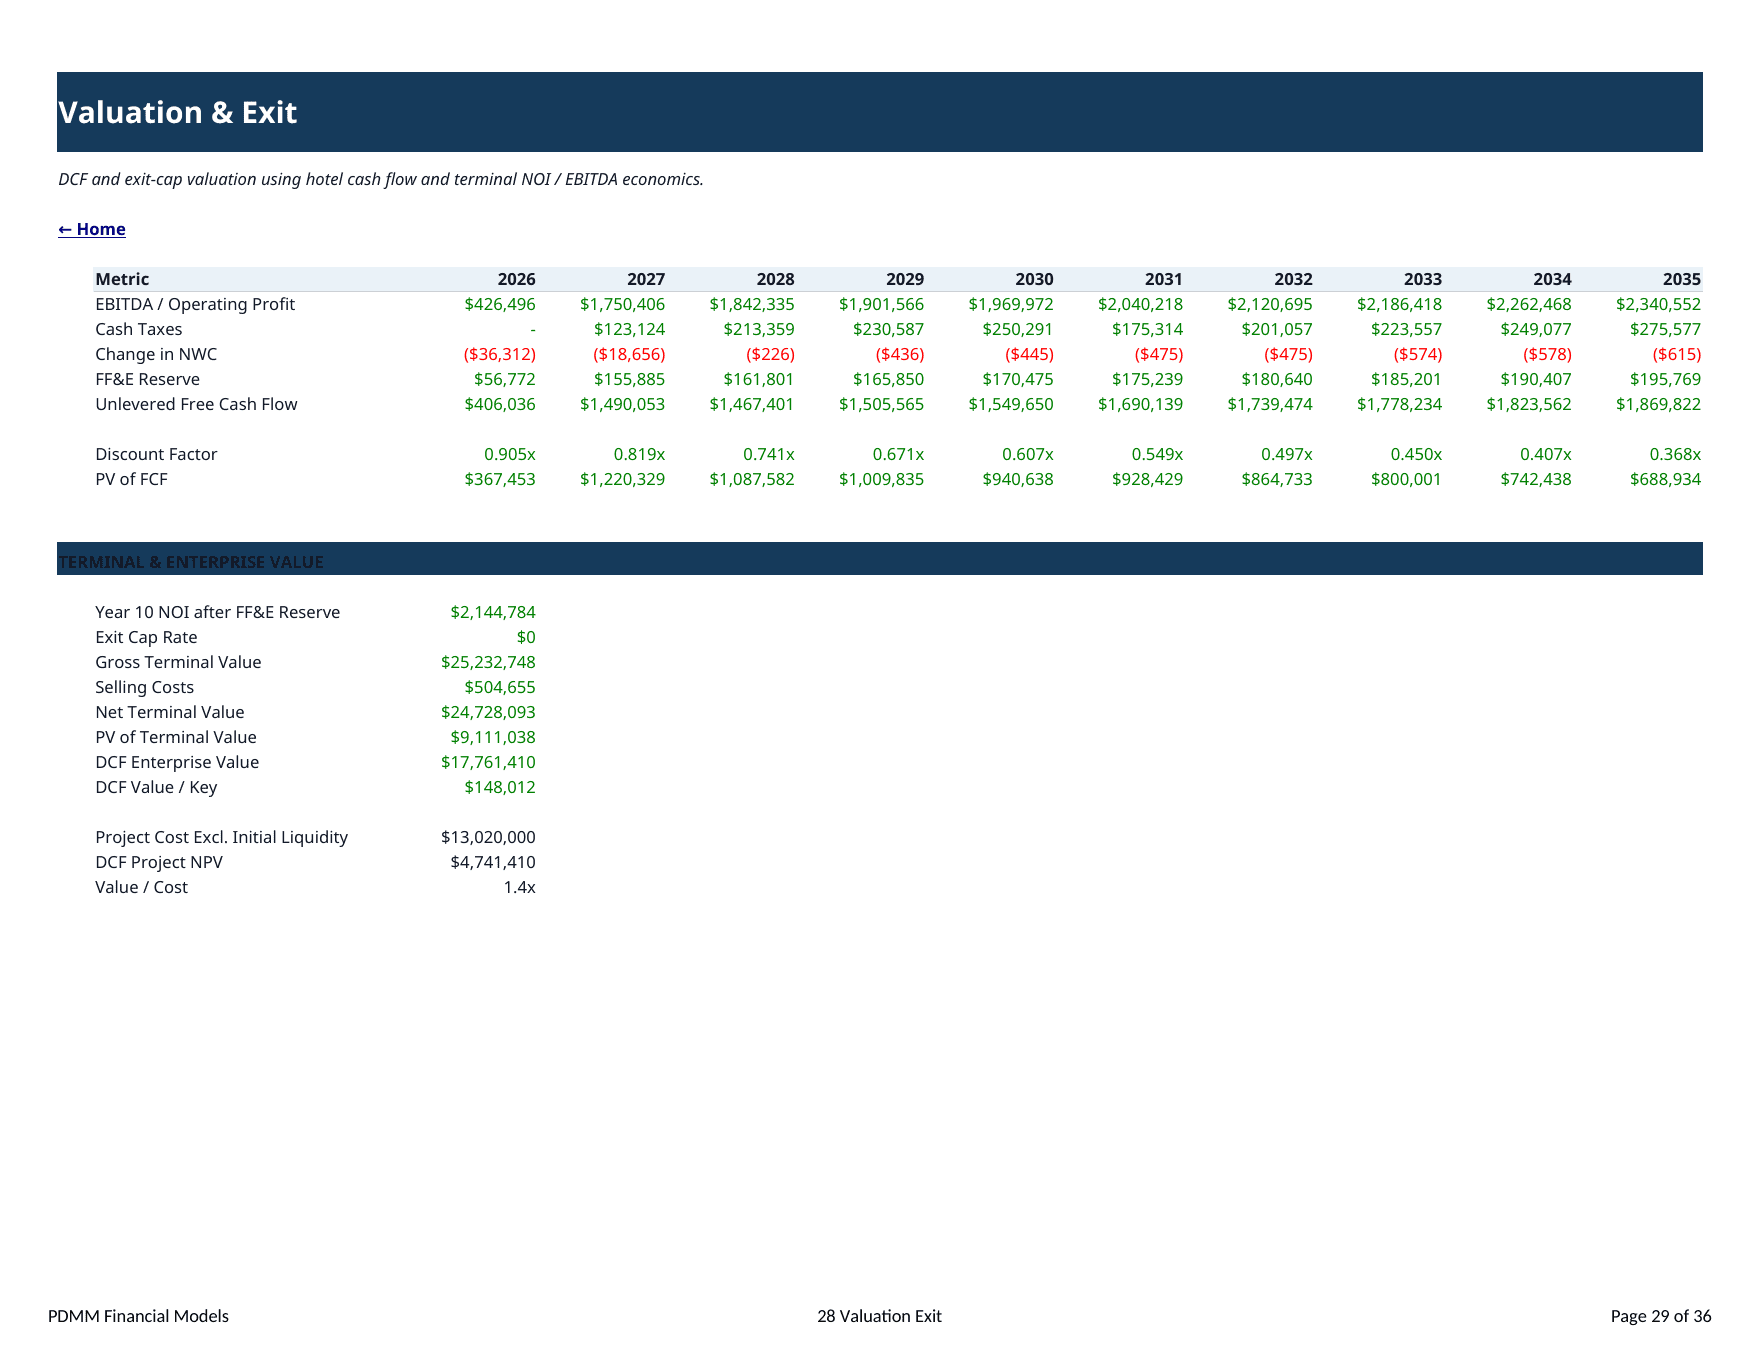
- Estimate enterprise value through DCF and exit-cap valuation and assess investor return metrics.
- Compare Downside, Base and Upside operating cases and inspect two-way sensitivities before committing capital.
📊 Extended-stay operating engine
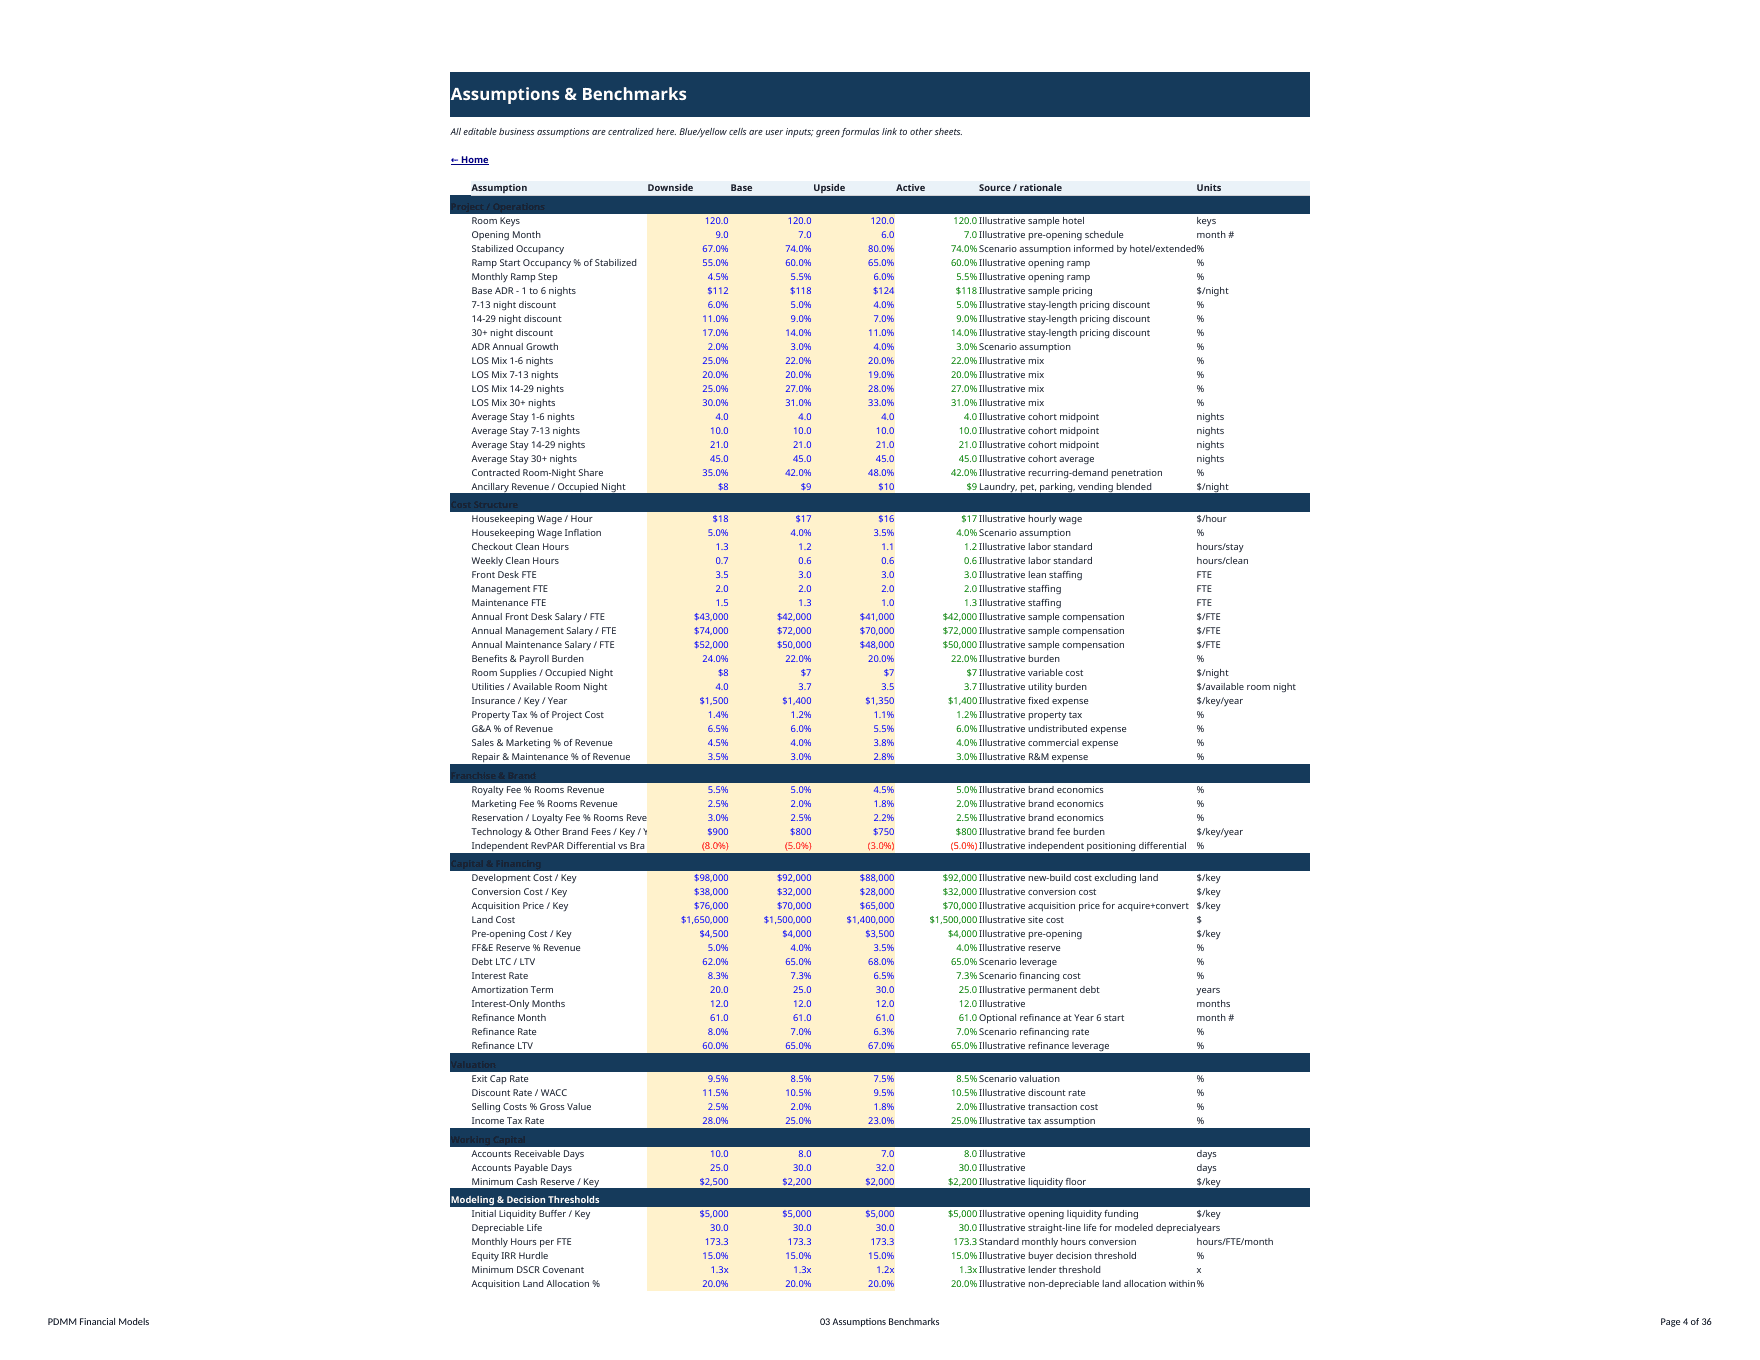
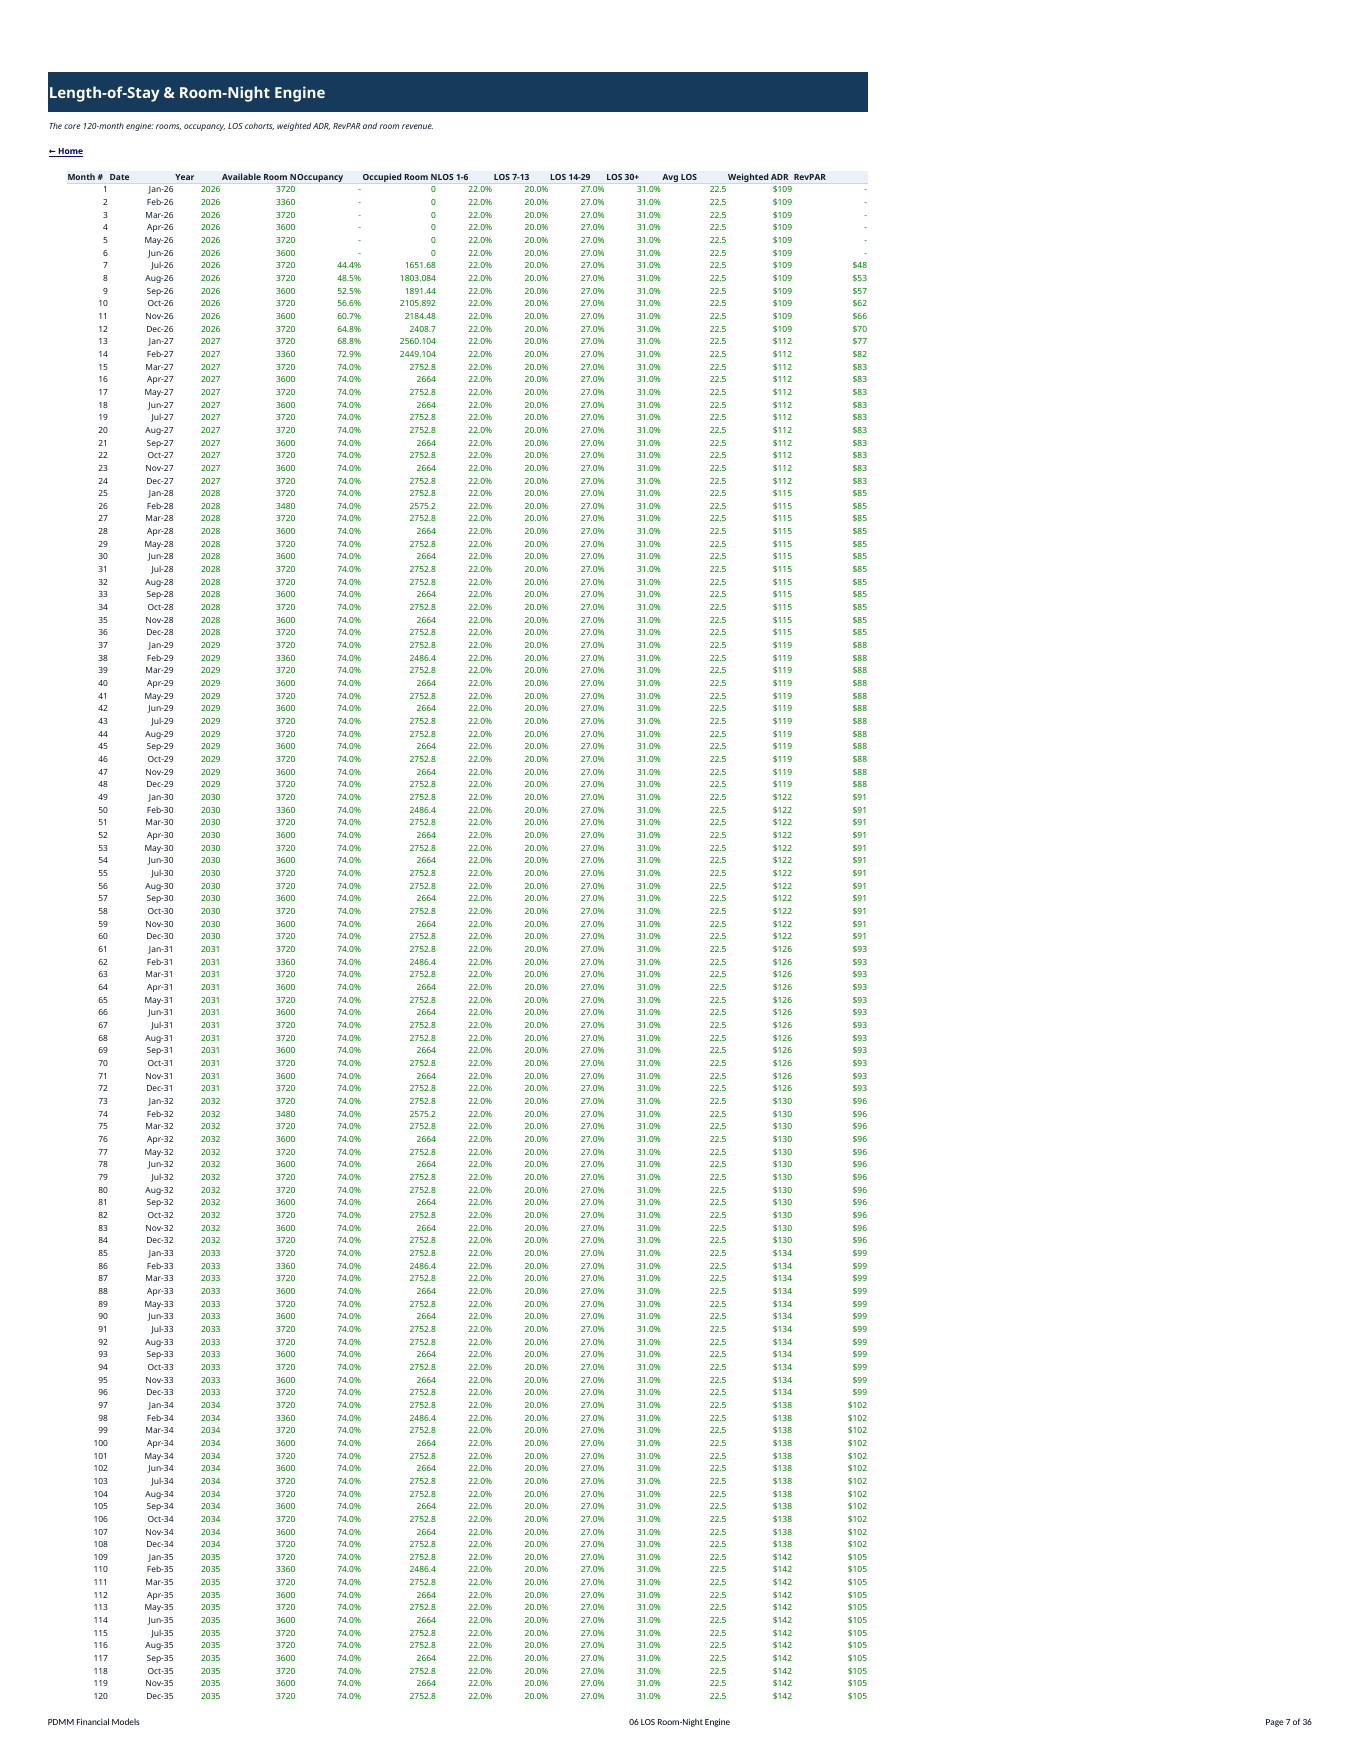
The workbook models four separate stay-length cohorts: 1-6 nights, 7-13 nights, 14-29 nights and 30+ nights. Users can edit the mix of occupied nights, base ADR, cohort discounts, annual ADR growth and average length of stay. Those assumptions flow into monthly occupied room nights, weighted ADR and RevPAR.
The opening schedule is formula-driven. Occupancy ramps from opening toward stabilized occupancy using explicit ramp assumptions rather than assuming a fully stabilized property from day one. Market Demand and Channel & Contract Mix schedules separately track contracted and transient room nights. The sample contracted-demand framework includes construction/project crews, healthcare assignments, relocation/insurance displacement, government/military, university/academic and corporate/other extended assignments.
🧹 Housekeeping, staffing and operating costs
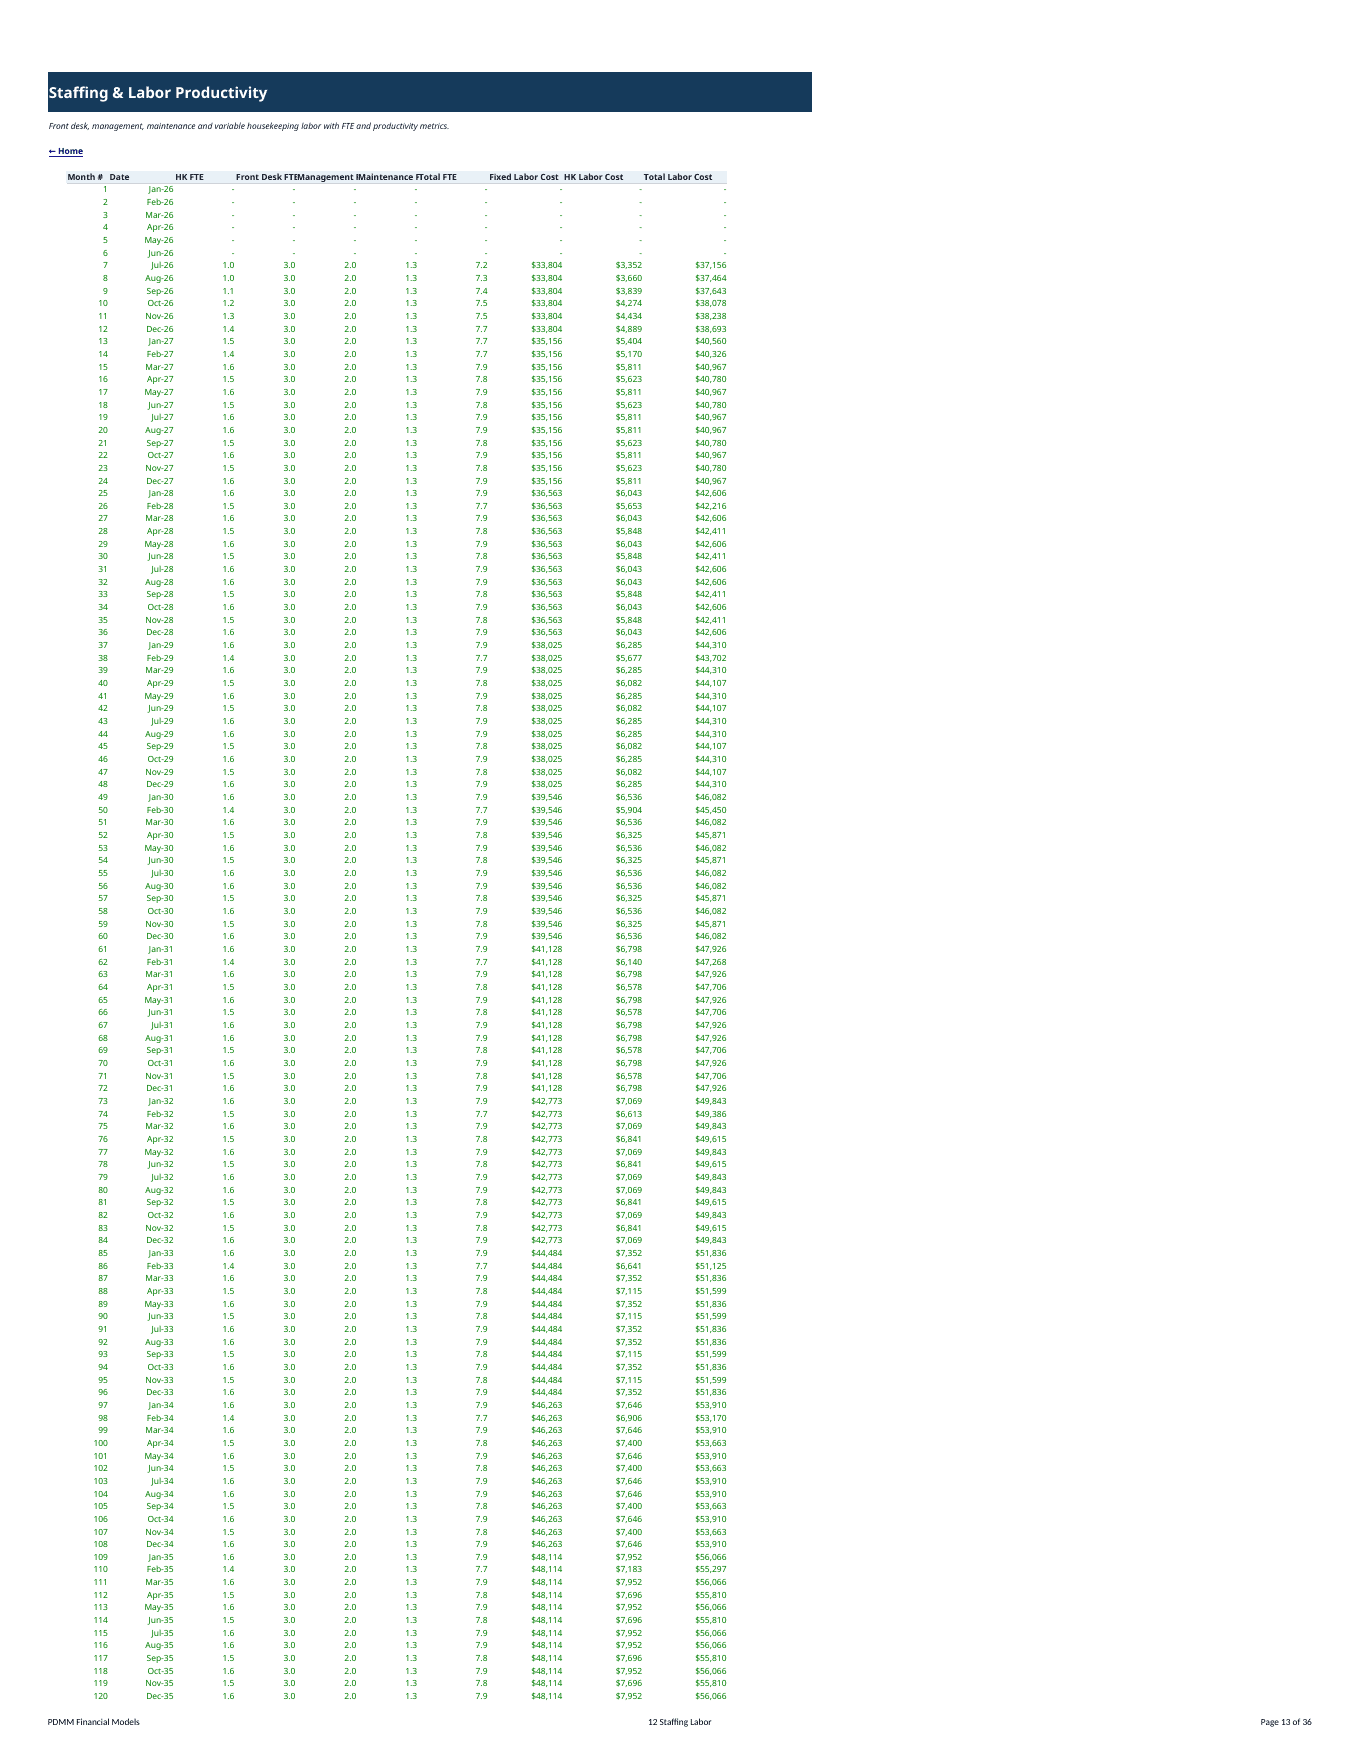
Longer stays change hotel labor economics, so the model does not rely only on a generic payroll percentage. The Housekeeping & Turnover schedule estimates stays/checkouts, weekly cleans, checkout-clean hours, weekly-clean hours, total housekeeping hours and housekeeping labor cost. The Staffing & Labor schedule then combines housekeeping FTE with front desk, management and maintenance staffing, salary escalation, benefits/payroll burden and total labor cost.
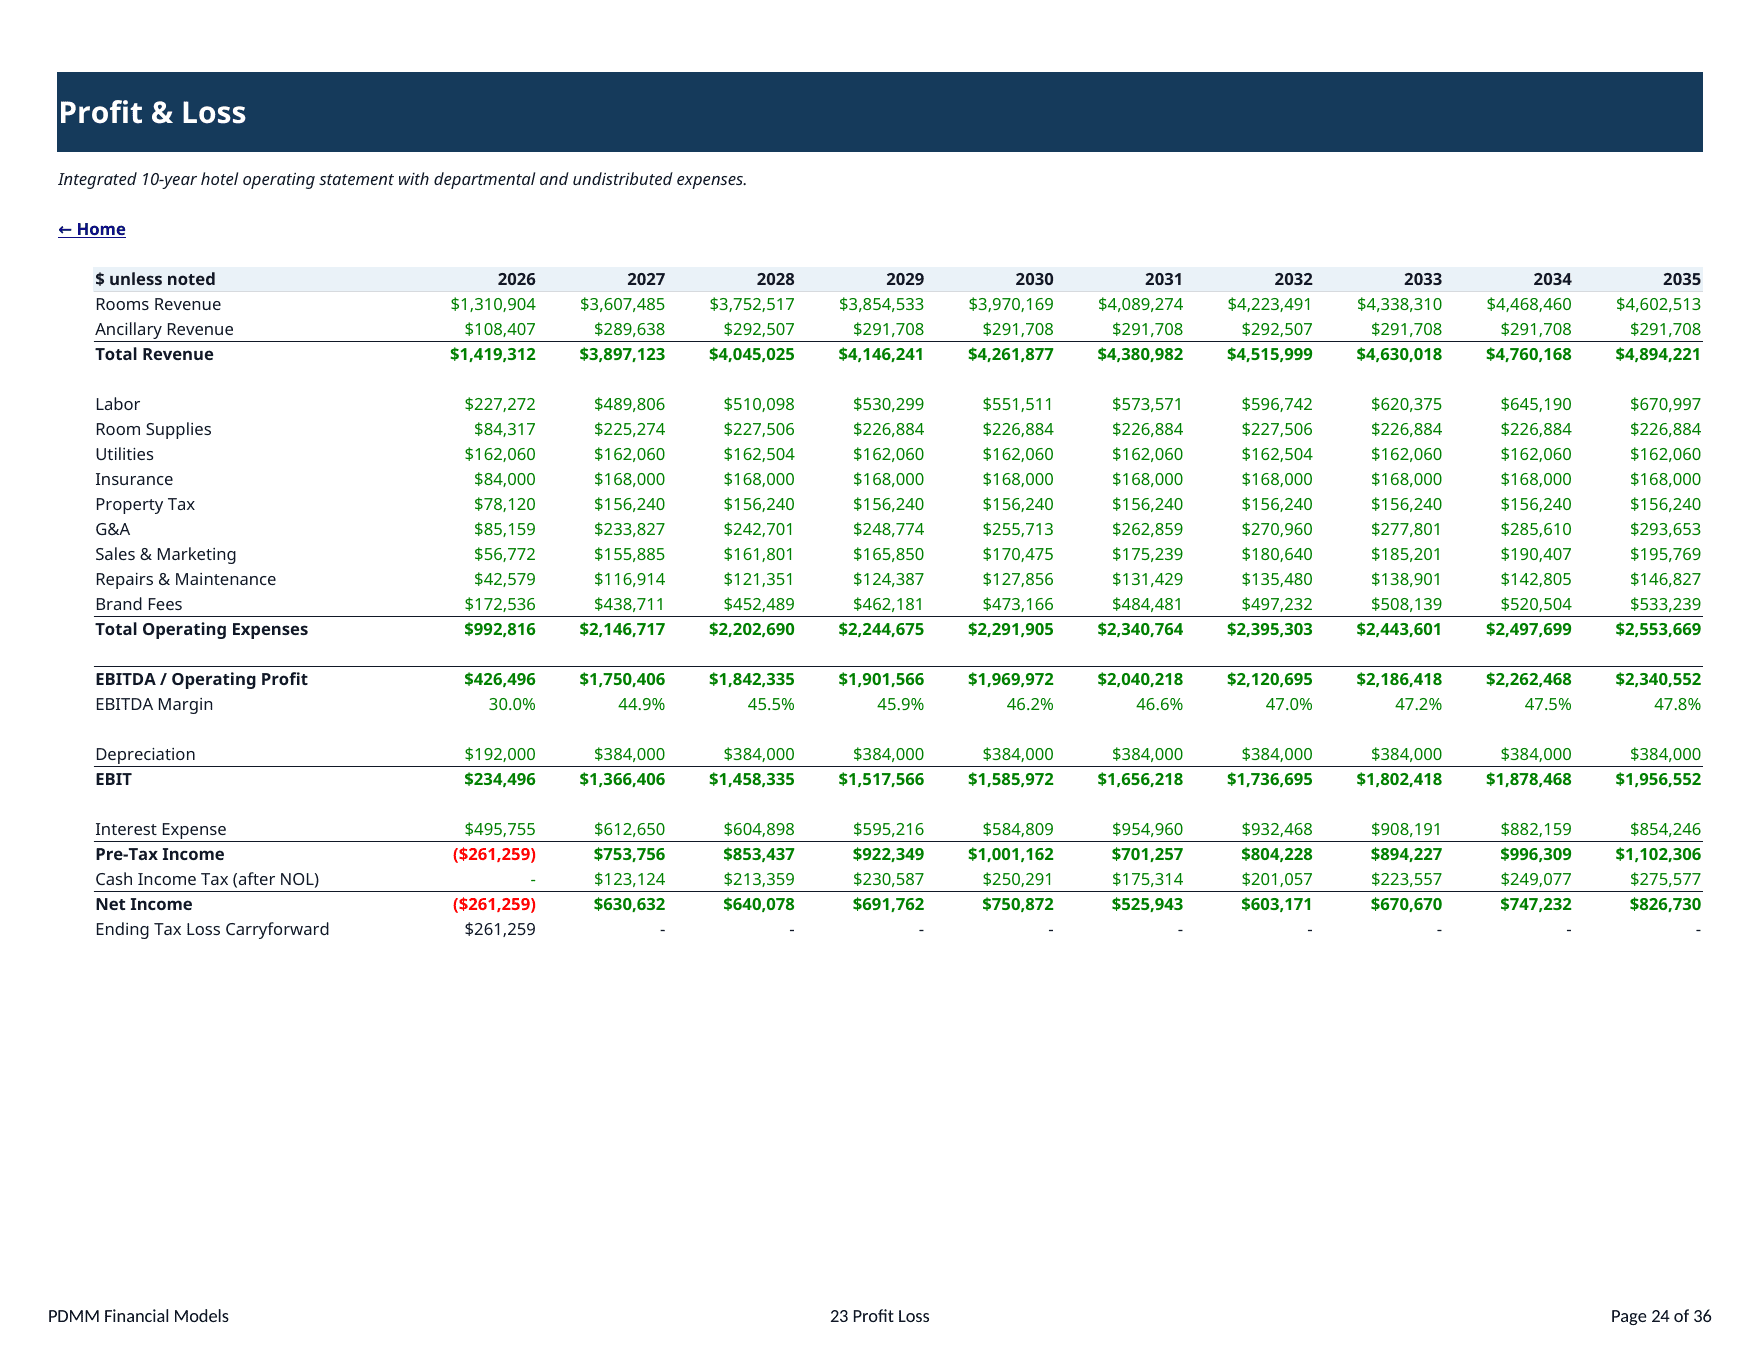
The Departmental Opex schedule includes labor, room supplies, utilities, insurance, property tax, G&A, sales & marketing and repairs & maintenance. These expenses feed directly into the 10-year Profit & Loss statement and hotel KPI analysis.
🏷️ Franchise and brand economics
The Franchise Economics sheet models royalty fees, marketing fees, reservation/loyalty fees and technology/other brand costs. The Brand Comparison sheet compares branded revenue and EBITDA against an independent case using the workbook’s independent RevPAR differential assumption. This allows the user to analyze whether the distribution and pricing benefit of a flag is sufficient to offset its recurring cost burden.
🏗️ Development, conversion and capital structure
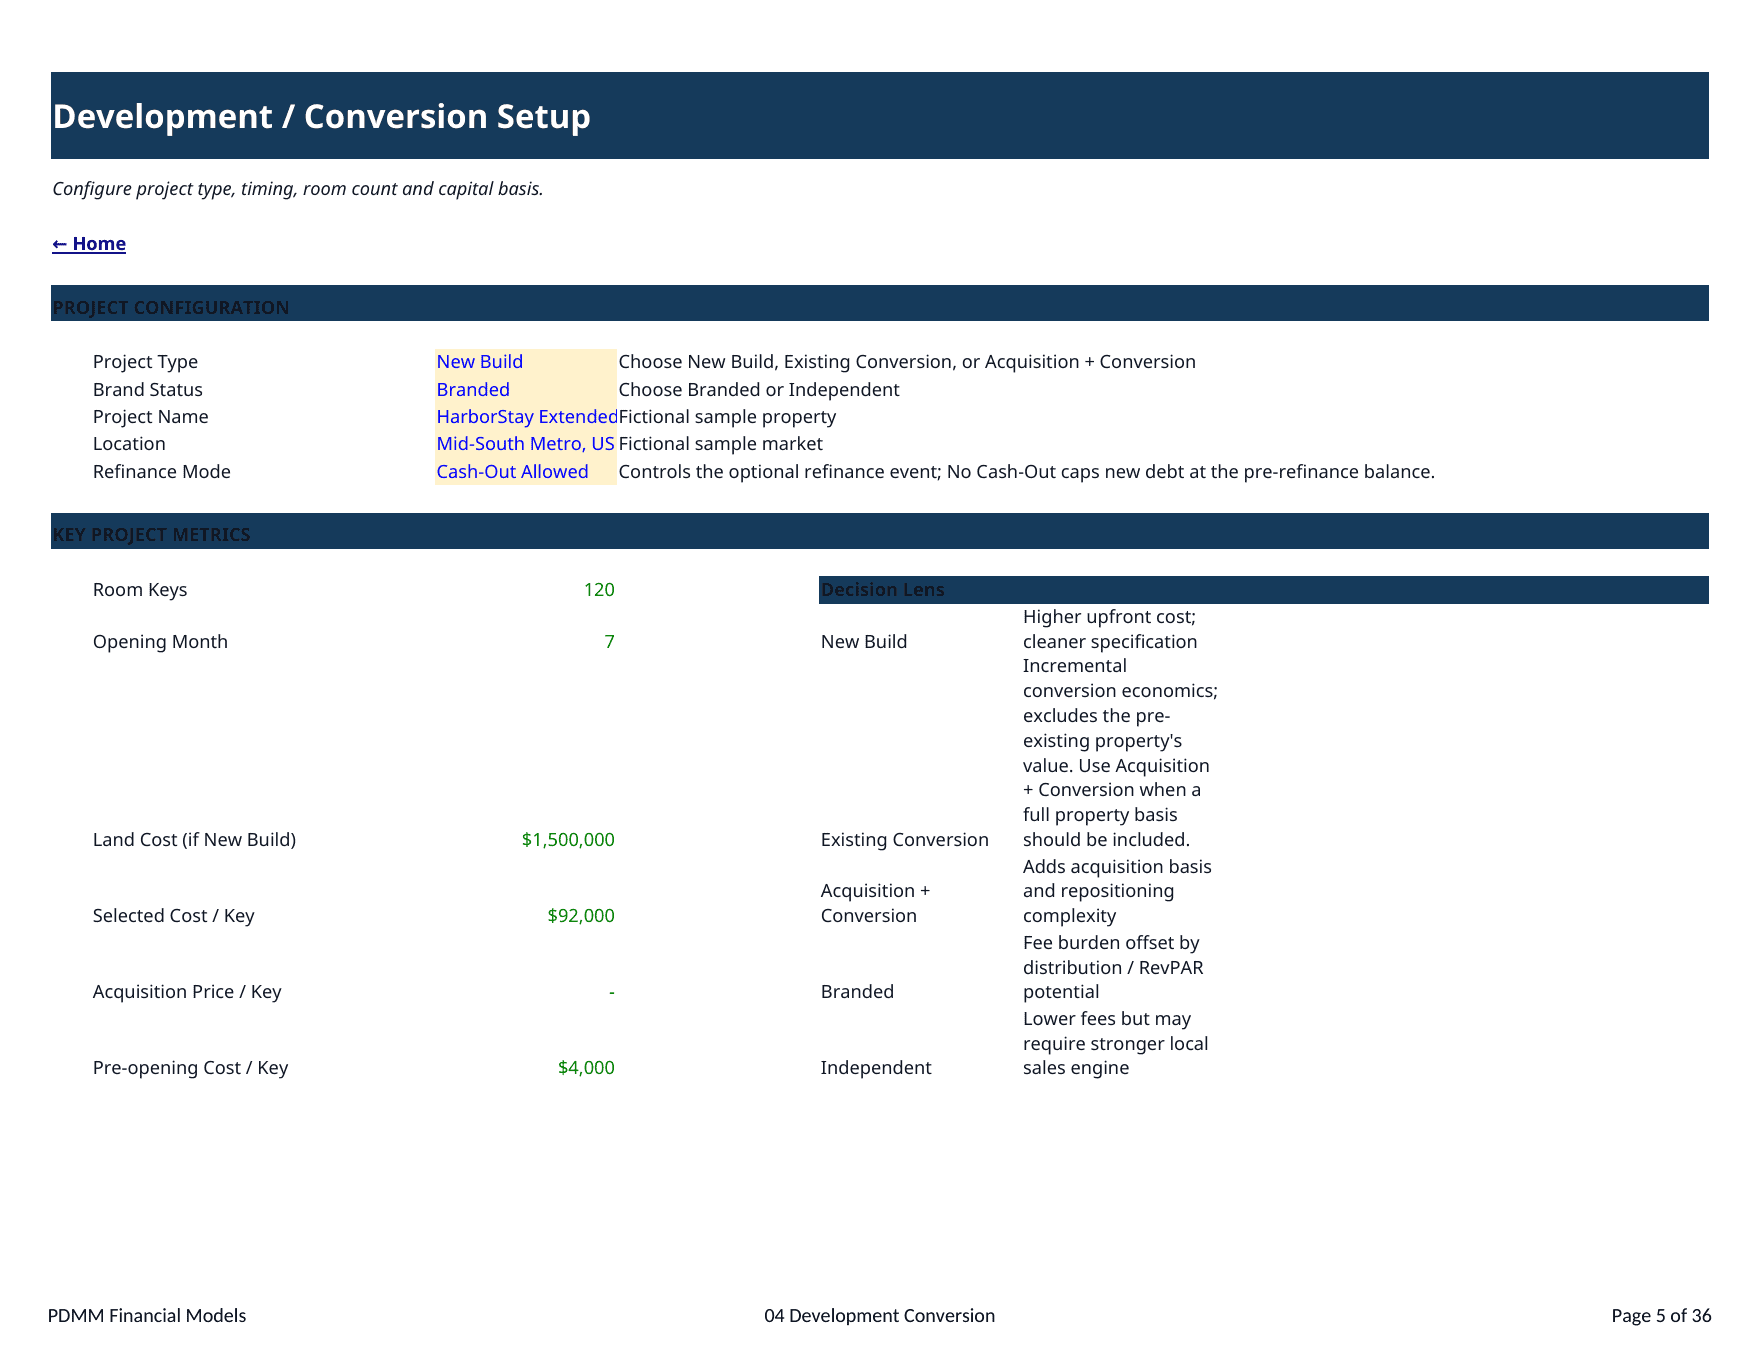
Project configuration is centralized in Development & Conversion, including project type, brand status, room keys, opening timing and the selected cost basis. Development CapEx spreads hard/conversion cost, land, acquisition cost and pre-opening spend across the construction or conversion period. Sources & Uses summarizes required capital and splits the funding requirement between debt and equity.
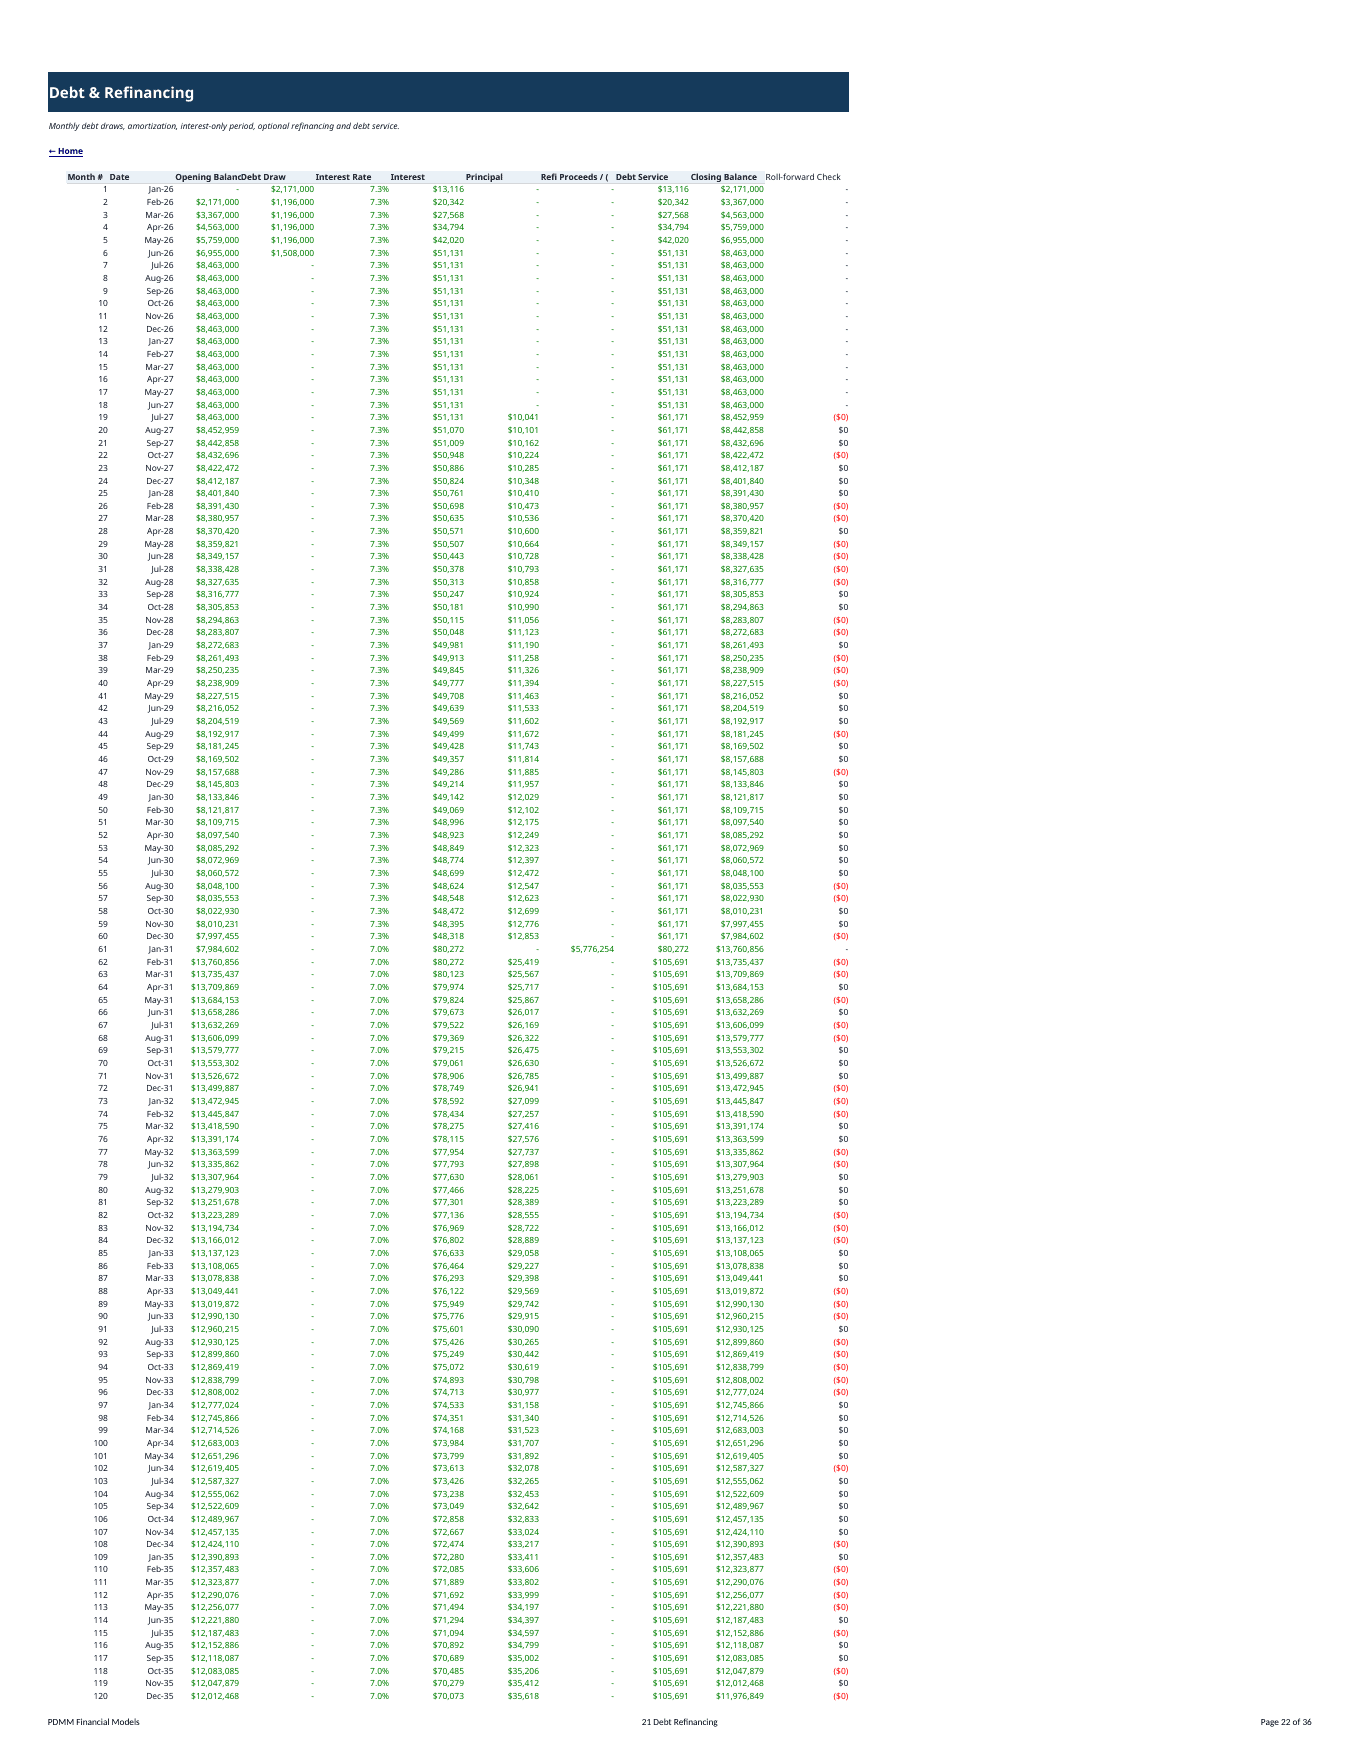
Supporting schedules cover Fixed Assets & Depreciation, Working Capital, Debt & Refinancing and FF&E Reserve. Debt is modeled monthly with pre-opening draws, an interest-only period, amortization and optional refinance settings. Refinance choices support None, No Cash-Out and Cash-Out Allowed cases. This lets users analyze not only operating feasibility but also how financing structure affects equity cash flow and lender coverage.
💵 Integrated financial statements and hotel KPIs
The model includes an integrated Profit & Loss, Balance Sheet and Cash Flow forecast. Hotel-specific KPI reporting includes occupancy, ADR, RevPAR, average length of stay, contracted room-night share, EBITDA/GOP margin, GOPPAR, labor cost per occupied room night, revenue per FTE, rooms per FTE, housekeeping hours per occupied night and brand fees as a percentage of rooms revenue.
The DSCR & Covenants schedule calculates CFADS, interest, principal, debt service, DSCR, debt balance, debt yield, implied property value, LTV, minimum cash reserve, closing cash and liquidity headroom. These outputs are useful for reviewing capital structure and debt-service capacity alongside the operating forecast.
📈 Valuation, investor returns, scenarios and sensitivities
The Valuation & Exit schedule builds unlevered free cash flow, discount factors, terminal NOI after FF&E reserve, exit-cap value, selling costs, present value and DCF enterprise value. The Investor Returns schedule shows equity cash flows and calculates levered IRR, MOIC/equity multiple, terminal equity proceeds and payback behavior.
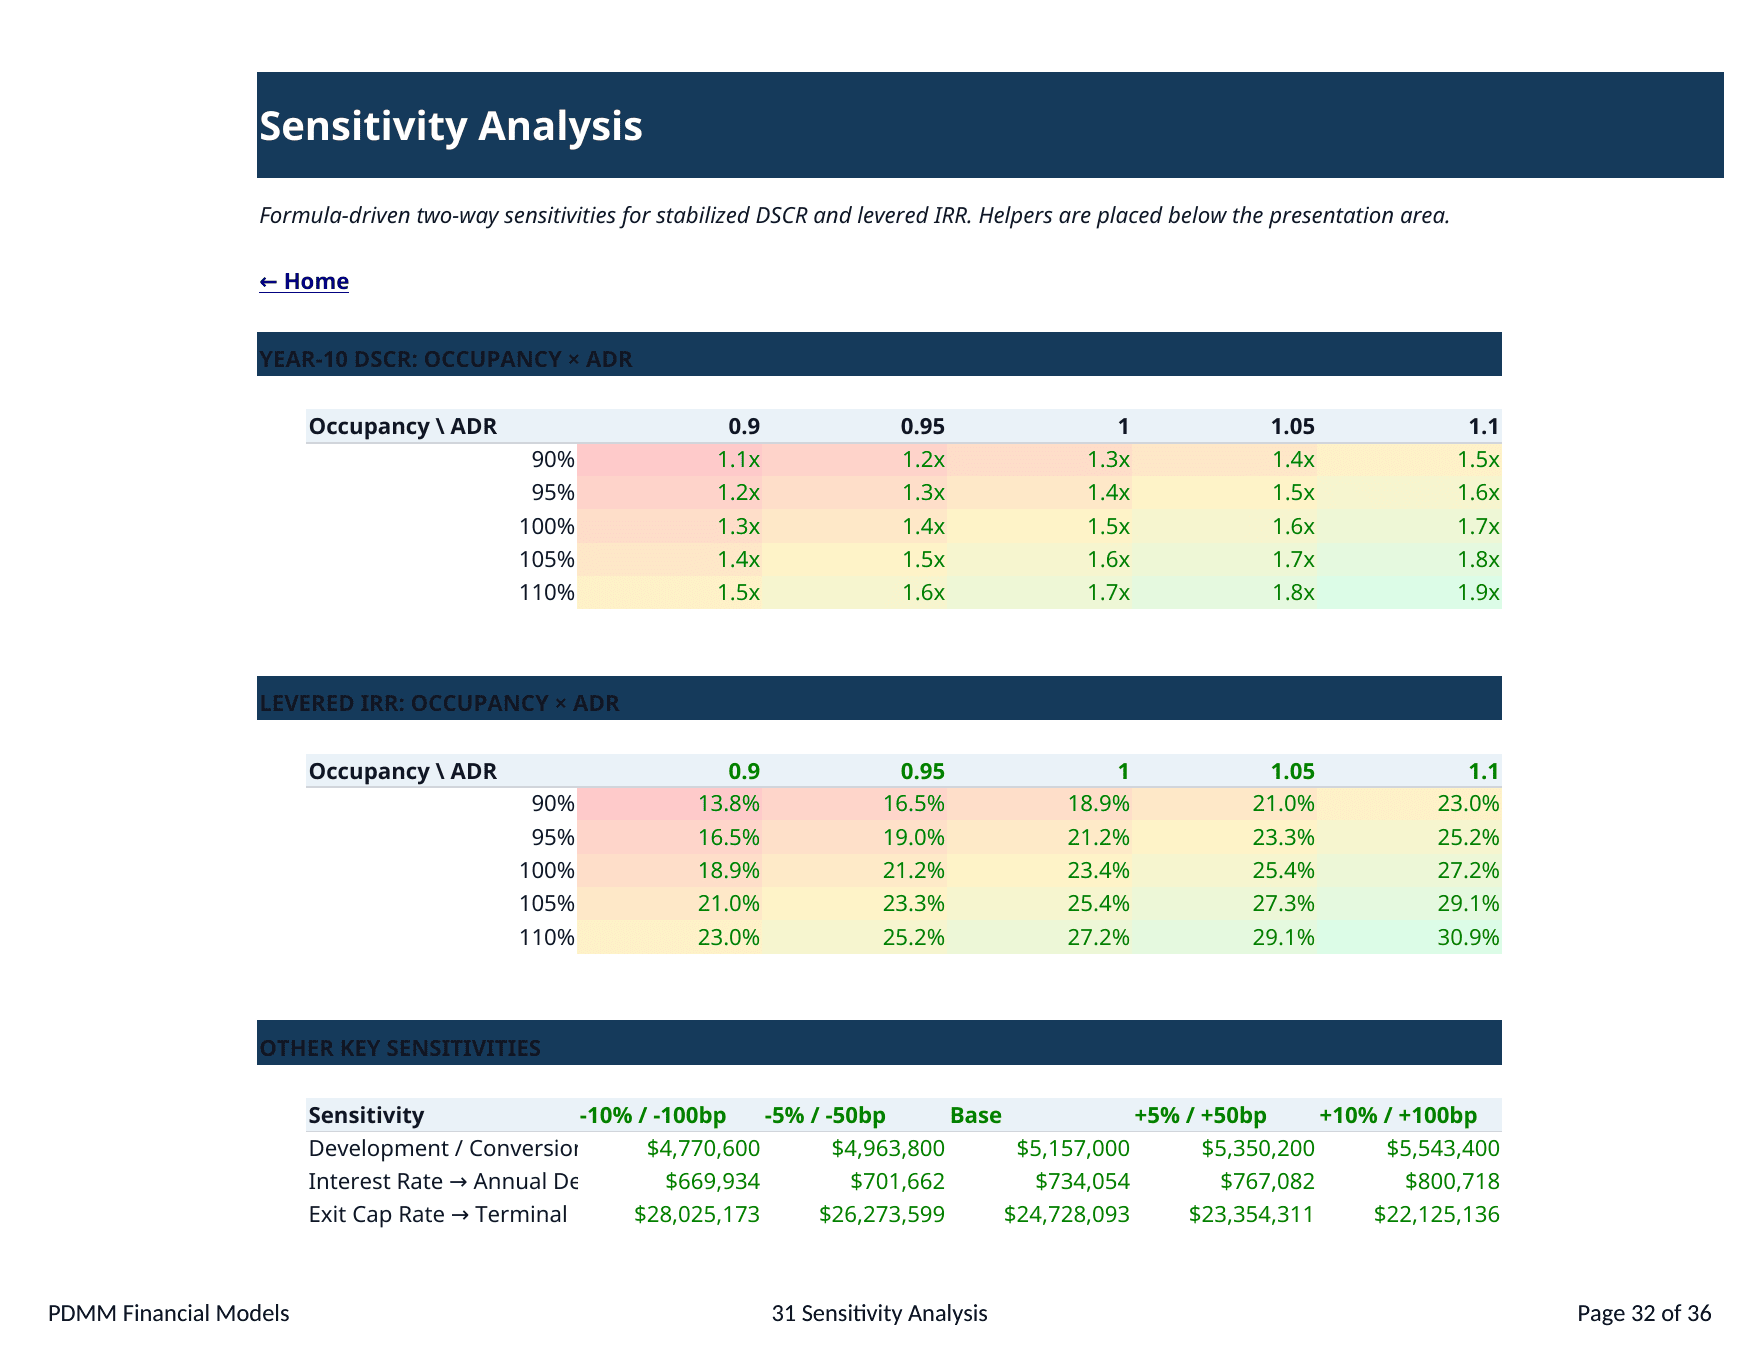
The active model is controlled by Downside, Base and Upside scenarios. A dedicated Scenario Comparison sheet summarizes scenario economics side by side. Sensitivity Analysis includes two-way occupancy × ADR tables for DSCR and levered IRR, plus dedicated sensitivities for development/conversion cost, interest rate, exit cap rate and housekeeping efficiency/cost. Break-Even Analysis calculates contribution per occupied room night, fixed costs, break-even occupied nights, break-even occupancy, break-even RevPAR and occupancy cushion.
📚 Workbook structure – 36 worksheets
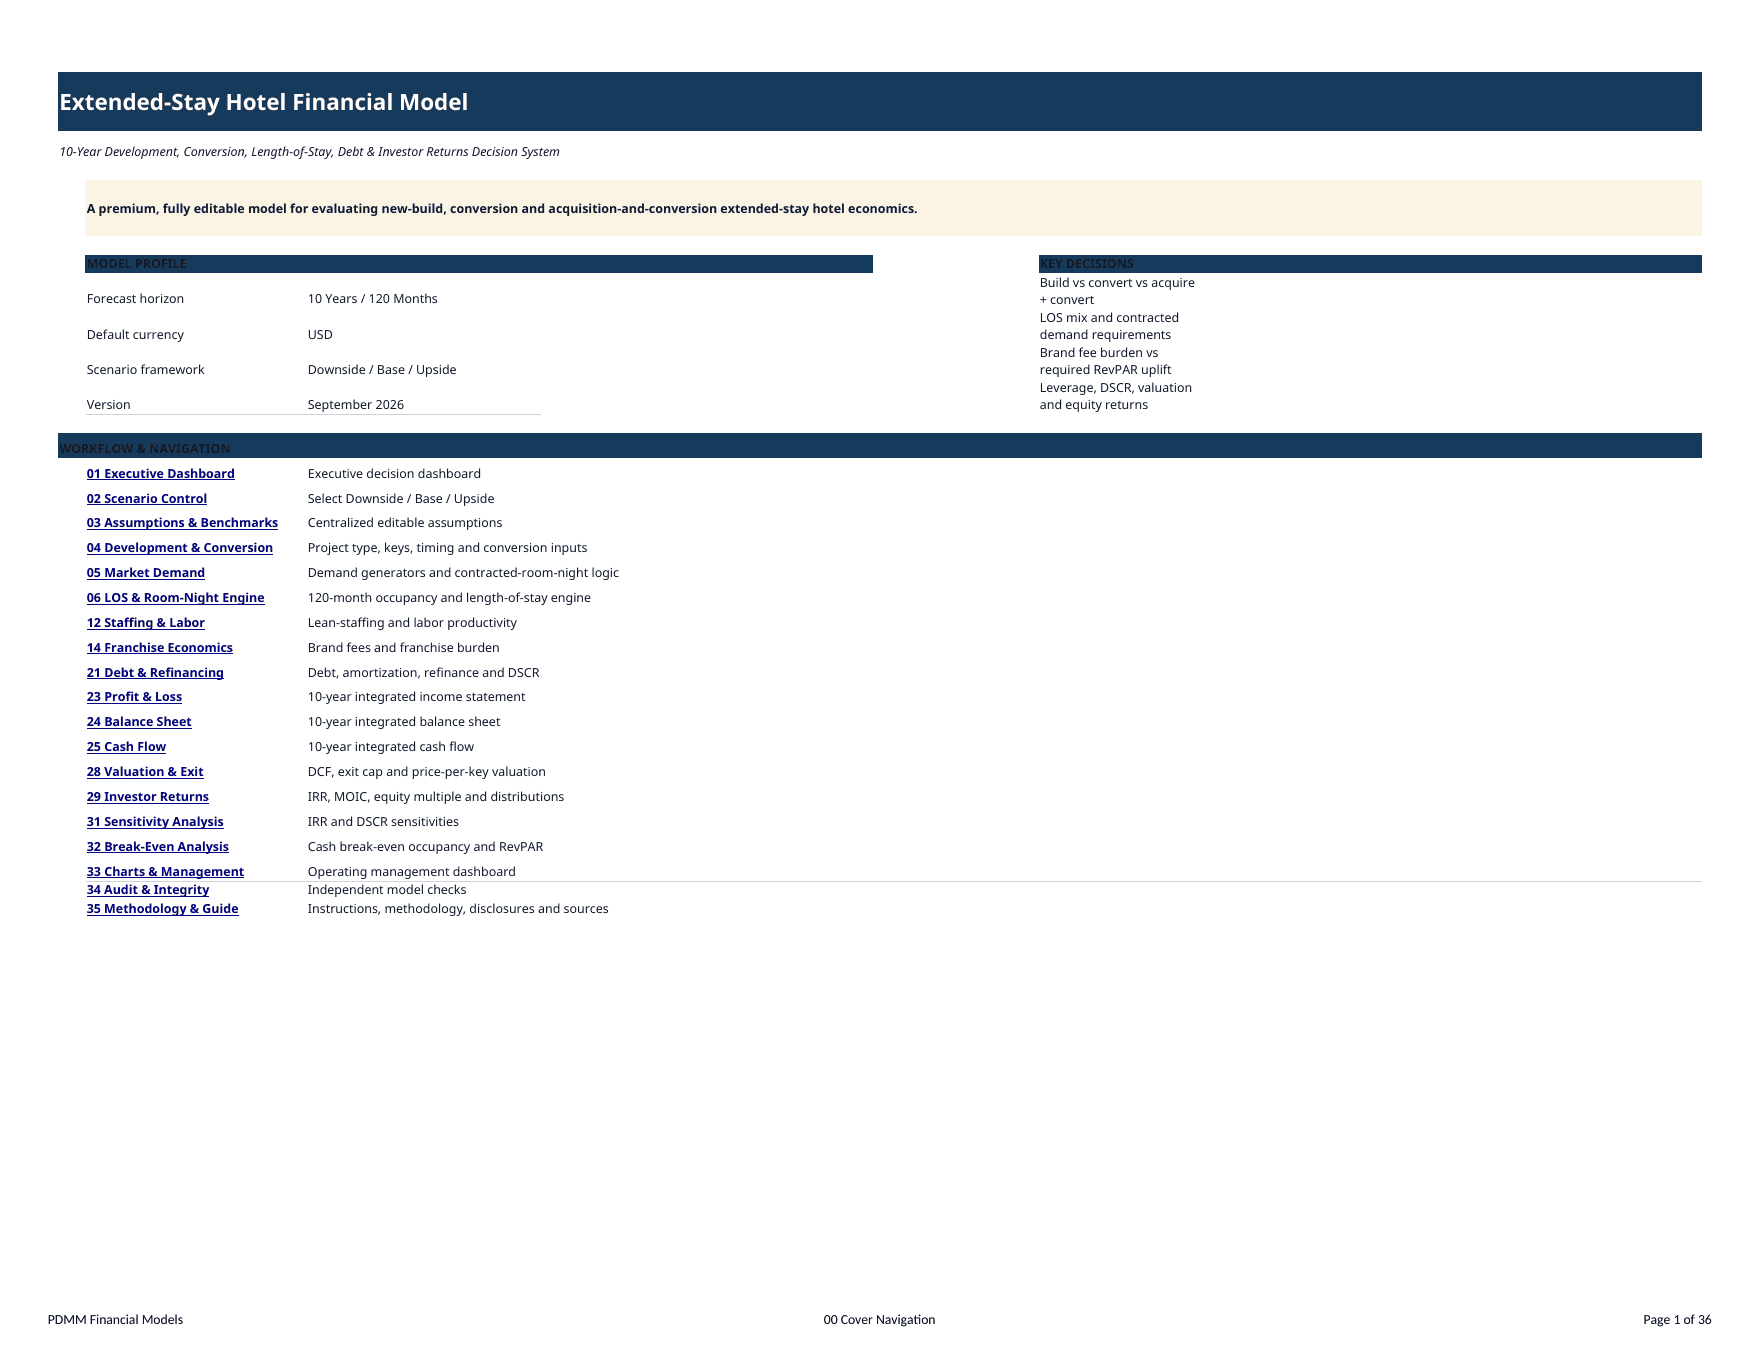
Navigation & controls: 00 Cover & Navigation; 01 Executive Dashboard; 02 Scenario Control; 03 Assumptions & Benchmarks; 04 Development & Conversion.
Demand, pricing & operations: 05 Market Demand; 06 LOS & Room-Night Engine; 07 Pricing; 08 Rooms Revenue; 09 Ancillary Revenue; 10 Channel & Contract Mix; 11 Housekeeping & Turnover; 12 Staffing & Labor; 13 Departmental Opex; 14 Franchise Economics; 15 Brand Comparison; 16 Development CapEx; 17 Opening & Stabilization.
Capital, statements & finance: 18 Sources & Uses; 19 Fixed Assets & Dep; 20 Working Capital; 21 Debt & Refinancing; 22 FF&E Reserve; 23 Profit & Loss; 24 Balance Sheet; 25 Cash Flow.
Decision outputs: 26 Hotel KPIs; 27 DSCR & Covenants; 28 Valuation & Exit; 29 Investor Returns; 30 Scenario Comparison; 31 Sensitivity Analysis; 32 Break-Even Analysis; 33 Charts & Management; 34 Audit & Integrity; 35 Methodology & Guide.
🎯 Practical use cases
- Hotel planning: build a complete 10-year operating and capital plan before launch or repositioning.
- Financial forecasting: translate room-night, ADR, stay mix and operating assumptions into monthly and annual forecasts.
- Profitability analysis: identify how labor, supplies, utilities, brand costs and occupancy affect EBITDA/GOP.
- Cash-flow planning: evaluate working capital, FF&E reserve funding, development spend, liquidity and refinancing cash flows.
- Pricing strategy: compare nightly, weekly and monthly stay economics through configurable LOS discounts.
- Scenario planning: test Downside, Base and Upside cases from one scenario control.
- Sensitivity analysis: measure IRR and DSCR exposure to occupancy, ADR, cost, interest rate, exit cap and housekeeping efficiency.
- Operational planning: quantify housekeeping workload, FTE requirements, labor cost per occupied night and revenue per FTE.
- Debt sizing and covenant review: evaluate DSCR, debt yield, LTV, debt balance and liquidity headroom.
- Brand strategy: compare branded and independent economics and analyze franchise fee burden.
- Development/conversion feasibility: compare project types and understand the capital required for each path.
- Valuation and investor returns: review DCF value, terminal value, levered IRR, MOIC and terminal equity proceeds.
📉 Dashboards and visual outputs
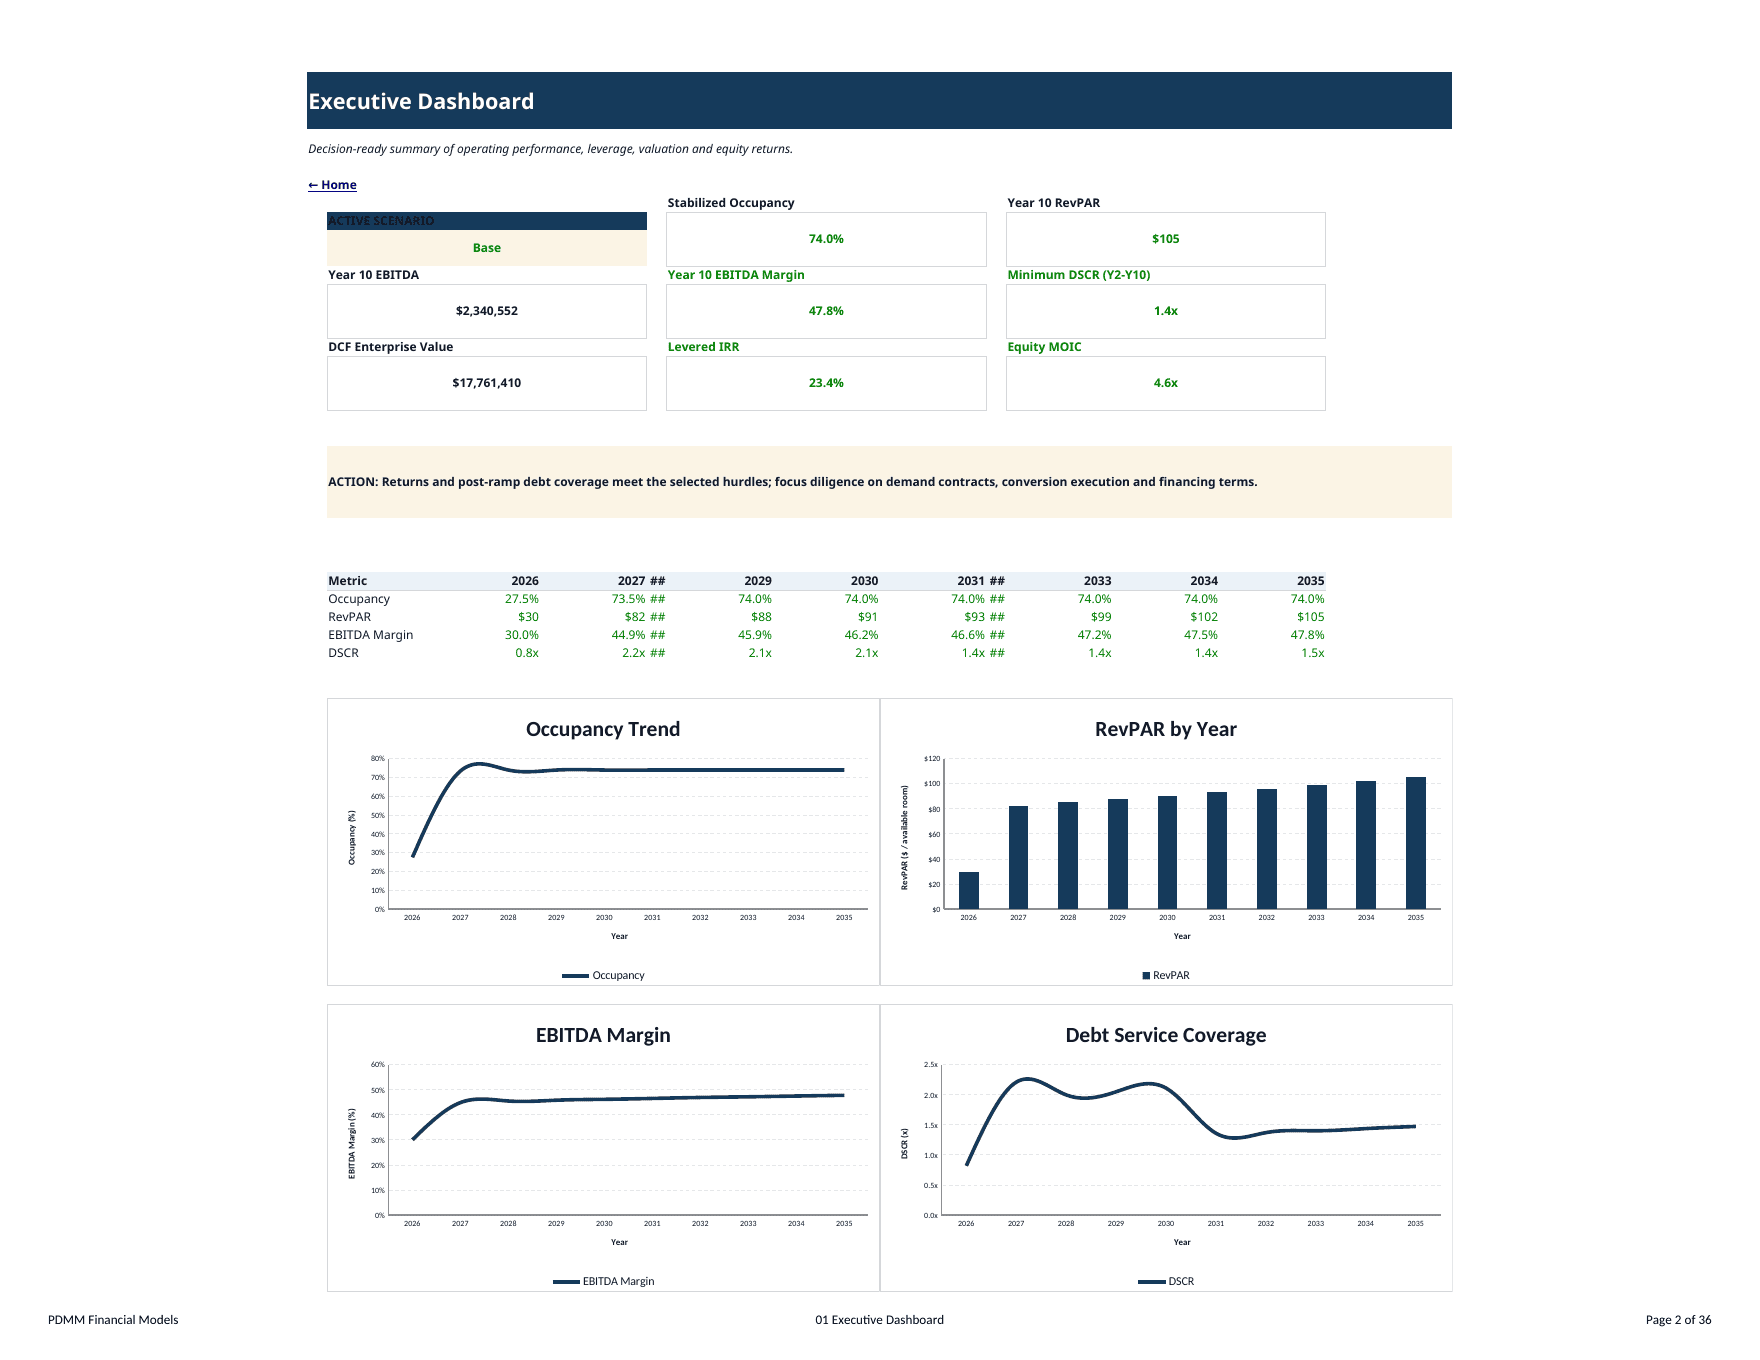
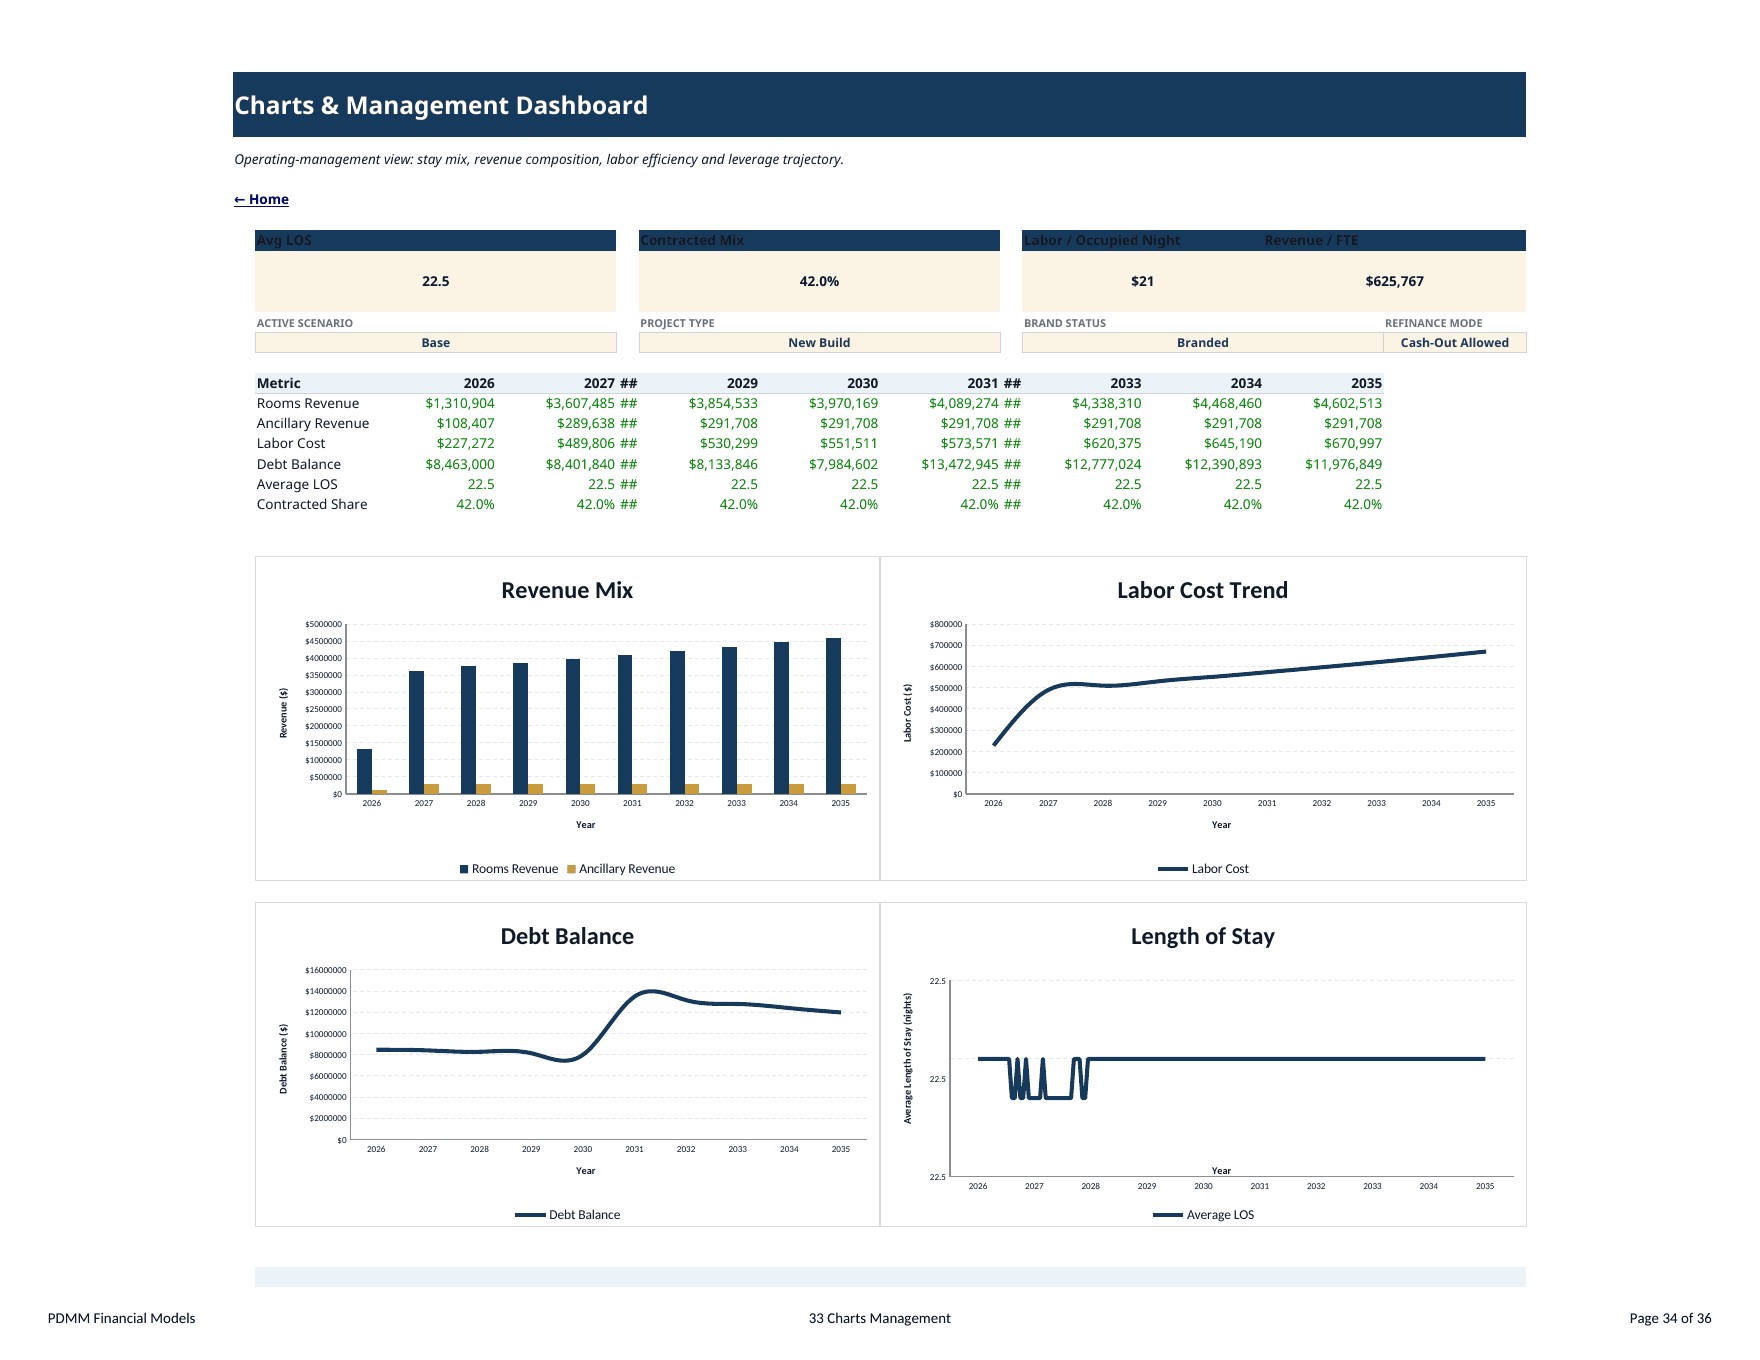
The workbook includes two buyer-facing dashboard sheets with 8 native Excel charts. The Executive Dashboard summarizes stabilized occupancy, Year-10 RevPAR, Year-10 EBITDA, EBITDA margin, minimum post-ramp DSCR, DCF enterprise value, levered IRR and equity MOIC, together with an action panel. Native charts cover Occupancy Trend, RevPAR by Year, EBITDA Margin and Debt Service Coverage. The Charts & Management Dashboard adds Revenue Mix, Labor Cost Trend, Debt Balance and Length of Stay.
✅ Model integrity and usability
Editable assumptions are centralized, the workbook includes internal navigation, and the Audit & Integrity sheet independently checks sources versus uses, LOS mix, demand mix, occupancy bounds, break-even feasibility, debt roll-forward, P&L revenue ties, balance-sheet balance, cash roll-forward, valuation and scenario validity. It also independently recomputes Year-10 rooms revenue, labor cost, EBITDA, debt service and terminal value.
📦 Delivered files
The premium package includes the fully editable Excel model, a 36-page full-sheet PDF preview with one page per worksheet, and a curated set of buyer-facing screenshots covering the model’s strongest operating, financing and decision outputs.
Similar ProductsOther customers were also interested in...



 eFinancialModels
Electric Vehicle (EV) Charging Station Financial M...
With this comprehensive 5- or 10-year monthly tool, investors can assess the viability of setting up... Read more

Financial Model for Mobile App | Mobile App Busine...
The Mobile App Financial Plan Template in Excel allows you to develop financial projections when lau... Read more

 HenrySheykin
Food Truck Financial Model Excel Template
The Food Truck Financial Model helps entrepreneurs, founders, business owners, consultants, and anal... Read more

Green Hydrogen Production from Wind Energy Financi...
The Green Hydrogen from Wind Financial Model aims to comprehensively forecast a horizon of 40 years ... Read more

Simple Mutual Non-Disclosure Agreement Template
Protect your business secrets with ease using our Simple Mutual Non-Disclosure Agreement Template. S... Read more

Solar Energy Financial Model
The Solar Energy Financial Model Spreadsheet Template in Excel assists you in preparing a sophistica... Read more

 Peter Graf
The Customer-Centric Financial Model for Restauran...
Starting a restaurant without a financial plan is like driving a car blindfolded. You wouldn´t do i... Read more
You must log in to submit a review.