
0 ITEMS

Cross-Border Dropshipping Product Testing, Landed Cost, Ad Scaling & Cash Flow Financial Model
Turn product testing into a disciplined financial decision process instead of relying on revenue, ROAS, or ad-platform signals alone. This premium Excel model is built for dropshipping and cross-border e-commerce operators who need to decide which products deserve more spend, which ones require a pricing or supplier change, and which ones should be stopped before they absorb more cash. The workbook connects product-level paid-media performance to true delivered economics, contribution margin, payout timing, reserves, refunds, shipping risk, and liquidity. It is designed for everyday operators, agencies, consultants, and finance professionals who want a practical decision engine rather than a generic long-range business plan.

🌍 Cross-Border Dropshipping Product Testing, Landed Cost, Ad Scaling & Cash Flow Financial Model
Turn product testing into a disciplined financial decision process instead of relying on revenue, ROAS, or ad-platform signals alone. This premium Excel model is built for dropshipping and cross-border e-commerce operators who need to decide which products deserve more spend, which ones require a pricing or supplier change, and which ones should be stopped before they absorb more cash.
The workbook connects product-level paid-media performance to true delivered economics, contribution margin, payout timing, reserves, refunds, shipping risk, and liquidity. It is designed for everyday operators, agencies, consultants, and finance professionals who want a practical decision engine rather than a generic long-range business plan.
🎯 What decisions does the model support?
Use the model to evaluate whether a product should Scale, Retest, Reprice, Change Supplier, Change Route, or Kill. The decision logic is driven by the actual economics in the workbook, including selling price, landed cost, platform and payment fees, affiliate commission, expected return and chargeback loss, CAC, break-even CAC, CM3 margin, refund thresholds, and route economics.
You can also compare the financial effect of source country, destination market, fulfillment route, supplier economics, DDP versus DAP/DDU treatment, shipping method, paid-media scaling, price changes, bundles, and cash-settlement timing.
🧪 Product testing and paid-media funnel
The Product SKU Master contains 24 coherent sample SKUs and supports up to 24 active rows in the current model structure. It captures product name, category, supplier, source country, source currency, destination, sales channel, fulfillment route, selling price, supplier quote, FX conversion, sourcing and packaging, freight, weight, items per order, MOQ, defect rate, refund rate, chargeback rate, failed-delivery rate, and reshipment rate.
The Product Testing Lab and Advertising Funnel connect test budget and traffic metrics to CPM, impressions, CTR, clicks, CPC, conversion, orders, revenue, CAC, ROAS, and decision signals. Scenario conversion factors feed into the funnel so Downside, Base, and Upside cases change the actual order and CAC economics rather than simply changing labels.
🌐 Cross-border landed cost and fulfillment economics
The Market & Channel Assumptions sheet centralizes destination customs assumptions, channel fees, affiliate economics, payout lags, reserve percentages, reserve-release days, fulfillment-route factors, loss assumptions, and the editable source-country × destination duty matrix.
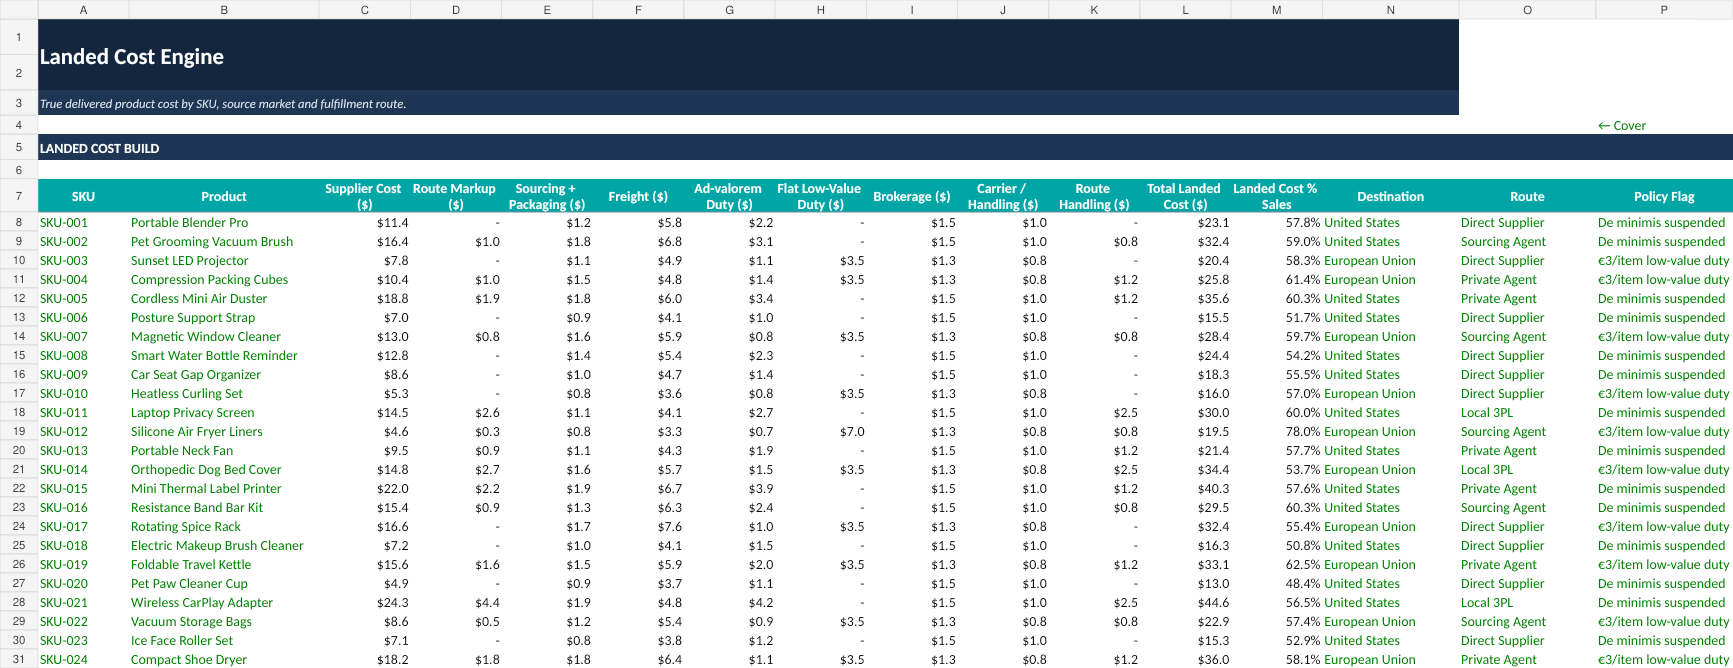
The Landed Cost Engine converts supplier quotes into USD using the product-level FX input and builds true delivered cost from supplier cost, route markup, sourcing and packaging, freight, ad-valorem duty, flat duty, brokerage, handling, and destination charges. The model includes editable U.S. low-value import treatment and EU low-value customs assumptions with source/version tracking inside the workbook.
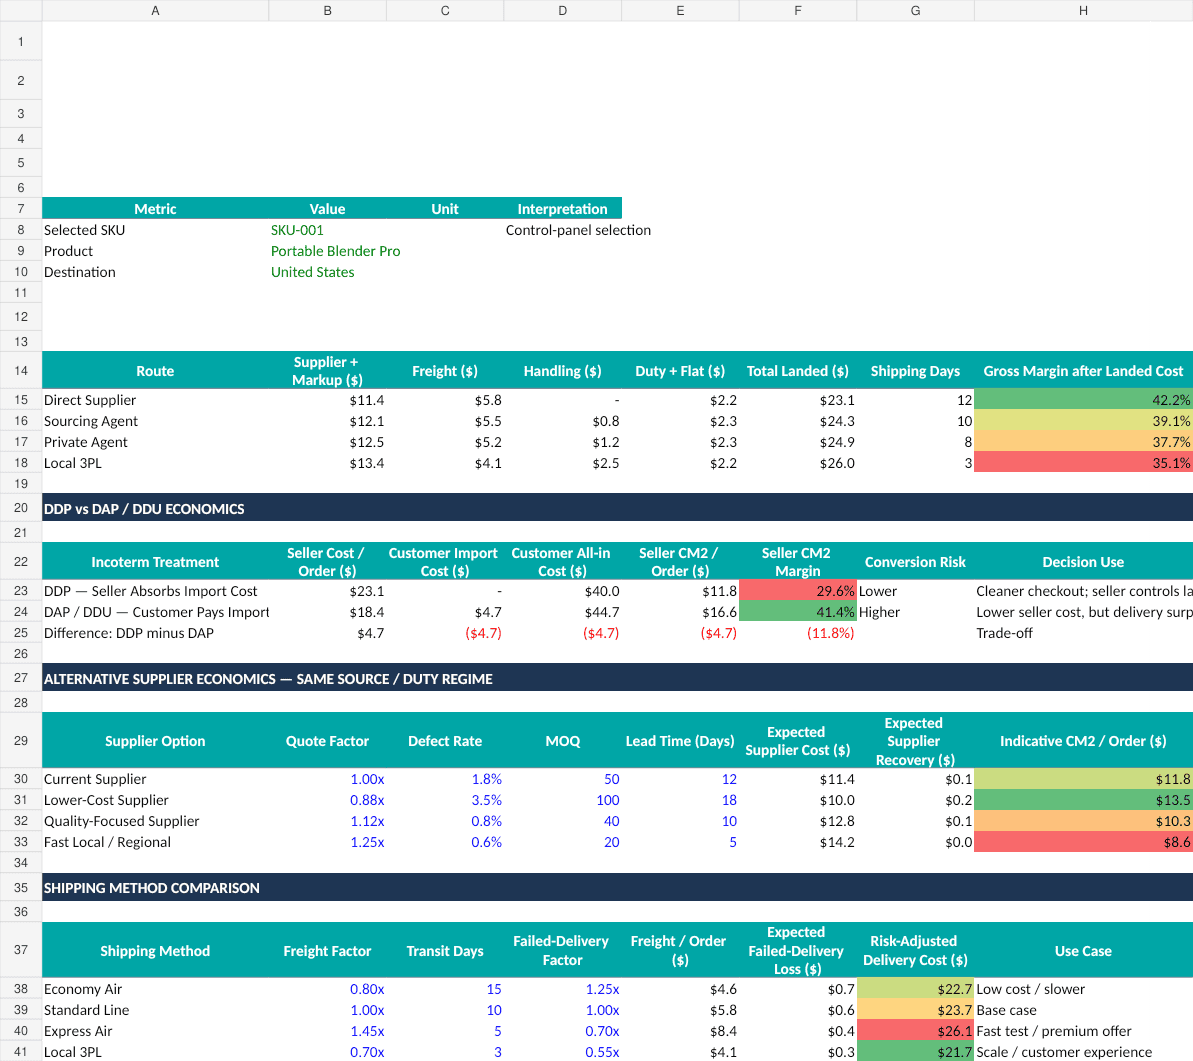
The Supplier & Route Comparison adds route comparisons, DDP versus DAP/DDU economics, alternative supplier economics, expected supplier recovery, shipping-method comparison, delivery timing, failed-delivery factors, and risk-adjusted delivery cost. This makes the model useful when the cheapest supplier is not necessarily the best economic choice.
💰 Unit economics, returns, payouts, and contribution margin
The Unit Economics schedule calculates CM1, CM2, and CM3 by SKU, along with margins, break-even CAC, CAC headroom, ranking, and the product decision. The portfolio winner ranking is based on contribution economics rather than revenue alone.
The Returns & Chargebacks schedule models expected refund loss, supplier recovery, reshipment cost, chargeback cost, failed-delivery loss, return administration, and total expected loss. The Payouts & Reserves schedule models channel-specific reserve percentages, payout lag, reserve release timing, gross cash released before fees, and optional early-settlement cost.
These schedules matter because a product can look attractive on ad-platform ROAS while still consuming cash after delivered cost, returns, platform deductions, and delayed settlements.
📈 Pricing, offers, and ad scaling
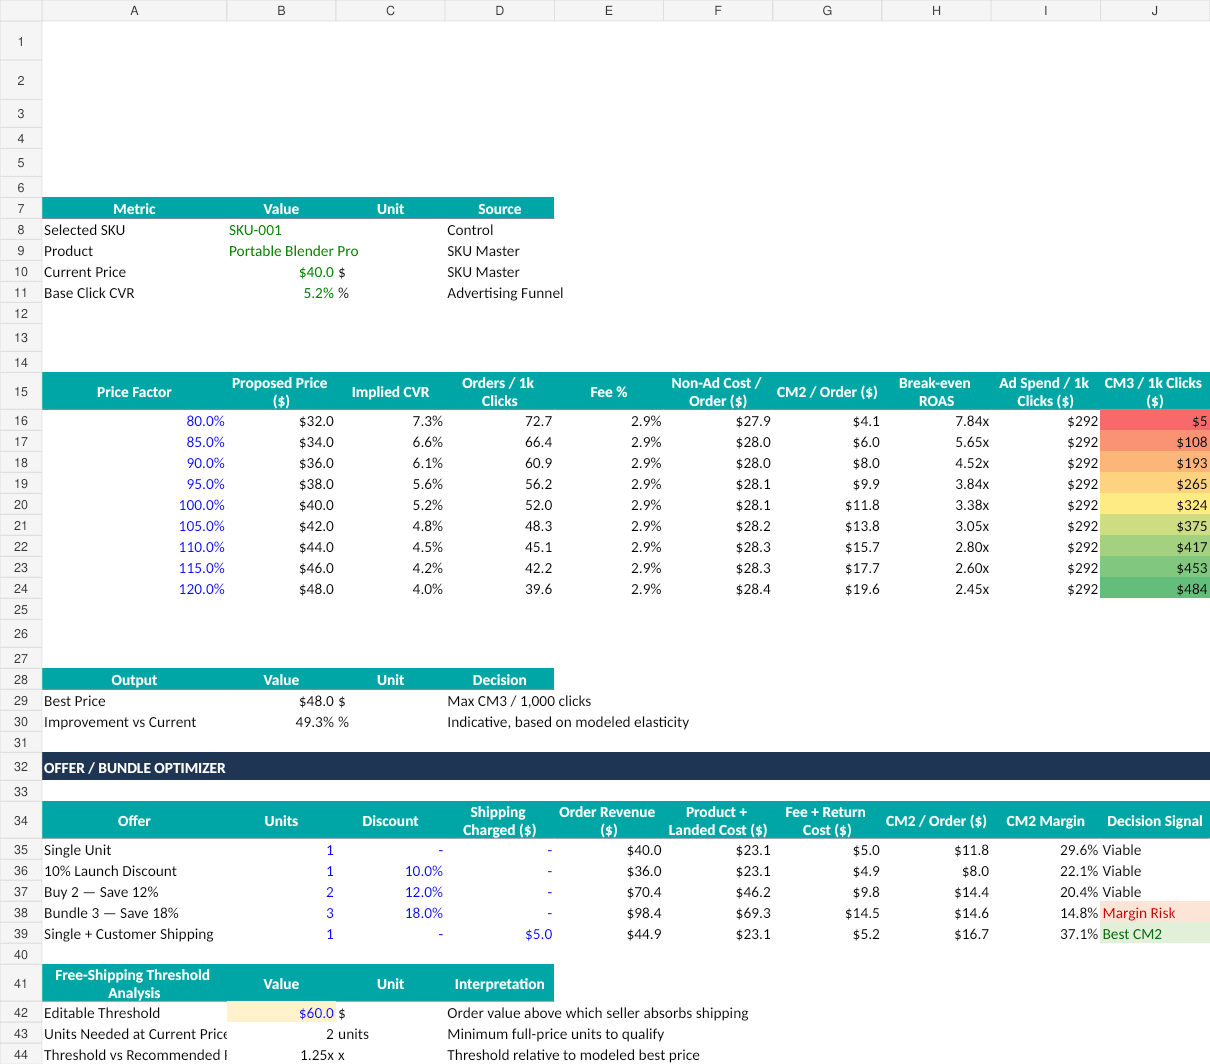
The Pricing & Offer Optimizer tests a price ladder and shows modeled conversion, clicks/orders, revenue, landed cost, fees, CM2, CM3, and contribution profit per 1,000 clicks. It also compares single-unit offers, discount offers, multi-unit bundles, customer-paid shipping, and a free-shipping threshold.
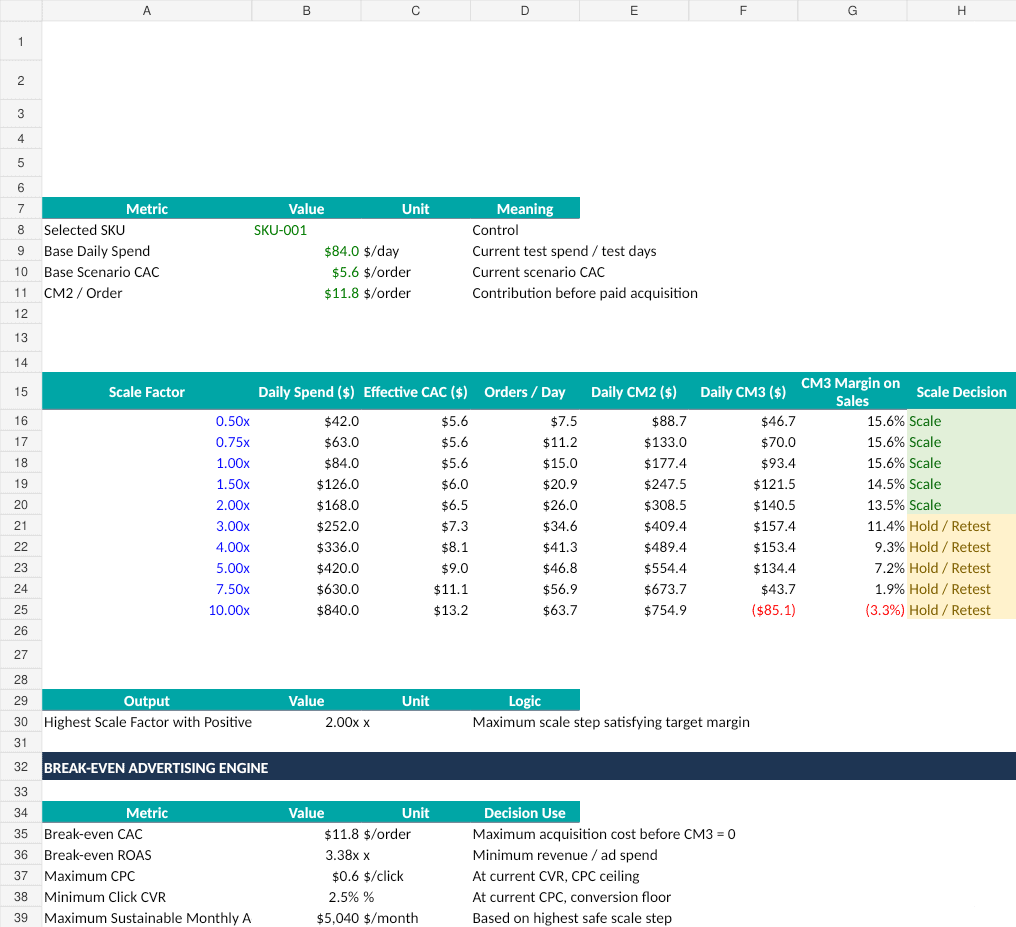
The Ad Scaling Engine models daily spend at multiple scale factors while allowing CAC inflation and conversion deterioration as spend increases. It calculates daily CM3, CM3 margin, scale decisions, the highest safe scale factor, break-even CAC, break-even ROAS, maximum CPC, minimum CVR, and maximum sustainable monthly ad spend.
💵 Liquidity and operating forecast
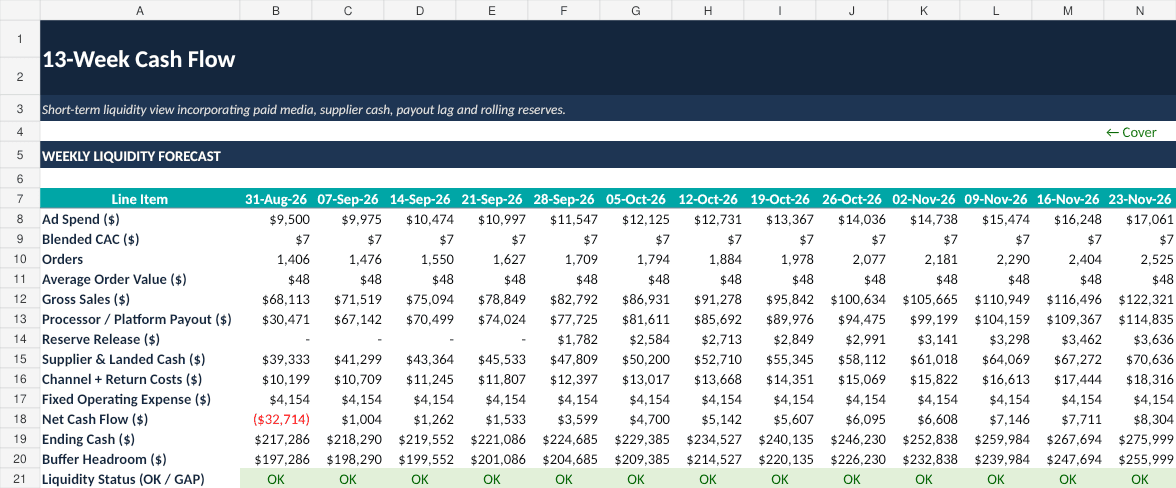
The 13-Week Cash Flow is a weekly liquidity view that tracks ad spend, blended CAC, orders, AOV, gross sales, processor/platform payouts, reserve releases, supplier and landed-cost cash, channel/return costs, fixed operating expense, net cash flow, ending cash, buffer headroom, and liquidity status.
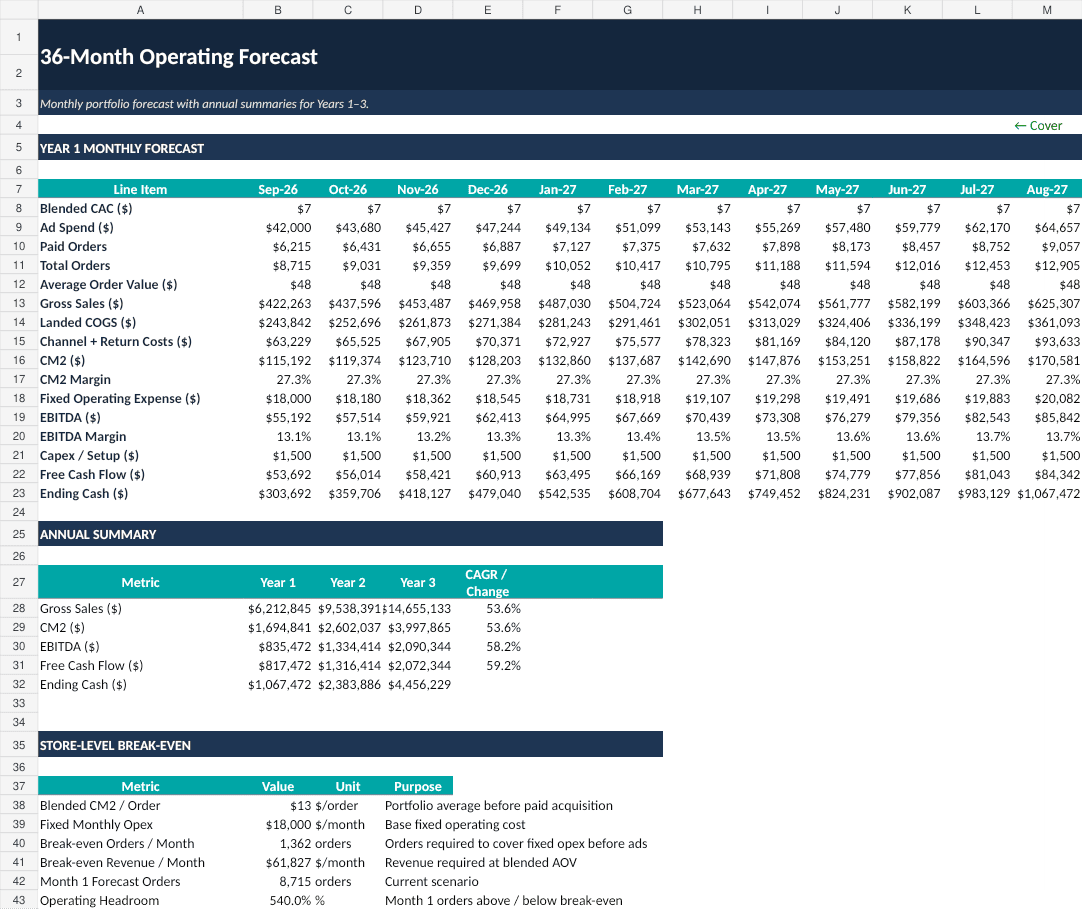
The 36-Month Forecast is a parallel monthly operating forecast starting from the same opening cash balance. It covers blended CAC, ad spend, paid orders, total orders, AOV, sales, landed COGS, channel and return costs, CM2, CM2 margin, operating expense, EBITDA, EBITDA margin, capex/setup, free cash flow, and ending cash. The buyer-facing presentation is organized into Year 1, Year 2, and Year 3 monthly blocks, with annual summaries and store-level break-even analysis.
Portfolio averages such as CAC, AOV, landed cost, channel/return cost, reserve rate, payout lag, and reserve-release days use the modeled order or revenue mix rather than simple equal-SKU averages.
🔄 Scenarios and sensitivities
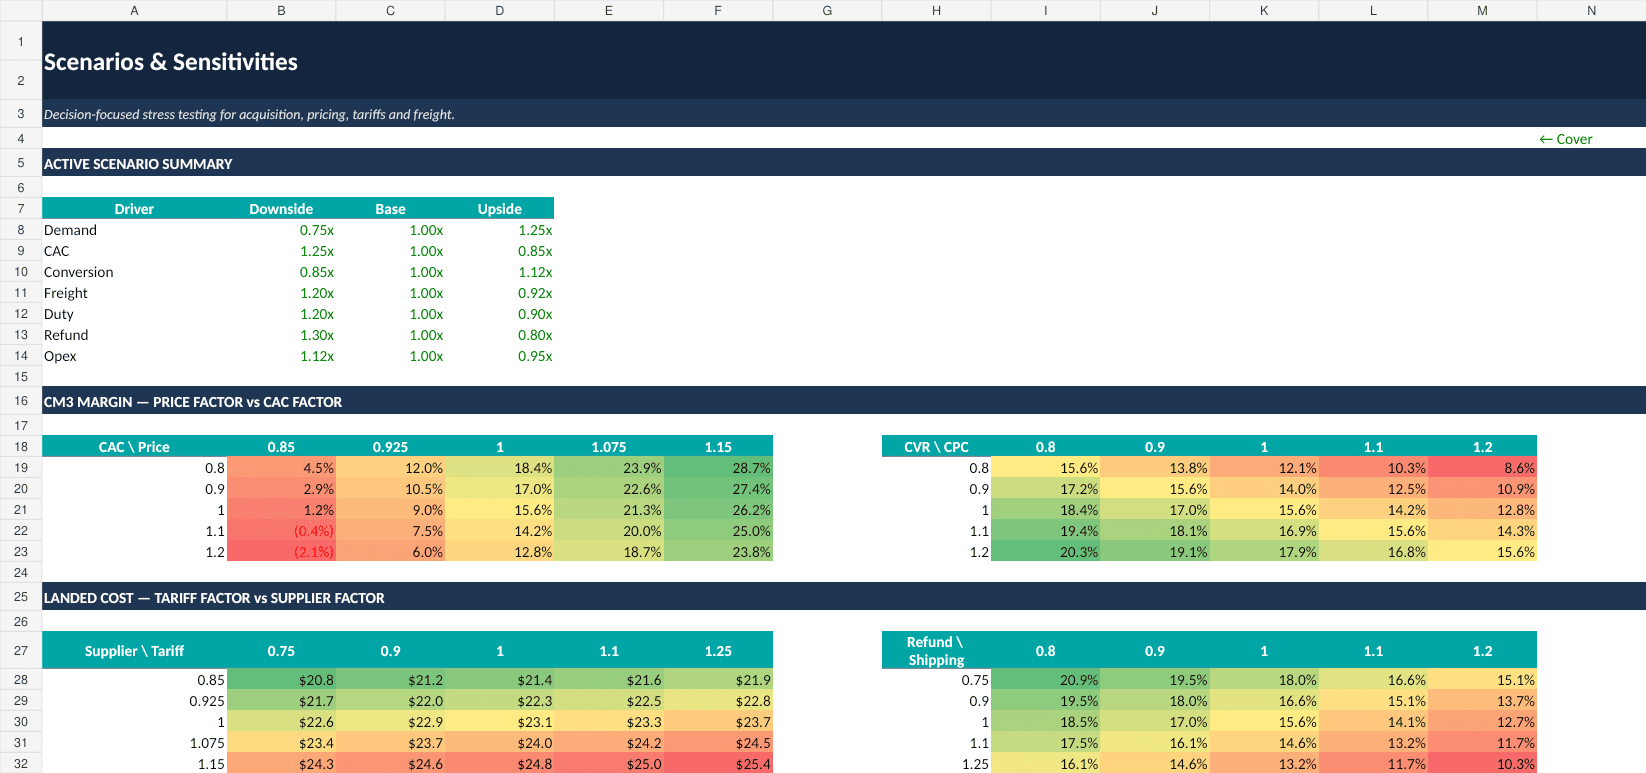
Switch between Downside, Base, and Upside scenarios from the Control Panel. The scenario system changes demand/orders, CAC, conversion, freight, duty/tariff, refund rate, and operating expense.
Four two-way sensitivity matrices show:
- CM3 margin across price factor vs CAC factor
- CM3 margin across CVR factor vs CPC factor
- Landed cost across tariff factor vs supplier factor
- CM3 margin across refund factor vs shipping factor
This makes it easier to see whether a product remains attractive when one assumption moves against you.
📊 Dashboards and decision views
The workbook includes three principal decision dashboards with 10 native Excel charts:
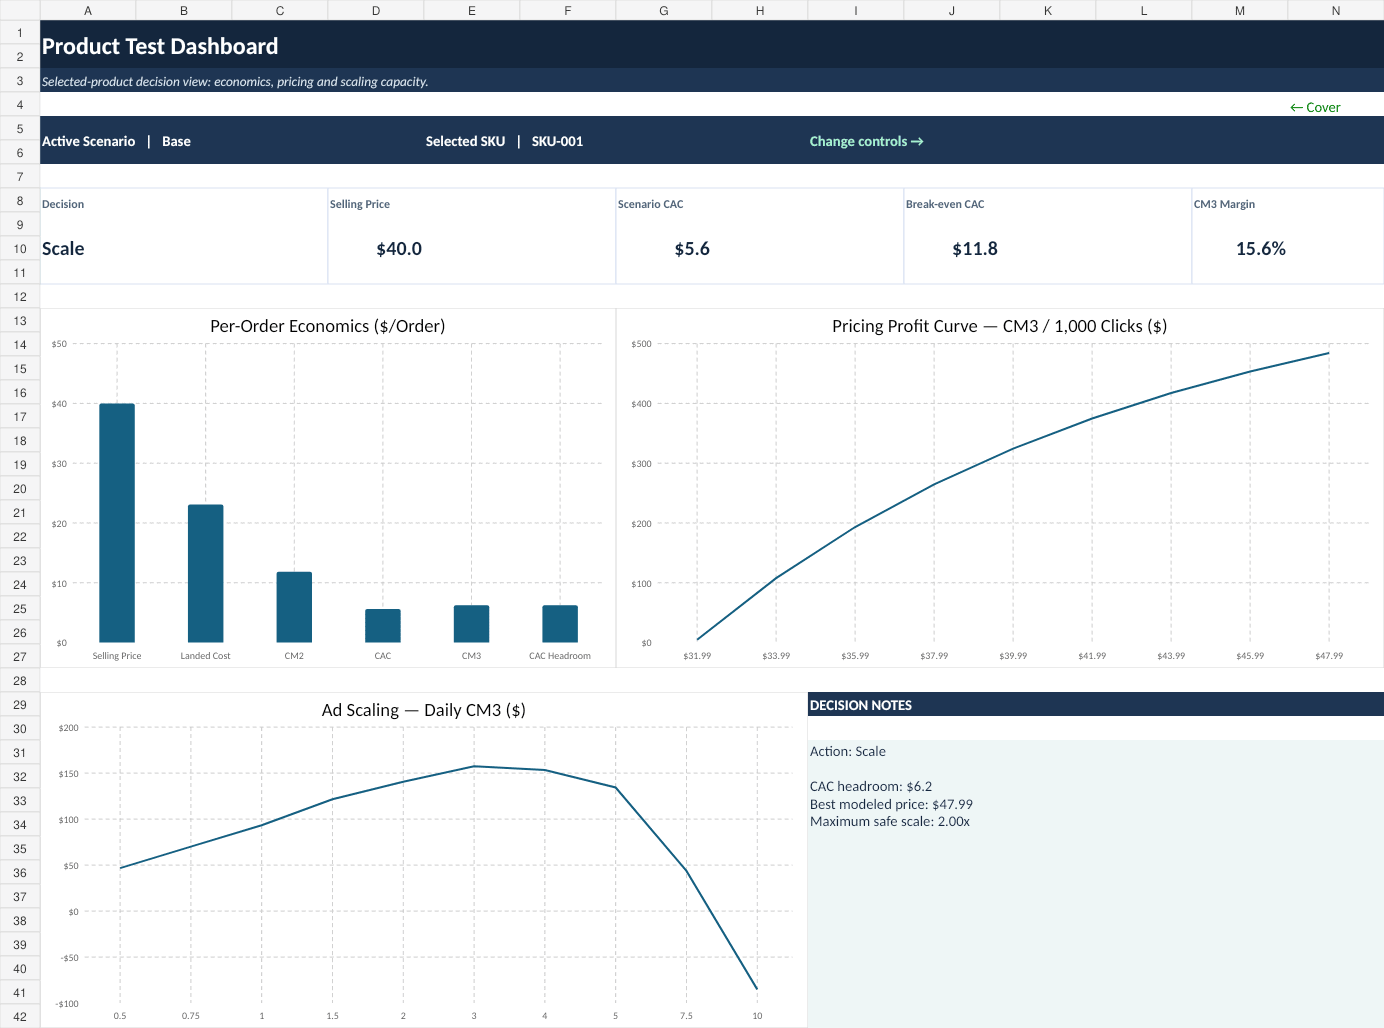
- Product Test Dashboard — selected-product decision, selling price, scenario CAC, break-even CAC, CM3 margin, per-order economics, price/profit curve, ad-scaling curve, and action notes.
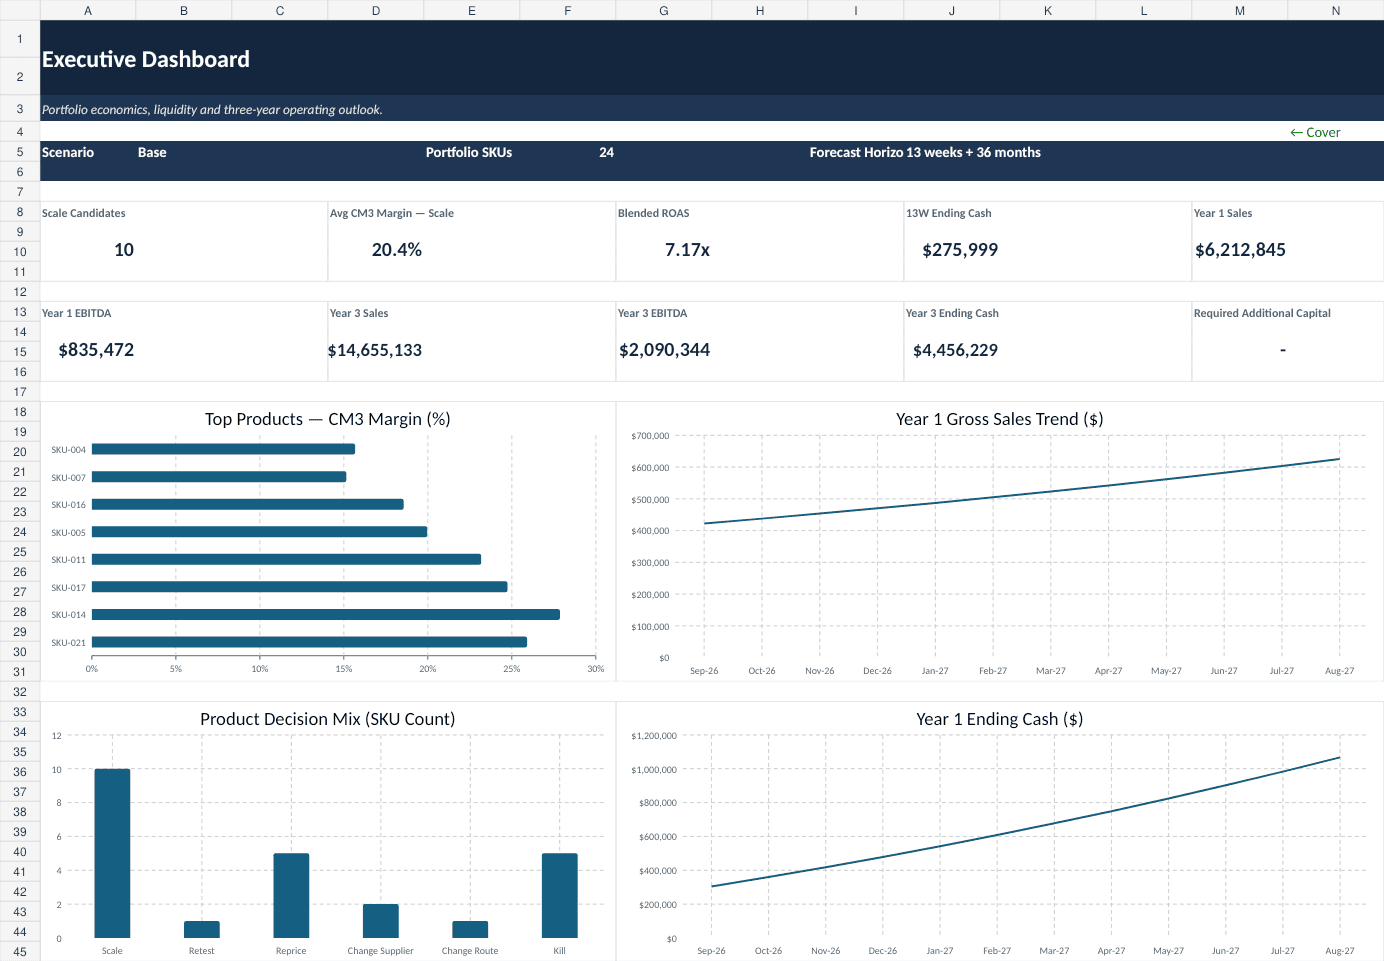
- Executive Dashboard — scale-candidate count, average CM3 margin for scale candidates, blended ROAS, 13-week ending cash, Year 1 sales, Year 1 EBITDA, Year 3 sales, Year 3 EBITDA, Year 3 ending cash, required additional capital, top-product margins, product decision mix, and cash/sales trends.
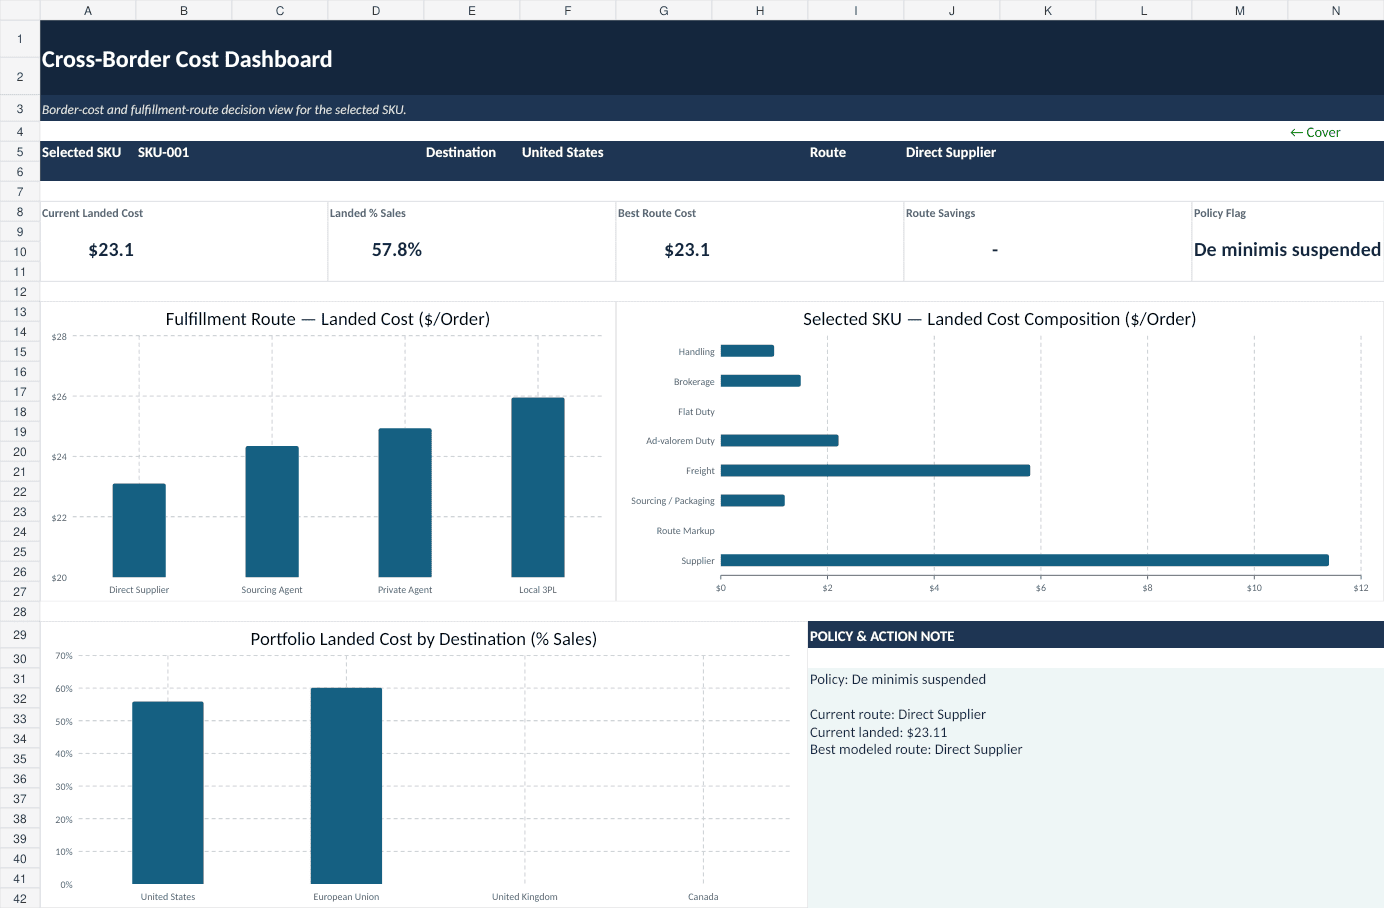
- Cross-Border Cost Dashboard — selected SKU, destination, current route, landed cost, landed cost as a percentage of sales, best route cost, route savings, policy flag, route comparison, landed-cost composition, destination exposure, and policy/action notes.
⚙️ Workbook workflow
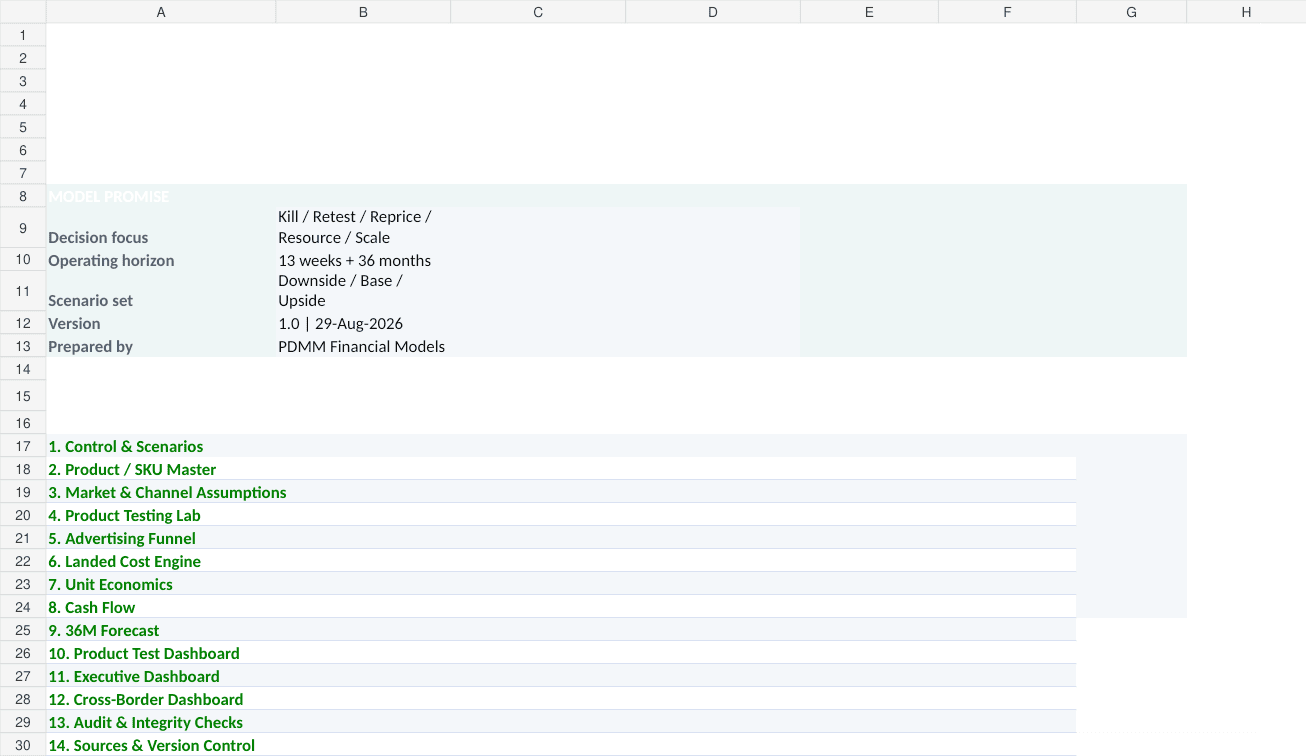
Start with 00_Cover_Navigator and 01_Instructions_Disclaimer, then set the scenario, selected SKU, thresholds, cash assumptions, and forecast drivers in 02_Control_Panel. Edit the product database in 03_Product_SKU_Master and the centralized operating/regulatory assumptions in 04_Market_Channel_Assumptions. Review testing and funnel output in sheets 05–06, border and route economics in sheets 07–08, contribution economics and loss/payout mechanics in sheets 09–11, optimization and scaling in sheets 12–13, liquidity and monthly outlook in sheets 14–15, and stress testing in sheet 16. Sheets 17–19 provide decision dashboards, sheet 20 contains integrity checks, and sheet 21 contains sources and regulatory-version tracking.
✅ Model integrity and usability
The final audited workbook contains 43 passing integrity checks, 0 warnings, and 0 failures in the restored Base case. Checks cover active SKU structure, input bounds, scenario factors, landed-cost reconciliation, CM3 bridge, break-even CAC, decision completeness, cash roll-forwards, reserve bounds, paid-order share, liquidity, duty-matrix bounds, DDP/DAP reconciliation, offer economics, advertising break-even metrics, sensitivity centers, weighted averages, required classifications, selected-SKU validity, and cash-timing consistency.
The file is fully editable, uses internal navigation links, includes sample data so every major calculation can be reviewed immediately, and contains centralized assumptions rather than hidden business inputs inside formulas.
👥 Who is it for?
This model is designed for dropshipping entrepreneurs, Shopify and WooCommerce store owners, TikTok Shop sellers, e-commerce agencies, product-research teams, paid-media operators, virtual CFOs, accountants, and consultants who need a more rigorous answer to one question: which product should receive the next dollar of cash and advertising spend?
📦 Delivered package
The marketplace package includes the client-ready Excel workbook, a 22-page full-workbook PDF preview with one worksheet per page, and a curated screenshot set covering the strongest buyer-facing decision views.
Similar ProductsOther customers were also interested in...



 eFinancialModels
Electric Vehicle (EV) Charging Station Financial M...
With this comprehensive 5- or 10-year monthly tool, investors can assess the viability of setting up... Read more

Financial Model for Mobile App | Mobile App Busine...
The Mobile App Financial Plan Template in Excel allows you to develop financial projections when lau... Read more

 HenrySheykin
Food Truck Financial Model Excel Template
The Food Truck Financial Model helps entrepreneurs, founders, business owners, consultants, and anal... Read more

Green Hydrogen Production from Wind Energy Financi...
The Green Hydrogen from Wind Financial Model aims to comprehensively forecast a horizon of 40 years ... Read more

Simple Mutual Non-Disclosure Agreement Template
Protect your business secrets with ease using our Simple Mutual Non-Disclosure Agreement Template. S... Read more

Solar Energy Financial Model
The Solar Energy Financial Model Spreadsheet Template in Excel assists you in preparing a sophistica... Read more

 Peter Graf
The Customer-Centric Financial Model for Restauran...
Starting a restaurant without a financial plan is like driving a car blindfolded. You wouldn´t do i... Read more
You must log in to submit a review.