
0 ITEMS

Lighting Equipment Manufacturer Financial Model
Comprehensive editable, 5-year 3 statement MS Excel spreadsheets for tracking Lighting Equipment Manufacturer finances. Income Statements, Balance Sheets, & Cash Flow Statements, provide a comprehensive view of financial performance.
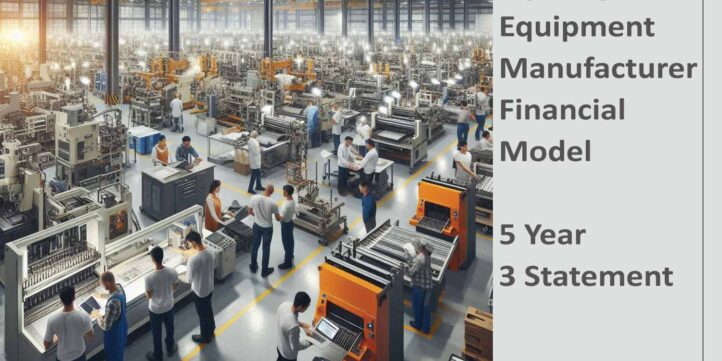


Financial Model for a Lighting Equipment Manufacturer
This detailed financial model provides a comprehensive framework to manage the financial health of a Lighting Equipment Manufacturer, encompassing key elements like the Income Statement, Cash Flow Statement, and Balance Sheet. The model includes financial analysis for 40-product line and 80-product line scenarios and a robust 6-Tier Subscription Model for ongoing customer revenue.
1. Income Statement
Revenue Streams
- Product Sales:
- Standard Line: High-volume products like LED bulbs, downlights, and floodlights.
- Premium Line: Specialty lights such as smart lighting systems, solar-powered lights, and architectural lighting.
- Custom Orders: Tailored lighting solutions for large commercial or industrial projects.
- Service Contracts:
- Installation, maintenance, and calibration services for lighting systems.
- Subscription-Based Offerings (explained further below):
- Ongoing access to advanced features and software for smart lighting systems.
- Spare Parts and Consumables:
- Replacement drivers, controllers, and other parts.
Expenses
- Cost of Goods Sold (COGS):
- Direct Materials: LEDs, housing, wiring, electronics, and packaging.
- Labor: Skilled manufacturing workforce.
- Overheads: Depreciation of manufacturing equipment, factory utilities, and testing tools.
- Operating Expenses:
- R&D: Innovation in energy efficiency and smart system technologies.
- Sales and Marketing: Trade show participation, advertising, and distributor management.
- Administrative Costs: Salaries, ERP systems, office costs.
- Miscellaneous Costs:
- Certifications and compliance with safety standards (UL, CE, RoHS).
Key Profitability Metrics
- Gross Profit = Revenue – COGS.
- Operating Income (EBIT) = Gross Profit – Operating Expenses.
- Net Income = EBIT – Taxes – Interest.
2. Cash Flow Statement
Operating Activities
- Inflows:
- Payments for product sales (bulk orders for standard lines or custom orders).
- Service and subscription revenue.
- Spare parts and replacements.
- Outflows:
- Payments for raw materials and supplier invoices.
- Manufacturing wages and utility bills.
- Marketing and sales expenses.
Investing Activities
- Inflows:
- Sale of old equipment or production line assets.
- Outflows:
- Purchase of new machinery for production line scalability.
- Investment in proprietary lighting technologies and smart controls.
Financing Activities
- Inflows:
- Loans or equity raised for R&D expansion and new manufacturing capabilities.
- Outflows:
- Loan repayments.
- Shareholder dividends.
Key Metrics
- Free Cash Flow (FCF): Tracks cash available for growth or dividend distribution.
- Operating Cash Flow Conversion: Assesses liquidity strength.
3. Balance Sheet
Assets
- Current Assets:
- Cash and bank balances.
- Accounts receivable from distributor payments.
- Inventory: Raw materials (LED chips, housings), work-in-progress, and finished goods.
- Non-Current Assets:
- Machinery, molds, and equipment for lighting production.
- Intellectual property (smart system software, patents).
Liabilities
- Current Liabilities:
- Accounts payable to suppliers.
- Accrued operating expenses.
- Deferred revenue from prepaid subscriptions.
- Non-Current Liabilities:
- Bank loans or other long-term financial obligations.
Equity
- Retained earnings are reinvested into growth areas.
- Equity raised from external stakeholders.
4. 40- and 80-Product Line Scenarios
40-Product Line Scenario
A focused setup designed to cater to core market demands.
- Revenue Generation:
- Emphasis on standard and high-demand products like LED bulbs and downlights.
- Simpler operational needs; reduced inventory SKUs.
- Cost Management:
- Streamlined R&D for fundamental energy-efficient designs.
- Lower overhead due to reduced factory floor requirements.
- Target Audience:
- Regional suppliers, retailers, and small-scale industrial clients.
- Profit Margins:
- Gross Margin: ~35-50% (standardized manufacturing lines).
- Net Margin: ~10-15%.
80-Product Line Scenario
A comprehensive approach for catering to diverse and high-value markets.
- Revenue Generation:
- Expanded portfolio including premium and speciality lighting (smart lighting, high-output industrial systems).
- Custom orders for large commercial projects.
- Cost Management:
- Higher R&D and regulatory costs for cutting-edge technology and custom compliance.
- Increased logistical complexity for material sourcing and distribution.
- Target Audience:
- Large distributors, global markets, and specialized commercial or industrial applications.
- Profit Margins:
- Gross Margin: ~45-55% (premium pricing offsets complexity).
- Net Margin: ~15-20%.
5. 6-Tier Subscription Model
To drive recurring revenue, the subscription model targets users of smart and connected lighting systems.
Tier Structure
- Tier 1 (Basic):
- Access to standard system diagnostics.
- Remote firmware updates.
- Tier 2 (Standard):
- Includes Basic features.
- Advanced scheduling and dimming control.
- Tier 3 (Professional):
- Real-time monitoring of energy usage.
- Energy optimization recommendations.
- Tier 4 (Premium):
- Integration with building management systems.
- Predictive maintenance alerts.
- Tier 5 (Enterprise):
- Fully automated systems with AI-driven recommendations.
- Extended support for industrial clients.
- Tier 6 (Custom):
- Dedicated solutions tailored to large-scale projects.
- Includes all features plus on-site consultations.
Subscription KPIs
- MRR (Monthly Recurring Revenue):
- Measure subscription revenue consistency.
- ARR (Annual Recurring Revenue):
- MRR × 12.
- Churn Rate:
- Monitors the percentage of users discontinuing subscriptions.
- LTV (Lifetime Value):
- Customer lifetime × average subscription price.
- CAC (Customer Acquisition Cost):
- Marketing and sales expenses per new subscription.
6. Financial Dashboard and KPIs
Operational Metrics
- Production efficiency: % capacity utilization.
- Inventory turnover: How quickly inventory is sold and replaced.
Profitability Metrics
- Contribution margin by product line.
- Gross margin performance across scenarios (40- vs. 80-product lines).
Subscription Metrics
- Growth rate in tiered subscribers.
- Average subscription upgrade frequency.
These financial models capture a holistic view of a Lighting Equipment Manufacturer’s operations, offering tools to assess scalability, profitability, and sustainability. Let me know if you’d like additional customization, visual dashboards, or expanded forecasting features!
Similar ProductsOther customers were also interested in...



 eFinancialModels
Electric Vehicle (EV) Charging Station Financial M...
With this comprehensive 5- or 10-year monthly tool, investors can assess the viability of setting up... Read more

Financial Model for Mobile App | Mobile App Busine...
The Mobile App Financial Plan Template in Excel allows you to develop financial projections when lau... Read more

 HenrySheykin
Food Truck Financial Model Excel Template
The Food Truck Financial Model helps entrepreneurs, founders, business owners, consultants, and anal... Read more

Green Hydrogen Production from Wind Energy Financi...
The Green Hydrogen from Wind Financial Model aims to comprehensively forecast a horizon of 40 years ... Read more

Simple Mutual Non-Disclosure Agreement Template
Protect your business secrets with ease using our Simple Mutual Non-Disclosure Agreement Template. S... Read more

Solar Energy Financial Model
The Solar Energy Financial Model Spreadsheet Template in Excel assists you in preparing a sophistica... Read more

 Peter Graf
The Customer-Centric Financial Model for Restauran...
Starting a restaurant without a financial plan is like driving a car blindfolded. You wouldn´t do i... Read more
You must log in to submit a review.