
0 ITEMS

IRR With Negative Cash Flows: Formulas and Fixes

The eFinancialModels Editorial Team — financial modeling specialists with 10+ years building financial models for SaaS, real estate, and energy projects.
Key Takeaways
- Excel’s IRR function requires at least 1 negative and 1 positive cash flow — missing either condition returns a #NUM! error immediately.
- Supply a starting guess of 0.1 (10%) or -0.1 (-10%) as the optional third argument in IRR when the algorithm fails to converge on irregular cash flow patterns.
- Use XIRR with a FILTER function to strip zero-value periods:
=XIRR(FILTER(L17:BB17, L17:BB17<>0), FILTER($L$14:$BB$14, L17:BB17<>0))anchors each cash flow to a specific date for an annualized return. - MIRR eliminates the multiple-IRR problem by discounting negative cash flows at a financing rate and compounding positive cash flows at a reinvestment rate — two separate, realistic assumptions.
- Real estate IRR models should budget 5–10% vacancy, 5–10% of gross rent for maintenance, and 6–8% of sale price for selling costs to avoid overstating returns.
- Cash flows that change sign more than once can produce 2 or more mathematically valid IRR solutions — none of which may reflect true investment performance.
- When cash flow timing is irregular or sign changes occur more than once, MIRR or NPV is more reliable than standard IRR for decision-making.
When cash flows change sign more than once, a single IRR number can be misleading — MIRR and NPV provide more reliable decision metrics.
Why Negative Cash Flows Break Standard IRR Calculations
Standard IRR assumes a single sign change: one block of outflows followed by one block of inflows. When cash flows alternate between positive and negative across multiple periods, the math behind IRR breaks down in two distinct ways.
First, the NPV equation that IRR solves — setting the sum of discounted cash flows equal to zero — can produce multiple roots when the cash flow series changes sign more than once. Descartes’ Rule of Signs (a mathematical rule stating that the number of positive real roots of a polynomial equals the number of sign changes, or is less by an even number) means a cash flow series with 2 sign changes can yield 0, 1, or 2 valid IRR solutions. Second, Excel’s iterative algorithm may simply fail to converge, returning a #NUM! error even when a real solution exists.
The practical result: you can’t trust a single IRR number when your cash flow pattern is non-standard. You need to know which tool to reach for instead.

Descartes’ Rule of Signs: a cash flow series with 2 sign changes can produce 0, 1, or 2 valid IRR solutions.
Excel IRR Requirements: One Negative, One Positive
Excel’s IRR function will not calculate without at least one negative and one positive value in the input range. This is a hard requirement baked into the function’s design — supply a range of all-positive or all-negative values and Excel returns #NUM! immediately IRR function.
The syntax is =IRR(values, guess). The values argument must be an array or cell range containing at least one negative number (the initial investment) and one positive number (a return). The optional guess argument defaults to 0.1 if omitted.
Common #NUM! causes and fixes:
- All values positive: You forgot to enter the initial investment as a negative number. Fix: prefix the outflow cell with a minus sign.
- All values negative: The model shows no returns yet. Fix: extend the projection period or use NPV to value the terminal cash flow separately.
- Algorithm non-convergence: Irregular sign changes confuse the iterative solver. Fix: supply a starting guess (see next section).
- #VALUE! error: A non-numeric value (text, blank formatted as text) sits inside the range. Fix: audit the range with
=ISNUMBER()checks.

The #NUM! error is the most common IRR failure — it almost always means a sign convention error or a missing terminal value.
Solving IRR Convergence Failures With Starting Guesses
When IRR fails to converge on irregular or non-standard cash flow patterns, supplying a starting guess helps Excel’s iterative algorithm find a solution. The function uses Newton’s method (an iterative numerical technique that starts from an initial estimate and refines it until the result is accurate to within 0.00001%) to search for the rate that zeroes out NPV.
The syntax with a guess: =IRR(B2:B12, 0.1) for a 10% starting point, or =IRR(B2:B12, -0.1) when you suspect the IRR is negative. According to Simular (2024), supplying 0.1 or -0.1 as a starting guess helps Excel’s algorithm find a solution for non-converging irregular cash flows.
Practical approach: build a small sensitivity table that runs IRR with guesses from -0.5 to 0.5 in 0.1 increments. If multiple guesses return different IRR values, you have a multiple-IRR situation (covered below). If all guesses return the same value, you can trust that result.

Newton’s method converges in under 20 iterations for well-behaved cash flows — supply a starting guess when it doesn’t.
XIRR for Irregular Timing: Filtering Zeros and Anchoring Dates
XIRR (Extended IRR) solves two problems that standard IRR cannot: irregular payment intervals and periods with zero cash flow. XIRR anchors each cash flow to a specific calendar date and returns an annualized rate of return regardless of the spacing between periods.
The basic syntax is =XIRR(values, dates, guess). The values and dates arrays must be the same length, and the first value must be negative (the initial outflow).
The problem with zero-value periods: XIRR can misinterpret a zero as a meaningful data point and distort the annualized rate. The fix is to filter zeros out before passing data to XIRR. Adventures in CRE (2023) documents this exact formula for dynamic cash flow ranges:
“
=XIRR(FILTER(L17:BB17, L17:BB17<>0), FILTER($L$14:$BB$14, L17:BB17<>0))
This formula filters the cash flow row (L17:BB17) to exclude zeros, then filters the corresponding date row ($L$14:$BB$14) using the same condition, so each cash flow stays paired with its correct date. The <>0 condition means "not equal to zero" — a Boolean filter (a true/false test applied to each cell) that passes only non-zero entries.
Using XIRR instead of IRR allows you to anchor each irregular cash flow to specific dates and return an annualized rate of return, which is particularly important when negative and positive cash flows occur at uneven intervals (Simular, 2024).

*The FILTER wrapper ensures zero-value periods don't distort XIRR's annualized return — a critical fix for quarterly or monthly models.*
Modified IRR (MIRR): Separating Negative and Positive Cash Flows
MIRR is the preferred solution when standard IRR produces unreliable results due to negative cash flows or multiple sign changes. It separates negative and positive cash flows entirely, discounting the negatives at a financing rate (the cost of borrowing to fund those outflows) and compounding the positives at a reinvestment rate (the expected return on reinvested proceeds). According to Moonfare (2023), MIRR explicitly discounts the present value of negative cash flows at a financing rate (PVCF) and compounds the future value of positive cash flows at a reinvestment rate (FVCF) over n periods.
The Excel syntax is =MIRR(values, finance_rate, reinvest_rate).
**Worked Example:**
Assume a 5-year project with the following annual cash flows:
- Year 0: -$100,000 (initial investment)
- Year 1: -$20,000 (additional capital call)
- Year 2: $30,000
- Year 3: $50,000
- Year 4: $60,000
- Year 5: $80,000
Financing rate: 8% (cost of debt). Reinvestment rate: 10% (expected portfolio return).
Here's the math:
**Step 1 — Present value of negative cash flows at 8%:**
- PV of Year 0 outflow: $100,000 (already at t=0)
- PV of Year 1 outflow: $20,000 / 1.08 = $18,519
- Total PVCF = $118,519
**Step 2 — Future value of positive cash flows at 10% (compounded to Year 5):**
- Year 2: $30,000 × 1.10³ = $39,930
- Year 3: $50,000 × 1.10² = $60,500
- Year 4: $60,000 × 1.10¹ = $66,000
- Year 5: $80,000 × 1.10⁰ = $80,000
- Total FVCF = $246,430
**Step 3 — MIRR formula:**
MIRR = (FVCF / PVCF)^(1/n) - 1 = ($246,430 / $118,519)^(1/5) - 1 = 2.079^0.2 - 1 = **15.8%**
In Excel: =MIRR(B2:B7, 0.08, 0.10) returns the same 15.8%.
Compare this to the standard IRR on the same cash flows, which would return approximately 18.2% — overstating performance because it assumes all reinvestment happens at 18.2%, an unrealistic assumption.
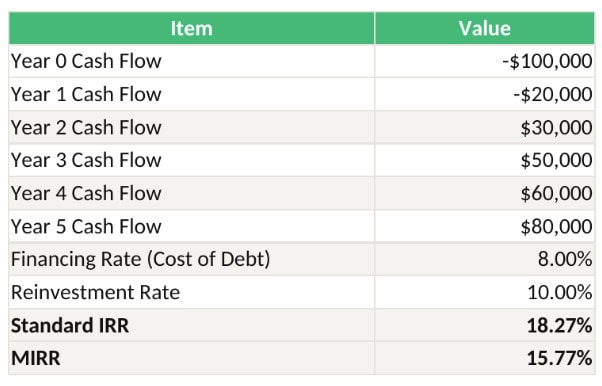
*MIRR = (FV of positive flows at 10% / PV of negative flows at 8%)^(1/5) - 1 = 15.8%, versus standard IRR of 18.2% on the same cash flows.*

*MIRR's two-rate structure produces a single, unique return figure — eliminating the ambiguity of multiple IRR solutions.*
Real Estate IRR Models: Vacancy, Maintenance, and Terminal Cash Flows
Real estate investments are the most common source of recurring negative cash flows in IRR models, because operating costs and capital expenditures can exceed rental income in early years before a large terminal gain at sale.
Standard real estate IRR assumptions to build into your model:
- **Vacancy rate:** 5–10% of potential gross income, applied annually. Real estate investment guides often assume a 5–10% annual vacancy rate and set aside an additional 5–10% of gross rent for repairs, maintenance, and capital expenditures (PropertyScout360, 2023).
- **Maintenance and CapEx reserve:** 5–10% of gross rent per year, covering routine repairs and periodic capital items (roof, HVAC, appliances).
- **Annual appreciation:** 2–3% per year on the property value, compounded.
- **Selling costs:** 6–8% of the sale price at exit, covering agent commissions, transfer taxes, and closing costs. A conservative annual appreciation rate of 2–3% combined with selling costs of 6–8% of the sale price creates a large final positive cash flow following a series of negative operating and transaction cash flows (PropertyScout360, 2023).
This structure produces a cash flow pattern that looks like: large negative (purchase), small negatives or near-zeros (operating years), then a large positive (net sale proceeds). Standard IRR handles this pattern well because there is only one sign change. The problem arises when renovation costs or capital calls create additional negative periods mid-hold.
For a cash flow projection model that handles these real estate-specific inputs, use XIRR rather than IRR so that irregular renovation timing doesn't distort the annualized return.

*Real estate IRR models: budget 5–10% vacancy, 5–10% maintenance reserve, and 6–8% selling costs to avoid overstating returns.*
The Multiple IRR Problem: When Sign Changes Create Ambiguity
Every additional sign change in a cash flow series adds a potential extra IRR solution. A cash flow pattern of negative, positive, negative (for example, an R&D project that requires a mid-project capital infusion) can produce 2 mathematically valid IRR values — and neither may be the "right" answer for decision-making.
**Example of a multiple-IRR scenario:**
- Year 0: -$10,000
- Year 1: +$25,000
- Year 2: -$20,000
This 2-sign-change series can produce IRR solutions near both 25% and 400%. Both satisfy the NPV = 0 condition mathematically. Neither tells you whether the project creates value.
How to identify the problem: plot NPV across a range of discount rates (say, 0% to 100% in 5% steps). If the NPV curve crosses zero more than once, you have multiple IRRs. Excel's IRR function will return whichever root its algorithm finds first from your starting guess — which may not be the economically meaningful one.
The fix: switch to NPV analysis with your actual cost of capital, or use MIRR, which always produces a single unique result by construction. For IRR modeling with multiple projects, building an NPV profile chart alongside MIRR is best practice.

*A 3-period negative-positive-negative pattern can yield IRR solutions at both 25% and 400% — both mathematically valid, neither reliably useful.*
Decision Framework: IRR vs XIRR vs MIRR vs NPV
Choosing the right metric depends on your cash flow pattern. Use this table to match the method to the situation:
| Scenario | Best Method | Why |
|---|---|---|
| Regular annual periods, single sign change | IRR | Simple, widely understood, no timing complexity |
| Irregular dates, single sign change | XIRR | Anchors flows to actual dates for true annualized return |
| Multiple sign changes or reinvestment assumption matters | MIRR | Eliminates multiple-IRR problem, uses realistic rates |
| Comparing mutually exclusive projects of different scale | NPV | IRR ignores project size; NPV shows absolute value created |
| Zero cash flow periods in the series | XIRR with FILTER | Strips zeros before calculation to avoid distortion |
| Negative initial cash flow is uncertain | MIRR or NPV | IRR is highly sensitive to the magnitude of the initial outflow |
For investor cash flow analysis across multiple scenarios, build all four metrics into your model and use MIRR as the primary decision metric when any of the non-standard conditions above apply.

*Match the method to the cash flow pattern — using standard IRR on irregular or multi-sign-change flows is the single most common modeling error.*
Step-by-Step Troubleshooting for Negative Cash Flow IRR Errors
When your IRR formula returns an error or a suspicious result, work through this checklist in order.
**Step 1: Confirm sign convention.** Your initial investment must be negative. Check: does cell B2 (or your first cash flow) show a negative number? If not, multiply by -1.
**Step 2: Check for at least one positive value.** Scan the range. If all values are negative, IRR cannot compute. Add the terminal value or extend the projection.
**Step 3: Count sign changes.** Use =SUMPRODUCT((SIGN(B3:B12)<>SIGN(B2:B11))*1) to count how many times the sign flips. If the result is greater than 1, expect multiple IRRs.
**Step 4: Try a starting guess.** Change =IRR(B2:B12) to =IRR(B2:B12, 0.1). If still #NUM!, try 0.05, 0.15, -0.1 in sequence.
**Step 5: Check for non-numeric values.** Use =SUMPRODUCT((ISNUMBER(B2:B12))*1) — the result should equal the count of cells in your range. Any shortfall means a text or error value is hiding in the range.
**Step 6: Switch to XIRR if timing is irregular.** Replace =IRR(B2:B12) with =XIRR(B2:B12, A2:A12) where column A holds dates. Add the FILTER wrapper if zeros are present.
**Step 7: Switch to MIRR if multiple IRRs are confirmed.** Use =MIRR(B2:B12, finance_rate, reinvest_rate) with your actual cost of debt and expected reinvestment return.
**Step 8: Validate with NPV.** Plug your computed IRR back into =NPV(IRR_result, B3:B12)+B2. The result should be within $1 of zero. If it's not, the IRR is wrong.
For a structured cash flow analysis template that automates steps 1 through 8, use a pre-built model with error-checking logic rather than building from scratch.
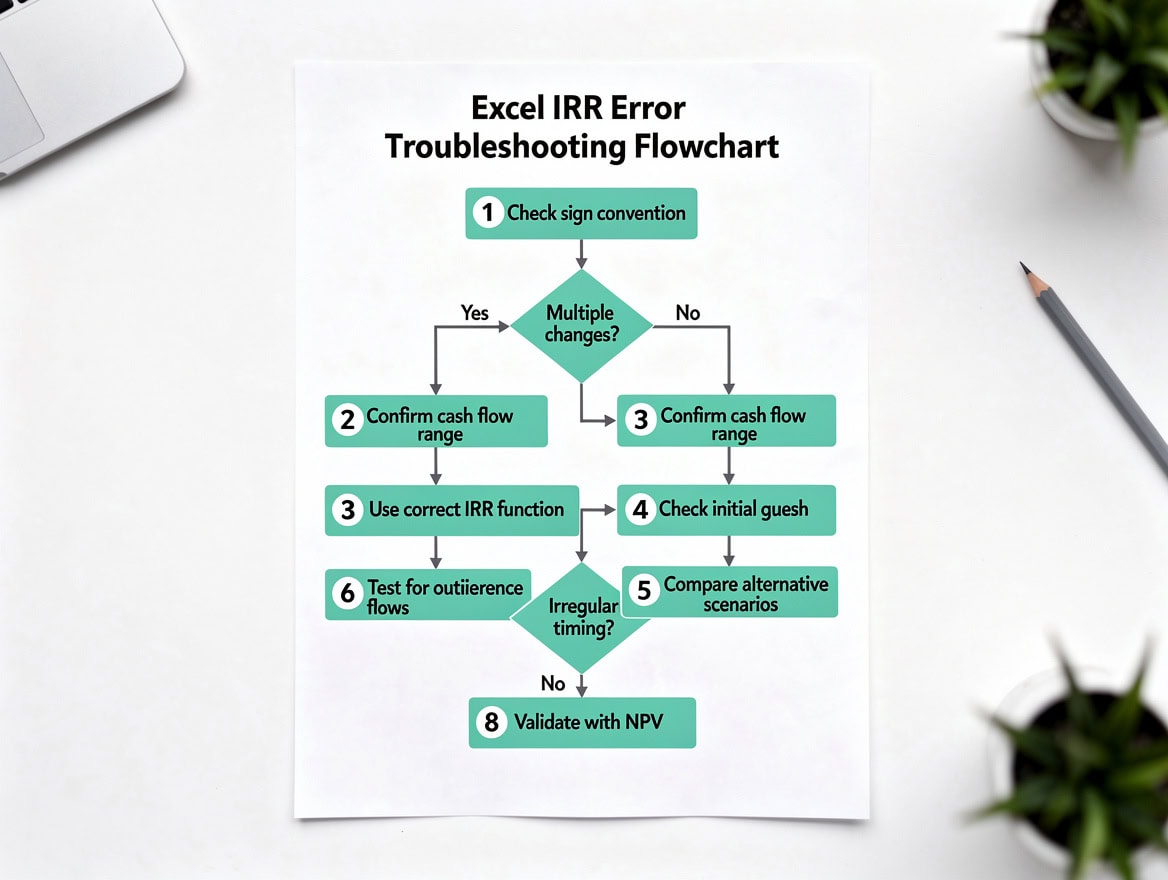
*Work through all 8 steps before concluding IRR is unsolvable — most #NUM! errors resolve at step 1 or step 4.*
Frequently Asked Questions
Can IRR be calculated when all cash flows are negative?
No. Excel's IRR function requires at least one positive and one negative value in the input range. If every period shows a cash outflow, the function returns a #NUM! error because there is no discount rate that can set NPV to zero when all flows are negative. The practical fix is to include the terminal value of the investment (the expected sale price or residual value) as a positive cash flow in the final period. If no positive terminal value exists, the investment destroys value by definition, and NPV at your cost of capital will confirm that with a negative dollar figure.
What is the difference between IRR and MIRR in plain terms?
Standard IRR assumes that every positive cash flow you receive gets reinvested at the IRR itself — which is often unrealistically high. MIRR (Modified Internal Rate of Return) fixes this by letting you specify two separate rates: a financing rate for the cost of funding negative cash flows (typically your cost of debt, say 7–8%) and a reinvestment rate for positive cash flows (typically your portfolio's expected return, say 10%). The result is a single, unique return figure that reflects realistic assumptions. For a project with an IRR of 25%, the MIRR using 8% financing and 10% reinvestment will typically be 12–18%, a more conservative and defensible number.
Why does Excel's IRR return a different answer depending on my starting guess?
Excel's IRR uses an iterative algorithm (Newton's method) that starts from your guess and works toward the nearest root of the NPV equation. When a cash flow series has multiple sign changes, the NPV curve crosses zero more than once, meaning multiple mathematically valid IRR solutions exist. The algorithm finds whichever root is closest to your starting guess. If you enter 0.1 and get 22%, but entering 0.5 returns 180%, you have a multiple-IRR problem. The solution is to plot NPV across a range of discount rates to see all crossing points, then use MIRR or NPV for the actual decision.
How do I handle zero cash flow periods in XIRR?
XIRR can misinterpret zero-value periods as meaningful data points, distorting the annualized return calculation. The correct approach is to filter zeros out before passing data to XIRR. Use the formula =XIRR(FILTER(L17:BB17, L17:BB17<>0), FILTER($L$14:$BB$14, L17:BB17<>0)) where L17:BB17 is your cash flow row and L14:BB14 is your date row. The FILTER function (available in Excel 365 and Excel 2019+) passes only non-zero cash flows and their corresponding dates to XIRR, ensuring each flow is correctly paired with its actual date. This approach is documented by Adventures in CRE (2023) for dynamic CRE cash flow models.
What vacancy and cost assumptions should I use in a real estate IRR model?
Conservative real estate IRR models typically assume a 5–10% annual vacancy rate applied to potential gross income, plus a maintenance and capital expenditure reserve of 5–10% of gross rent per year. At exit, selling costs of 6–8% of the sale price (covering agent commissions, transfer taxes, and closing costs) reduce the terminal cash flow. Annual property appreciation of 2–3% is a standard conservative assumption for underwriting. These inputs, documented by PropertyScout360 (2023), create a realistic cash flow pattern: recurring small negatives or near-breakeven operating years followed by a large positive net sale proceeds figure in the terminal year.
When should I use NPV instead of IRR for investment decisions?
Use NPV instead of IRR in three situations: when comparing mutually exclusive projects of different sizes (IRR ignores scale, so a 30% IRR on a $100,000 project beats a 20% IRR on a $10M project by IRR logic but not by value created), when cash flows change sign more than once (multiple IRRs make the result uninterpretable), and when the reinvestment rate assumption embedded in IRR is unrealistic for your context. NPV at your actual cost of capital tells you the dollar value added by the investment in today's terms — a more direct answer to the question "does this create value?" than a percentage rate.
What Excel error messages indicate an IRR calculation problem?
Two errors appear most often. The #NUM! error means either the input range contains no negative value, no positive value, or the algorithm failed to converge after 20 iterations. Fix #NUM! by checking sign convention, extending the projection period, or supplying a starting guess. The #VALUE! error means a non-numeric value (text, a blank cell formatted as text, or an error from an upstream formula) sits inside the cash flow range. Fix #VALUE! by using =ISNUMBER() to audit each cell in the range and replacing any non-numeric entries. A third issue — a result that looks plausible but is wrong — occurs silently when multiple IRRs exist; always validate by plugging the result back into =NPV(result, flows)+initial_investment` and confirming the output is near zero.
Conclusion
Negative cash flows don’t make IRR impossible — they make the choice of method critical. Standard IRR works when your cash flow series has a single sign change and regular annual periods. XIRR handles irregular timing and zero-value gaps. MIRR is the right tool when reinvestment assumptions matter or when multiple sign changes create ambiguity. NPV anchors every decision in dollar value rather than percentage rates.
I recommend downloading the IRR modeling template from eFinancialModels, which includes pre-built XIRR and MIRR functions, an NPV profile chart for spotting multiple IRRs, and real estate and project finance scenarios with the vacancy, maintenance, and selling cost assumptions already wired in. It will cut your model-build time and eliminate the most common calculation errors covered in this guide.
























































