
0 ITEMS

Financial Modeling for Founders: Build Models That Survive

Key Takeaways
- Cash flow problems contribute to 82% of small business failures (SCORE/U.S. Bank), making forward-looking financial models a survival tool, not a reporting formality.
- Only 40% of small businesses are profitable at any given time (SCORE/U.S. Bank); a working financial model is the clearest path from the 30% losing money to the 40% making it.
- Your minimum viable financial model has three components: a revenue projection, a cash runway calculator, and a unit economics breakdown (CAC, LTV, contribution margin).
- Build projections at monthly granularity for the first 18 months, then quarterly for years 2 and 3. Investors expect this cadence at seed stage.
- Scenario planning with base, best, and worst cases is not optional for fundraising: only 48% of small employer firms report sufficient financing (Federal Reserve), so your model must justify the raise amount.
- The 6 most common founder modeling mistakes that red-flag investors include hockey-stick projections without unit economics support, ignoring cash vs. accrual timing, and unrealistic gross margin assumptions.
- A founder-friendly Excel template with three-statement integration and scenario tabs saves 20 to 40 hours of build time and reduces structural errors that kill investor confidence.

A financial model is the operational dashboard that converts surprises into decisions — before reality forces them.
Why Financial Models Are Survival Tools, Not Spreadsheet Exercises
A financial model is a structured forecast of your business’s revenues, costs, and cash position, built so you can make decisions before reality forces them on you. Cash flow problems contribute to 82% of small business failures (SCORE/U.S. Bank), and the founders who survive are almost always the ones who saw the problem coming 90 days out, not 9 days out.
About 20% of new employer businesses fail within the first year, and about 50% fail within five years (U.S. Bureau of Labor Statistics). Those numbers are not inevitable. They reflect founders who ran out of cash before they ran out of ideas. A financial model does not guarantee success, but it converts surprises into decisions.
High-growth young firms aged 0 to 5 years account for about 15% of all U.S. firms but generate nearly 40% of net new jobs (U.S. Census Bureau). If you are building one of those firms, your model is the operational dashboard that tells you when to hire, when to cut, and when to raise.
Internal link: EFM startup financial model template

The three-component minimum viable model answers the questions every investor asks first: How do you grow? How long can you last? Does the unit economics work?
The Minimum Viable Financial Model: Three Components Every Founder Needs
Before you build a full three-statement model, you need three working components: a revenue projection, a cash runway calculator, and a unit economics breakdown. These three outputs answer the questions every investor and every board member will ask first.
Component 1: Revenue Projection
A revenue projection (a forward-looking estimate of income, built from assumptions about customers, pricing, and conversion rates) should be built bottom-up, not top-down. Top-down projections that start with “the market is $10 billion and we capture 1%” are a red flag to experienced investors. Bottom-up means you start with the number of sales conversations, multiply by your close rate, multiply by average contract value, and sum across months.
Formula:
“
Monthly Revenue = New Customers × Average Contract Value
New Customers = Sales Qualified Leads × Close Rate
For a SaaS business with 200 monthly leads, a 10% close rate, and a $500/month average contract value:
- New customers per month: 200 × 10% = 20
- New MRR added: 20 × $500 = $10,000
- Total MRR = prior month MRR + new MRR - churned MRR
Component 2: Cash Runway Calculator
Cash runway is the number of months your business can operate before it runs out of cash, given current burn rate. Burn rate (the net cash your business consumes each month) is the single most important number a pre-revenue or early-revenue founder tracks.
**Formula:**
`
Months of Runway = Cash Balance / Monthly Net Burn Rate
Net Burn Rate = Total Cash Out - Total Cash In
If you have $600,000 in the bank and your net burn is $75,000 per month, you have 8 months of runway. That is not a comfortable number. Most investors want to see 18 months post-raise.
Component 3: Unit Economics
Unit economics (the revenue and cost associated with a single customer or transaction) tell you whether your business model works at scale before you scale it. The three metrics that matter most are CAC, LTV, and contribution margin.
- **CAC (Customer Acquisition Cost):** Total sales and marketing spend divided by new customers acquired in the same period. If you spent $20,000 in March and acquired 40 customers, CAC = $500.
- **LTV (Lifetime Value):** Average revenue per customer divided by monthly churn rate. For a $500/month SaaS product with 3% monthly churn: LTV = $500 / 0.03 = $16,667.
- **LTV:CAC Ratio:** $16,667 / $500 = 33x. Investors at seed stage typically want to see LTV:CAC above 3x; Series A investors expect 5x or higher with a CAC payback period under 18 months.
- **Contribution Margin:** Revenue minus variable costs, expressed as a percentage. A SaaS business with $500 revenue and $50 in variable hosting and support costs has a 90% contribution margin. E-commerce typically runs 20 to 40%.
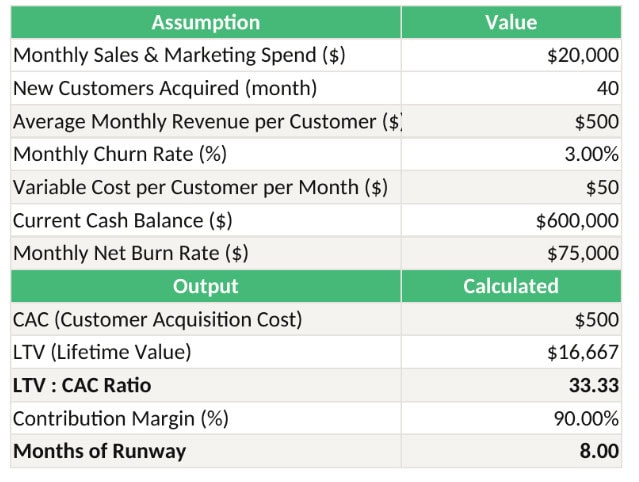
*Unit economics calculator: LTV:CAC of 33x and 8 months runway based on $600K cash balance and $75K monthly burn. Adjust the assumption cells (B2:B10) to model your own business.*
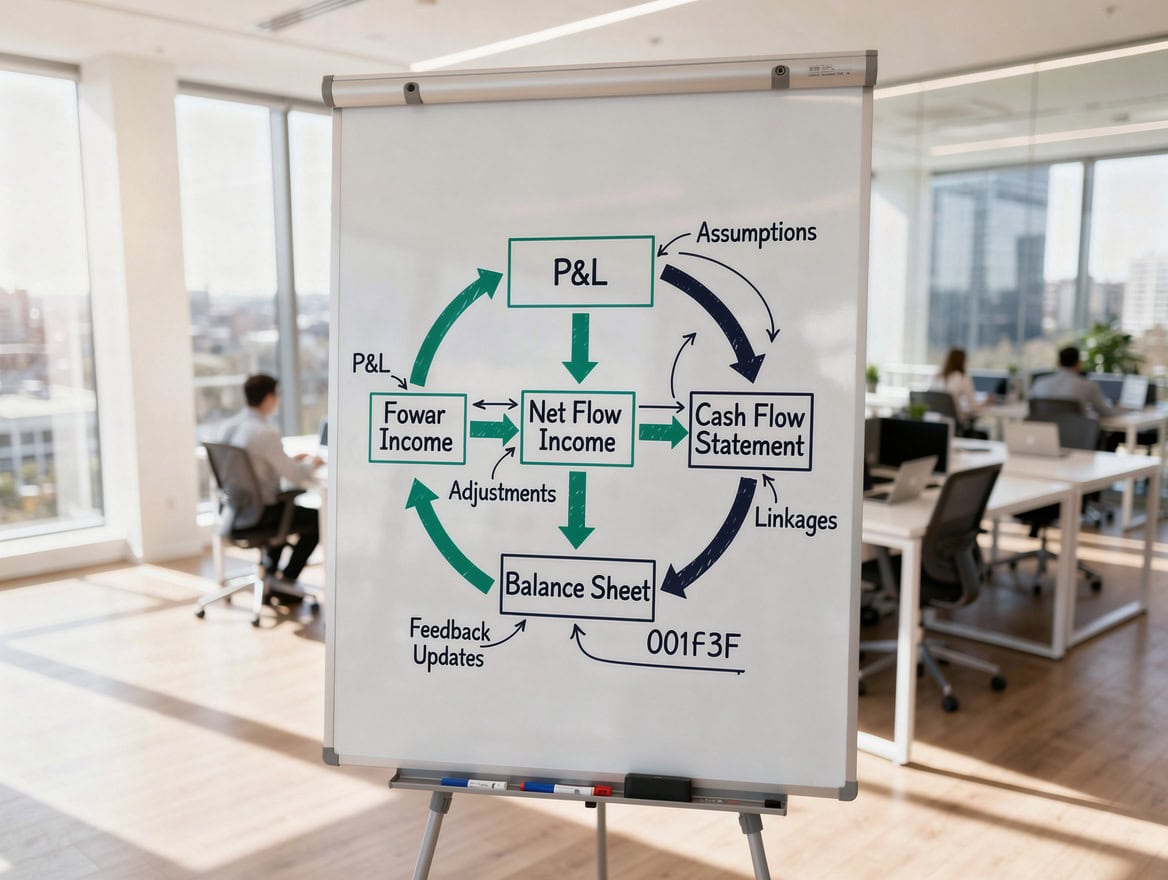
*In a properly linked three-statement model, a change in revenue flows through the P&L, into operating cash flow, and updates the ending cash balance automatically.*
Building Your Three-Statement Model for Startups
A three-statement model links your Profit and Loss statement (P&L), Balance Sheet, and Cash Flow Statement so that a change in one automatically flows through the others. For startups, the cash flow statement is the most critical output because it shows actual cash timing, not just accounting profit.
The P&L (Income Statement)
The P&L records revenues and expenses on an accrual basis, meaning you record revenue when it is earned, not when cash arrives. For a SaaS startup with annual contracts, you might invoice $12,000 upfront but recognize $1,000 per month. The P&L shows $1,000/month in revenue; the cash flow statement shows the $12,000 cash receipt in month one.
Key P&L line items for early-stage startups:
- Gross Revenue
- Cost of Goods Sold (COGS): hosting, payment processing, customer success salaries directly tied to delivery
- Gross Profit = Revenue - COGS
- Gross Margin % = Gross Profit / Revenue
- Operating Expenses: sales, marketing, R&D, G&A
- EBITDA (Earnings Before Interest, Taxes, Depreciation, and Amortization): a proxy for operating cash generation
- Net Loss (most pre-Series B startups run at a net loss)
The Balance Sheet
The balance sheet is a snapshot of what your company owns (assets), owes (liabilities), and the residual claim of shareholders (equity) at a point in time. For founders, the most important balance sheet mechanics involve equity raises and convertible instruments.
When you raise a $500,000 seed round:
- Cash (asset) increases by $500,000
- Paid-in Capital (equity) increases by $500,000
When you issue a $200,000 SAFE (Simple Agreement for Future Equity, a convertible instrument that converts to equity at a future priced round):
- Cash increases by $200,000
- SAFE liability (or temporary equity, depending on accounting treatment) increases by $200,000
- At conversion, the SAFE liability moves to equity
The Cash Flow Statement
The cash flow statement reconciles net income to actual cash movement across three categories: operating activities, investing activities, and financing activities. For startups, financing activities (equity raises, debt draws) often dominate in early months.
**Key formula:**
`
Ending Cash = Beginning Cash + Operating Cash Flow + Investing Cash Flow + Financing Cash Flow
Build your cash flow statement monthly for the first 18 months. Quarterly is acceptable for years 2 and 3.
Internal link: EFM three-statement financial model template
Scenario Planning for Fundraising: Base, Best, and Worst Case
Scenario planning means building three versions of your model with different assumption sets, so investors can see how your business performs under different conditions. Only 48% of small employer firms report having sufficient financing in place (Federal Reserve), which means your model must make a compelling case for both the amount you are raising and the timing.
| Scenario | Revenue Growth (MoM) | Gross Margin | Burn Rate | Runway Post-Raise |
|---|---|---|---|---|
| Worst Case | 5% | 55% | $90,000 | 14 months |
| Base Case | 12% | 65% | $75,000 | 18 months |
| Best Case | 20% | 72% | $60,000 | 24 months |
Document every assumption in a separate tab. Investors do not just read your outputs; they stress-test your inputs. If your base case assumes a 10% monthly close rate, be ready to show the historical data or comparable benchmarks that support it.
Sensitivity analysis (a technique that shows how your key output, such as runway, changes when you vary a single input) is the most powerful tool in a fundraising model. Build a sensitivity table showing months of runway across a range of burn rates and revenue growth rates. A 2×2 sensitivity table takes 30 minutes to build and answers the question investors ask most: “What happens if growth is slower than expected?”

A sensitivity table built in 30 minutes answers the investor question founders dread most: what happens if growth is slower than expected?
Using Your Model for Monthly Operational Decisions
A financial model only earns its keep if you use it every month, not just before fundraising. The monthly cadence that works for most seed-stage founders is: update actuals, reforecast the next 12 months, identify the top 3 variances, and make one operational decision based on the output.
Practical decisions your model should drive:
- Hiring timing: If your model shows runway dropping below 9 months in month 6, you cannot afford to hire a $120,000 engineer in month 3. The model tells you this before you make the offer.
- Marketing spend: If CAC is rising and LTV is flat, increasing marketing spend accelerates cash burn without improving unit economics. Cut or reallocate before the trend compounds.
- Runway extension: If you are 6 months from a raise and your model shows you hitting the raise with 4 months of runway remaining, you need to either cut burn or accelerate the timeline. The model gives you 6 months to act; gut feel gives you 4 days.
86% of small employer firms use the owner’s personal credit score in financing applications (Federal Reserve). This means your personal financial position is entangled with your business model. Build a personal runway assumption into your model: how long can you sustain reduced or zero salary before personal financial pressure forces a bad business decision?
Internal link: EFM cash flow forecasting template
Common Modeling Mistakes That Red-Flag Inexperienced Founders
Investors who review hundreds of models per year recognize inexperience within 5 minutes. These are the 6 mistakes that signal it most clearly.
- Hockey-stick projections without unit economics support. If your model shows 300% revenue growth in year 2 but your CAC payback period is 24 months and churn is 8% monthly, the math does not work. Growth projections must be anchored to unit economics.
- Ignoring cash vs. accrual timing. Recording revenue when invoiced rather than when cash arrives overstates your cash position. A $120,000 annual contract invoiced in January does not give you $120,000 in January cash if your customer pays net-60.
- Unrealistic gross margin assumptions for stage. Early-stage SaaS companies often model 80%+ gross margins before they have the infrastructure to support them. Seed-stage SaaS gross margins typically run 60 to 70%; marketplace businesses run 40 to 60%; e-commerce runs 20 to 40%. Benchmark your assumptions.
- Hardcoding numbers instead of using assumption cells. If your revenue growth rate is buried in 47 different cells rather than in one assumption cell that feeds the model, you cannot run scenarios and investors cannot stress-test your inputs.
- Forgetting working capital. Working capital (the cash tied up in receivables, inventory, and prepaid expenses minus payables) can consume significant cash even in a growing business. A marketplace that grows 50% in a quarter may consume $200,000 in working capital before it collects a dollar.
- Modeling equity raises as revenue. Equity proceeds are a financing cash inflow, not revenue. Mixing them inflates your P&L and signals a fundamental misunderstanding of financial statements.
Tools, Templates, and Appropriate Sophistication by Stage
The right tool depends on your stage, not your ambition. Over-engineering a model at pre-seed wastes time you should spend on customers.
| Stage | Recommended Tool | Model Complexity | Key Outputs |
|---|---|---|---|
| Pre-seed / Idea | Google Sheets or Excel | 12-month cash flow + unit economics | Runway, CAC, LTV |
| Seed | Excel with structured tabs | 18-month three-statement model + scenarios | Burn multiple, gross margin, MoM growth |
| Series A | Excel or Anaplan/Mosaic | 3-year three-statement + cohort analysis | ARR bridge, NRR, CAC payback, Rule of 40 |
Excel remains the standard for seed-stage models because investors can open, audit, and modify it without a software subscription. Dedicated FP&A platforms like Mosaic, Runway, or Causal add value at Series A when you have enough historical data to make driver-based forecasting worthwhile.
Structure your Excel model with three tab types: an Assumptions tab (every input lives here, nothing else), Calculation tabs (formulas only, no hardcoded numbers), and Output tabs (charts and summary tables for investor presentations). This structure lets investors audit your logic without reverse-engineering your formulas.
Internal link: EFM scenario analysis and sensitivity testing template
Integrating Financial Models into Your Fundraising Process
Your financial model serves two different purposes in fundraising: the pitch deck summary and the data room detail. Conflating them is a common mistake.
In 2023, venture capital funding to U.S. startups totaled approximately $170.6 billion across 15,766 deals (NVCA/PitchBook). That is a competitive market. Investors see dozens of models per week. Yours needs to communicate clearly at two levels of depth.
Pitch deck (2 to 3 slides): Show your 3-year revenue trajectory, gross margin progression, and the raise amount with use of funds. Do not paste your full model into slides. Use a summary chart and a simple table.
Data room (full model): Provide the complete Excel file with your assumptions tab visible, a scenario comparison tab, and a monthly cash flow for 18 months. Include a one-page assumption documentation sheet that explains the source or rationale for every major input.
Determining your raise amount: Your model should tell you how much to raise. The formula is: (Monthly Burn Rate × Target Runway in Months) + Capital for Growth Initiatives. If your burn is $75,000/month and you want 18 months of runway plus $300,000 for a product build, raise $75,000 × 18 + $300,000 = $1,650,000. Round up for dilution buffer.
Investors will ask: “What are your key assumptions?” “What does the model look like if growth is 50% slower?” “When do you hit cash-flow breakeven?” Your model should answer all three in under 60 seconds.
Frequently Asked Questions
How detailed does a financial model need to be for a seed-stage raise?
For a seed-stage raise, your model needs to cover 18 months of monthly cash flow, a three-statement structure (P&L, balance sheet, cash flow), and at least three scenarios (base, best, worst). Investors at seed stage are not expecting a 500-row model with 12 revenue streams. They want to see that you understand your unit economics, know your burn rate, and have a credible path to the milestones the raise is funding. A clean 5-tab Excel model with a visible assumptions tab is more impressive than a complex model with hardcoded numbers buried in formulas. Aim for a model that a smart investor can audit in 20 minutes.
What is a burn multiple and why do investors care about it?
Burn multiple is net cash burned divided by net new ARR (Annual Recurring Revenue) added in the same period. It measures how efficiently you convert cash into growth. A burn multiple of 1.0x means you burned $1 to generate $1 of new ARR. Below 1.0x is exceptional; 1.0 to 1.5x is good; above 2.0x raises questions at Series A. For example, if you burned $300,000 in Q1 and added $150,000 in new ARR, your burn multiple is 2.0x. Investors use this metric because it normalizes burn rate against growth, making it comparable across companies of different sizes. David Sacks of Craft Ventures popularized this framework in 2020.
How do I model a convertible note or SAFE in my financial statements?
A SAFE (Simple Agreement for Future Equity) is a contractual right to receive equity at a future priced round, typically with a valuation cap and/or discount. On your balance sheet, record the SAFE proceeds as a liability (or in a separate mezzanine equity section, depending on your accountant’s guidance) when cash is received. Cash increases by the SAFE amount; the offsetting entry is a SAFE liability. When the SAFE converts at your Series A, debit the SAFE liability and credit paid-in capital. The P&L is not affected by the conversion. A convertible note works similarly but accrues interest, which you record as interest expense on the P&L and as accrued interest on the balance sheet each month.
What gross margin should I project for my SaaS startup?
Gross margin benchmarks vary by stage and business model. Early-stage SaaS companies (pre-$1M ARR) typically run 60 to 70% gross margins because customer success and onboarding costs are high relative to revenue. At $5M ARR and above, best-in-class SaaS companies achieve 75 to 85% gross margins as infrastructure costs scale more slowly than revenue. Marketplace businesses typically run 40 to 60% gross margins. E-commerce runs 20 to 40%. If your model projects 85% gross margins at seed stage without a clear explanation of why your cost structure supports that, investors will flag it. Use industry benchmarks from sources like OpenView’s SaaS Benchmarks report or Bessemer’s State of the Cloud to anchor your assumptions.
How often should I update my financial model once I have it built?
Update your model monthly, without exception. The monthly cadence should take 2 to 3 hours: enter actual results for the prior month, compare actuals to your forecast (this is called variance analysis, the process of explaining why actuals differed from the plan), reforecast the next 12 months based on updated assumptions, and identify the top 3 operational decisions the updated model suggests. Founders who update quarterly are always reacting to problems that a monthly update would have surfaced 60 days earlier. At Series A, most investors expect a monthly board package that includes a one-page financial summary derived from your model.
What is the difference between a top-down and bottom-up revenue projection?
A top-down projection starts with the total addressable market (TAM) and assumes you capture a percentage of it. For example: “The market is $5 billion and we will capture 2% in year 3, giving us $100M in revenue.” A bottom-up projection starts with your sales process: number of leads, close rate, average deal size, and customer retention. For example: “We run 50 outbound sequences per week, convert 8% to demos, close 20% of demos at $800 ACV, giving us 6.4 new customers per week.” Bottom-up projections are more credible because they are grounded in operational reality. Investors at seed and Series A almost universally prefer bottom-up models. Use top-down only to show that your bottom-up projections are consistent with a reasonable market share assumption.
How do I determine how much to raise in my seed round?
Your raise amount should be driven by your model, not by a round number or what you have heard other companies raise. The formula is: (Monthly Net Burn Rate × Target Runway) + Milestone Capital. Target runway post-raise should be 18 months minimum, 24 months ideally, to give you time to hit milestones and run a Series A process without desperation. If your burn is $60,000/month and you want 20 months of runway plus $200,000 for a key hire, raise $60,000 × 20 + $200,000 = $1,400,000. Add 10 to 15% as a buffer for slower-than-expected revenue ramp. The Federal Reserve reports that only 48% of small employer firms have sufficient financing (Federal Reserve), so raising slightly more than you think you need is almost always the right call.
Build the Model Before You Need It
The founders who survive are not the ones with the best product or the most connections. They are the ones who saw the cash cliff coming and made a decision 90 days before it arrived. A financial model built on honest assumptions, updated monthly, and stress-tested with scenarios is the closest thing to a survival advantage that a spreadsheet can provide.
Only 40% of small businesses are profitable at any given time (SCORE/U.S. Bank). The gap between the 30% losing money and the 40% making it is not luck. It is operational visibility, and that visibility starts with a model.
I recommend downloading the EFM Startup Financial Model Template, a founder-friendly Excel template with built-in unit economics calculators, three-statement integration, and scenario planning tabs used by 500+ funded companies. It gives you the structure in hours, not weeks, so you can spend your time on the assumptions that matter rather than the plumbing that does not.
























































