
0 ITEMS

Gourmet Food Store Financial Model Excel Template
The Gourmet Food Store Financial Model helps entrepreneurs, founders, business owners, consultants, and analysts turn a specialty food retail concept into a structured five-year financial forecast. Instead of building projections from a blank spreadsheet, users can work from a ready-to-use financial model template designed around the economics of a gourmet food store, including customer traffic, buyer conversion, product categories, tasting events, margins, staffing, startup investment, and ongoing operating expenses. It is built to support practical financial planning before launch, expansion, funding discussions, or internal decision-making. This template helps users estimate how a gourmet food store may perform under realistic assumptions. You can adjust revenue assumptions such as daily visitors, conversion rates, average order size, repeat customers, product mix, and sales growth, then review how those changes affect revenue, gross profit, cash flow, and profitability. The model is also useful for organizing startup costs, including store build-out, fixtures, refrigerated displays, shelving, POS systems, initial inventory, marketing, and working capital needs. By separating launch investments from recurring operating expenses, it gives users a clearer view of total funding requirements and early cash pressure. The Gourmet Food Store Financial Model also supports deeper business planning through payroll forecasting, cost of goods sold, expense planning, cash flow projections, profit and loss statements, balance sheet outputs, break-even analysis, and investor-oriented reporting. Users can test low, base, and high scenarios to understand how sensitive the business is to changes in customer volume, margins, staffing, or expense levels. This makes the template especially valuable for preparing business plans, loan applications, investor presentations, internal budgets, and operational targets. Designed for Microsoft Excel and Google Sheets, the template is fully editable and can be customized for a new gourmet grocery, specialty food shop, premium deli, artisan cheese store, imported food retailer, or high-end food retail concept. It helps users replace guesswork with a more organized financial planning process, giving them a clear way to evaluate whether the business can reach sustainable profitability, manage cash responsibly, and make better decisions before committing capital.


Financial Model Overview
The Gourmet Food Store Financial Model is a ready-to-use financial model template built for planning, launching, funding, and managing a specialty food retail business. It brings together the key assumptions needed to evaluate a gourmet food store, including customer traffic, conversion rates, product pricing, sales mix, cost of goods sold, payroll, operating expenses, startup costs, cash flow, profitability, and investor returns. The template is designed for entrepreneurs, founders, consultants, analysts, business owners, and anyone preparing a business plan, funding proposal, lender package, or internal budget for a high-end food shop.
By entering your own assumptions into editable fields, you can generate a structured five-year forecast that connects day-to-day operating drivers with financial statements and decision-ready outputs. For a gourmet food store, where margins, inventory, staffing, and customer demand can vary across product categories, this type of model is especially useful because it helps you understand not only how much revenue the business could generate, but also what level of sales is needed to cover costs, maintain liquidity, and build a path toward sustainable profitability.
All-in-One Dashboard
The all-in-one dashboard gives users a centralized view of the Gourmet Food Store Financial Model by combining core inputs and core outputs in one practical planning area. This section is useful because it reduces the need to search through multiple tabs when reviewing the most important assumptions and results. It may summarize inputs such as launch date, forecast period, customer traffic, conversion rates, average order size, pricing, cost assumptions, payroll, startup investment, and financing assumptions, while also displaying outputs such as revenue, gross profit, EBITDA, net income, cash balance, break-even timing, and return metrics.
For a gourmet food store, the dashboard helps connect retail activity with financial performance, making it easier to see whether visitor volume, repeat purchases, tasting events, and premium product sales can support rent, staffing, inventory, marketing, and other store expenses. It is particularly helpful for founders and business owners who want a quick operating summary, and for consultants or analysts who need to present a concise financial view to stakeholders. Because the dashboard is designed to be editable and presentation-friendly, it can support investor discussions, management reviews, and ongoing financial decision-making as assumptions change.
Low, Base, and High Scenario Analysis
The low, base, and high scenario analysis component helps users evaluate how the gourmet food store may perform under different business conditions. Instead of relying on a single forecast, this section allows users to adjust key assumptions and compare a conservative case, a realistic base case, and an optimistic growth case. Inputs may include daily store visitors, buyer conversion rate, average units per order, repeat customer behavior, revenue growth, product margins, event attendance, payroll levels, rent, marketing spend, and inventory costs. The outputs help show how changes in those assumptions affect revenue, profit, cash flow, funding needs, and the timing of break-even.
This is especially useful for a gourmet food store because customer demand can depend on location, local income levels, seasonality, tourism, promotions, and the strength of the store’s product selection. Scenario analysis helps users understand what happens if traffic is slower than expected, if conversion improves after marketing campaigns, or if tasting events become a meaningful revenue driver. For funding and planning, this section demonstrates risk awareness and helps users prepare realistic targets, contingency plans, and operating decisions before committing to inventory, staffing, or expansion.
Professional Charts and Visual Reports
The professional charts and visual reports component converts the financial forecast into easy-to-understand visuals that can be used for presentations, investor updates, lender discussions, and internal planning meetings. Rather than reviewing only spreadsheet rows and columns, users can interpret key financial trends through charts that may show revenue growth, expense behavior, profitability, cash balance, product category contribution, gross margin, EBITDA, net income, and payback progress over the forecast period.
For a gourmet food store, visual reporting is valuable because many business drivers are easier to explain when shown graphically, such as the relationship between store traffic and revenue, the growth of tasting events, the contribution of artisanal cheese or imported olive oil to total sales, or the improvement in margins as the store scales. This section helps users communicate their financial story clearly, especially to stakeholders who may not want to review detailed spreadsheet formulas. It also supports better decision-making by highlighting patterns, gaps, and milestones that may be missed in raw data. Clean charts can make a funding presentation more credible and can help the owner monitor whether the business is moving toward its planned revenue, cash flow, and profitability targets.
ROE Components and DuPont Analysis
The ROE components and DuPont analysis section helps users understand the drivers behind return on equity, not just the final return number. This component breaks down financial performance into meaningful parts such as profitability, asset efficiency, and leverage, helping users see whether returns are being driven by strong margins, effective use of assets, or financing structure. Inputs may come from the model’s income statement, balance sheet, equity assumptions, debt assumptions, net income, revenue, total assets, and shareholder equity. Outputs may include return on equity, net profit margin, asset turnover, equity multiplier, and related performance indicators.
For a gourmet food store, this analysis can be useful because the business may require meaningful upfront investment in build-out, refrigerated display cases, shelving, fixtures, inventory, and point-of-sale systems. A store may look profitable at the operating level but still generate weak investor returns if assets are underutilized or if margins are too thin. DuPont analysis helps founders and investors evaluate the quality of returns and identify the levers that matter most, such as improving gross margins, increasing sales per square foot, reducing idle inventory, or structuring financing more effectively. It gives the model a more professional investor-ready layer for assessing long-term financial performance.
Revenue Inputs and Assumptions
The revenue inputs and assumptions section is where users define the commercial engine of the Gourmet Food Store Financial Model. This component helps users forecast sales based on realistic business drivers rather than broad estimates. Inputs may include daily store visitors by day of the week, conversion rates, average units per order, average selling price, repeat customer assumptions, product category mix, tasting event attendance, pricing changes, and annual growth expectations.
For a gourmet food store, this section can reflect core revenue streams such as artisanal cheese, imported olive oil, rare spices, and tasting events, while remaining flexible enough to add or modify categories based on the specific concept. The outputs flow into the revenue forecast, gross profit calculations, cash flow projections, and profitability analysis. This component is useful because revenue in a specialty food shop depends not only on foot traffic but also on how effectively the store converts visitors into buyers, how frequently customers return, and which products they purchase. By documenting revenue assumptions clearly, users can test whether the planned store location, pricing strategy, merchandising, event programming, and customer experience can generate enough sales to support the overall business model.
Bank-Ready Financial Reports
The bank-ready financial reports component organizes the outputs of the Gourmet Food Store Financial Model into lender-friendly and stakeholder-ready financial statements. This section typically includes structured profit and loss projections, cash flow forecasts, balance sheet summaries, and supporting schedules that help explain how the business is expected to perform over time. Inputs from revenue, cost of goods sold, payroll, startup costs, financing, operating expenses, depreciation, working capital, and tax assumptions feed into these reports automatically.
For a gourmet food store seeking a loan, line of credit, investor funding, or landlord approval, clear financial reports are essential because they show whether the business can generate enough revenue and cash flow to meet obligations. The profit and loss statement helps assess margins and operating profitability, the cash flow forecast helps evaluate liquidity, and the balance sheet helps show the relationship between assets, liabilities, and equity. This component is useful for preparing funding documents because it gives stakeholders a professional view of the business case without requiring the user to build statements manually. It also supports internal budgeting by giving owners a structured way to compare forecasted performance against actual results once the store is operating.
Revenue Breakdown by Stream
The revenue breakdown by stream component provides a detailed view of how different product and service categories contribute to total sales. For a gourmet food store, this is critical because not all revenue is equal. Artisanal cheese, imported olive oil, rare spices, gift baskets, prepared specialty items, and tasting events may have different price points, customer demand patterns, inventory requirements, and profit margins. This section may use inputs such as category-level pricing, units sold, customer purchase behavior, sales mix percentages, growth rates, event frequency, and average attendance. The outputs help users see which categories drive the largest share of revenue, which ones contribute the most gross profit, and how changes in product mix affect overall profitability.
A store that sells more high-margin spices and tasting event tickets may perform differently from one that relies heavily on lower-margin imported goods. This component is useful for merchandising decisions, inventory planning, marketing priorities, and supplier negotiations. It can help users determine whether to focus on premium retail products, recurring customer baskets, events, corporate gifting, or specialty categories. By understanding revenue at a more granular level, owners can make better decisions about pricing, promotions, purchasing, and store layout.
KPI Dashboard and Performance Benchmarks
The KPI dashboard and performance benchmarks component helps users monitor the most important financial and operating metrics for a gourmet food store. This section may track key performance indicators such as revenue, gross margin, EBITDA margin, net profit margin, cash balance, average order value, conversion rate, repeat customer rate, sales per visitor, sales per employee, inventory-related metrics, payroll as a percentage of revenue, and operating expense ratios. It may also help compare assumptions or outputs against industry benchmarks so users can evaluate whether their forecast appears realistic. For a gourmet food store, benchmarking is valuable because premium food retail can be highly sensitive to product margins, shrinkage, staffing, and rent.
A forecast may look attractive until the user compares margin assumptions, labor costs, or customer conversion rates against reasonable retail standards. The KPI dashboard gives founders and managers a way to quickly identify whether the business is on track, whether costs are too high, or whether revenue assumptions need to be revised. It is also useful for investors and lenders because it translates the detailed forecast into clear performance indicators. By combining financial metrics with operational benchmarks, this component supports better planning, accountability, and ongoing decision-making.
Startup Costs and Capital Expenditure Planning
The startup costs and capital expenditure planning component helps users estimate the initial investment required to open or prepare the gourmet food store for operations. This section may include store build-out, fixtures, refrigerated display cases, custom shelving, racks, POS hardware, signage, initial technology setup, kitchen or prep equipment, licenses, deposits, pre-opening marketing, professional fees, opening inventory, and working capital. The outputs help calculate total launch funding needs and show how much cash is required before the store begins generating steady revenue.
This component is especially important for a gourmet food store because the physical retail environment plays a large role in customer experience and product presentation. Premium fixtures, refrigeration, merchandising displays, and branded interiors can require substantial upfront investment, and underestimating these costs can create cash pressure before the business reaches stable sales. By organizing startup costs separately from recurring expenses, the model helps users distinguish between one-time launch investments and monthly operating commitments. This is useful for budgeting, fundraising, lender conversations, and ownership planning. It also helps users evaluate whether to reduce initial scope, phase investments over time, negotiate supplier terms, or secure additional capital to protect liquidity during the early months of operation.
Break-Even Analysis and Payback Timing
The break-even analysis and payback timing component helps users understand when the gourmet food store may become financially sustainable and when the initial investment may be recovered. This section uses inputs from revenue projections, gross margins, fixed operating expenses, variable costs, payroll, startup costs, and financing assumptions to estimate the point at which the business covers its costs. Outputs may include break-even month, cumulative cash flow, required monthly sales, contribution margin, payback period, and the gap between current forecast performance and the level needed for profitability.
For a gourmet food store, this is useful because early-stage operations often involve high setup costs, growing customer awareness, inventory investment, and staffing expenses before revenue reaches maturity. Break-even analysis gives founders a clear milestone to manage toward and helps identify which levers can accelerate profitability, such as increasing conversion rates, improving average order value, prioritizing higher-margin products, growing tasting event revenue, or controlling packaging and supplier costs.
Similar ProductsOther customers were also interested in...


 HenrySheykin
Coffee Shop Financial Model Excel Template
The Coffee Shop Financial Model helps entrepreneurs, founders, business owners, consultants, and ana... Read more
Pizzeria Financial Model Excel Template
The Pizza Restaurant Financial Model Template helps entrepreneurs, restaurant owners, consultants, a... Read more
Coffee Truck Financial Model Excel Template
The Coffee Truck Financial Model Template helps entrepreneurs, founders, consultants, and business p... Read more
Confectionery Shop Financial Model Excel Template
The Confectionery Shop Financial Model helps turn a candy shop, sweet shop, dessert retail concept, ... Read more
 Pushkar
Pizzeria – 3 Statement Financial Model with ...
This Pizzeria business Plan Model is a perfect tool for a financial feasibility study on launching a... Read more
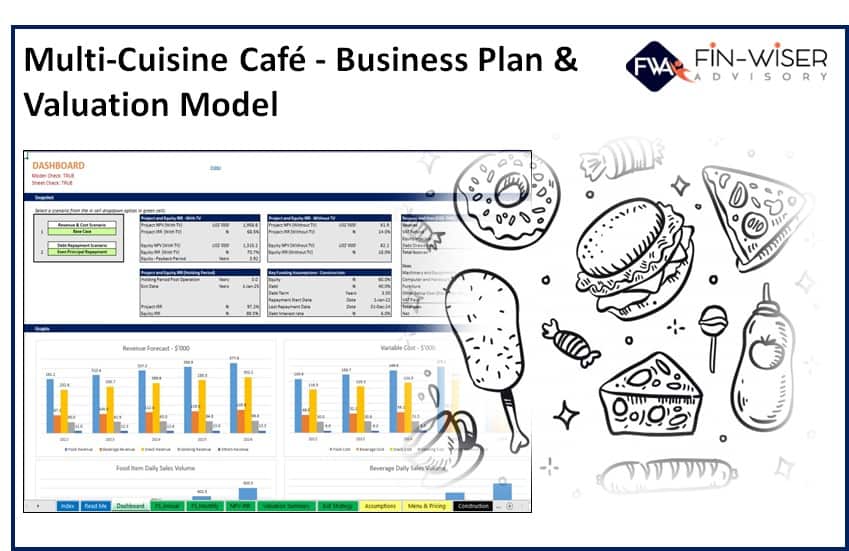
Multi Cuisine Cafe – 3 Statement Financial M...
This Multi-Cuisine Café business Plan Model is a perfect tool for a financial feasibility study on ... Read more
 anthony
Bundle – Business Financial Forecasting Mode...
The purpose of this Bundle of Business Forecasting and Financial Models is to assist Business Owners... Read more
 Peter Graf
Coffee Shop – The Customer-Centric Financial...
Starting a Coffee Shop without a financial plan is like driving a car blindfolded. You wouldn´t do ... Read more
 Andreas
Food Sector Bundle (6 Models)
Planning to start a food business but can’t decide on the profitability of your investment? Why do... Read more

 Excel Business Resou...
Fast Food Restaurant Financial Model Template
Maximize fast food financials with our user-friendly financial model template. Easily forecast sales... Read more
You must log in to submit a review.