
0 ITEMS

Theme Park Business Plan Financial Model Excel Template
The Theme Park Financial Model helps entrepreneurs, developers, operators, consultants, analysts, and founders turn a large-scale entertainment concept into a structured financial forecast. Instead of starting with a blank spreadsheet, users can work from a ready-to-use financial model template built around the realities of a theme park business, including admissions, visitor volume, in-park spending, operating expenses, capital requirements, payroll, cash flow, and profitability. It is designed to support business planning, feasibility analysis, funding preparation, internal budgeting, and strategic decision-making before launch or expansion. This template gives users a practical way to organize their assumptions and understand how the business may perform over time. Theme parks depend on multiple revenue drivers, from ticket sales and premium experiences to food, beverage, merchandise, parking, and resort-related income. The model helps connect those revenue assumptions with the cost structure required to operate the park, including staffing, maintenance, utilities, marketing, administrative costs, and other recurring expenses. By adjusting key inputs, users can evaluate whether attendance levels, pricing, and spending per visitor are strong enough to support the investment. The Theme Park Financial Model is especially useful for projects that require investor presentations, lender discussions, partner reviews, or formal business plan documents. It includes a professional structure for reviewing startup costs, capital expenditures, operating forecasts, cash flow movement, profitability, break-even analysis, and return metrics. This helps users communicate the financial story of the theme park in a clear and organized format while also testing whether the project can reach sustainable performance under realistic assumptions. Because the model is editable, it can be adapted for different types of parks, including amusement parks, resort-based attractions, themed entertainment destinations, water parks, family entertainment parks, or mixed-use leisure developments. Users can revise pricing, visitor growth, payroll, revenue streams, cost assumptions, funding needs, and performance targets to match their own strategy. Whether used by a founder preparing a pitch, a consultant building a feasibility study, a business owner planning expansion, or an analyst comparing investment scenarios, this template provides a time-saving framework for financial planning and better decision-making.
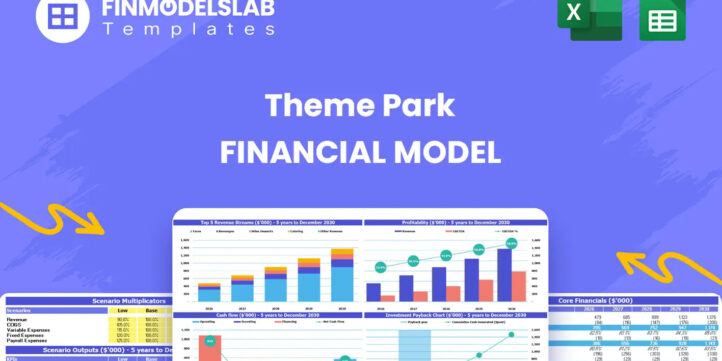


Financial Model Overview
The Theme Park Financial Model is a ready-to-use financial model template designed to help users evaluate the commercial potential, capital requirements, operating performance, and investment profile of a theme park business. Theme parks are complex projects with many moving parts, including admissions revenue, guest spending, staffing, ride operations, maintenance, construction costs, financing needs, and long-term profitability. This template brings those assumptions into one structured model so entrepreneurs, operators, consultants, analysts, developers, and business planners can build a more credible forecast without creating the entire framework from scratch. It is useful for preparing business plans, investor materials, lender discussions, feasibility studies, internal budgets, and expansion reviews. By adjusting editable assumptions, users can estimate revenue, costs, cash flow, returns, and break-even timing while maintaining a professional, organized model format suitable for decision-making and stakeholder communication.
All-in-One Dashboard
The all-in-one dashboard gives users a central view of the model’s most important inputs and outputs, making it easier to understand the overall financial position of the theme park at a glance. This component is designed to bring together core assumptions such as visitor volumes, pricing, revenue growth, operating costs, investment requirements, margins, and cash flow results in one practical summary area. Instead of moving through multiple tabs to find key figures, users can quickly review the assumptions driving the forecast and the resulting financial outcomes. For a theme park project, this is especially valuable because small changes in attendance, ticket pricing, food and beverage spending, or capital costs can materially affect profitability and funding needs. The dashboard helps users monitor the relationship between commercial assumptions and financial results, making it a useful tool for investor meetings, management reviews, funding presentations, and strategic planning sessions where decision-makers need a clear overview of the business case.
Low, Base, and High Scenario Analysis
The low, base, and high scenario analysis section helps users test how the theme park forecast changes under different operating and market conditions. A theme park business is sensitive to attendance levels, ticket prices, construction costs, discretionary spending, seasonality, and economic conditions, so a single forecast is rarely enough for serious planning. This component allows users to compare a conservative case, an expected case, and an upside case by adjusting key assumptions such as visitor demand, average ticket price, in-park spending, operating cost inflation, capital expenditure timing, or growth rates. The outputs help show how revenue, EBITDA, cash flow, funding needs, and returns may shift depending on performance. This is useful for risk management because it lets users identify downside exposure before committing capital. It also supports funding conversations by showing investors and lenders that the plan has been stress-tested, not just built around optimistic assumptions. For founders and operators, scenario analysis provides a practical way to plan for uncertainty and make better decisions around pricing, staffing, expansion, and financing.
Professional Charts
The professional charts section converts important financial outputs into clear visual reports that can be used for presentations, pitch decks, internal meetings, and stakeholder updates. Theme park financial models often contain a large amount of detailed data, including revenue by stream, operating expenses, profitability, cash flow, and return metrics. This component helps simplify that information by turning it into charts and graphs that are easier to understand and communicate. Users can review visual trends in revenue growth, expense behavior, EBITDA performance, cash flow movement, and other key metrics over the forecast period. These visuals are useful because decision-makers often need to grasp the direction of the business quickly, especially when reviewing funding needs or evaluating an investment proposal. The chart section can also help identify whether the project is scaling efficiently, whether margins are improving, and whether the financial plan supports the intended growth strategy. For consultants and founders preparing business plans, the professional chart outputs create a more polished and investor-ready financial presentation.
ROE Components and DuPont Analysis
The ROE components section uses DuPont-style analysis to help users understand the drivers behind return on equity and overall financial performance. In a capital-intensive theme park project, investor returns are influenced by more than net profit alone. They can also be affected by asset utilization, leverage, margin performance, capital structure, and the efficiency with which the park turns investment into earnings. This component breaks return on equity into its underlying drivers so users can see whether returns are being supported by strong profitability, efficient use of assets, financing structure, or a combination of these factors. Inputs and outputs may include net income, revenue, total assets, equity, profit margins, asset turnover, and leverage-related measures. This is useful for investors, analysts, and developers because it provides a deeper view of financial performance than a basic profit summary. It helps users assess whether the theme park business is generating returns in a healthy and sustainable way, and it can support more informed decisions around debt, equity funding, reinvestment, and expansion planning.
Revenue Inputs
The revenue inputs section gives users a structured place to define and edit the commercial assumptions that drive the theme park’s sales forecast. For a theme park, revenue is typically generated through multiple sources, including standard day tickets, multi-day tickets, resort guest admissions, food and beverage sales, merchandise, parking, premium experiences, and other guest services. This component allows users to input assumptions such as attendance volume, ticket mix, average ticket price, spending per guest, conversion rates, growth rates, and seasonal or annual changes. The model then uses these inputs to calculate projected revenue over the forecast period. This is useful because revenue planning for a theme park depends on both guest volume and guest behavior, not just a single price point. By separating and organizing the assumptions, users can test how different pricing strategies, visitor growth plans, and ancillary revenue opportunities affect total income. This section is especially important for feasibility studies, business plans, and investor discussions because it shows the logic behind the revenue forecast rather than presenting a single unsupported sales number.
Bank-Ready Reports
The bank-ready reports section provides lender-friendly financial outputs that help users present the theme park project in a professional and structured way. Banks and financing partners typically want to see more than a revenue forecast; they need a clear view of profitability, cash flow, debt capacity, funding requirements, repayment ability, and overall financial stability. This component helps organize key financial statements and summaries, including projected income statements, cash flow forecasts, balance sheet outputs, and supporting schedules where relevant. It can help users show how operating performance is expected to support ongoing expenses, debt service, reinvestment, and working capital needs. For a theme park, this is critical because upfront capital requirements can be significant, and lenders need confidence that the project can move from construction and launch into stable operations. Bank-ready reporting also saves time for founders, consultants, and analysts preparing loan packages, funding applications, or partner presentations by providing a clean format that aligns with the type of financial information external stakeholders expect to review.
Revenue Breakdown
The revenue breakdown section gives users a detailed view of each revenue stream within the theme park business, helping them understand where sales are expected to come from and how diversified the income base may be. Instead of treating revenue as one general figure, this component separates ticket sales, food and beverage, merchandise, premium experiences, parking, resort-related income, and other potential guest spending categories. It may use assumptions such as visitor count, ticket category mix, average spend per guest, participation rates, and annual growth to calculate revenue by stream. This is useful because theme park profitability often depends heavily on ancillary spending in addition to admissions. A detailed revenue breakdown allows users to identify which income categories contribute most to growth, which streams may have higher margins, and where strategic initiatives could improve performance. It also supports investor and management discussions by showing that the business plan is built on specific commercial drivers. For operators, this section can help guide pricing strategy, merchandising plans, food service capacity, premium offering design, and overall guest monetization strategy.
KPI Dashboard
The KPI dashboard tracks the performance metrics that matter most for evaluating a theme park business and comparing results against plan. Key performance indicators may include attendance, revenue per visitor, ticket revenue, ancillary spend per guest, EBITDA margin, operating expense ratios, cash balance, return metrics, and other financial or operational benchmarks. This component is useful because a theme park’s performance depends on both financial outcomes and operating drivers. Strong revenue growth may not be enough if costs rise too quickly, margins weaken, or cash flow becomes strained. The KPI dashboard helps users monitor the health of the business by summarizing the metrics that reveal whether the park is performing efficiently and sustainably. It can also support benchmark comparisons, investor updates, monthly reviews, and management decision-making. For users preparing a business plan or funding document, the KPI dashboard adds credibility by showing that the forecast is not just focused on top-line growth, but also on measurable operating performance, profitability, liquidity, and return potential.
Startup and Capital Expenditure Plan
The startup and capital expenditure plan helps users estimate the initial investment required to develop, launch, or expand the theme park. Theme parks typically require substantial upfront funding for land preparation, ride installation, themed zones, main entrance areas, infrastructure, technology systems, guest facilities, safety systems, resort components, deposits, pre-opening marketing, working capital, and professional fees. This component organizes those capital needs into a structured section so users can see the total funding requirement before operations begin. It may also help separate one-time startup costs from ongoing capital expenditures, which is important for cash flow planning and investor communication. A clear capital expenditure plan is valuable because underestimating startup costs can create financing gaps, construction delays, or operational constraints after launch. For lenders and investors, this section helps explain how funds will be used and why the requested capital is necessary. For founders and developers, it provides a practical budgeting framework to refine scope, phase investments, compare supplier quotes, and plan the timing of major cash outflows.
Break-Even Analysis
The break-even analysis section helps users determine when the theme park may generate enough revenue to cover its operating costs and begin producing profit. This component can use assumptions such as fixed costs, variable costs, ticket pricing, visitor volume, revenue per guest, contribution margins, payroll, maintenance, utilities, marketing, and other operating expenses to estimate the point at which the business reaches profitability. For a theme park, break-even analysis is especially important because the business often carries high fixed costs and a large upfront investment, making it essential to understand the level of attendance and guest spending needed to support operations. This section helps users evaluate whether their visitor forecast is realistic, whether pricing needs adjustment, and whether cost controls are sufficient. It is useful for funding documents because investors and lenders often want to know how quickly the business can move from launch to sustainable profitability. It also supports decision-making around marketing intensity, season pass strategy, premium experiences, staffing levels, and operational capacity planning.
File types:
Excel – Single-User: .xlsx
Excel – Multi-User: .xlsx
Similar ProductsOther customers were also interested in...

 HenrySheykin
Arcade Business Plan Financial Model Excel Templat...
The Arcade Financial Model helps users turn an arcade, game room, or family entertainment center con... Read more

Skate Park Business Plan Financial Model Excel Tem...
The Skate Park Financial Model helps entrepreneurs, founders, consultants, analysts, and business ow... Read more
Nightclub Financial Model Excel Template
The Nightclub Financial Model helps users turn a nightlife business concept into a structured financ... Read more
Online Clothing Store Financial Model Excel Templa...
The Online Clothing Store Financial Model helps founders, entrepreneurs, business owners, consultant... Read more
Waterpark Business Plan Financial Model Excel Temp...
The Water Park Financial Model helps entrepreneurs, founders, consultants, analysts, and business ow... Read more
Monthly Recurring Revenue SaaS Financial Model Exc...
The SaaS Business Financial Model helps founders, entrepreneurs, consultants, analysts, and business... Read more
E-com Simple Financial Model Excel Template
The E-Commerce Business Financial Model Template helps founders, online store owners, consultants, a... Read more
SaaS Actuals Opt-In Financial Model Excel Template
The SaaS Business Financial Model helps founders, entrepreneurs, consultants, analysts, and business... Read more
Casino Hotel Financial Model Excel Template
The Casino Hotel Financial Model helps users build a structured five-year forecast for an integrated... Read more
Call Center Financial Model Excel Template
The Call Center Financial Model helps users build a structured financial forecast for launching, man... Read more
You must log in to submit a review.