
0 ITEMS

Music School Financial Model Excel Template
The Music School Financial Model helps users turn a music education concept into a structured five-year financial forecast. Instead of starting with a blank spreadsheet, entrepreneurs and planners can work from a ready-to-use model designed around the realities of a music academy, private lesson studio, performing arts school, or group class business. The template helps estimate student enrollment, class capacity, tuition fees, workshops, summer camps, startup costs, operating expenses, payroll, cash flow, and profitability in one connected planning tool. This financial model template is useful for founders, business owners, consultants, analysts, private music teachers, and anyone preparing a business plan, loan application, investor presentation, or internal budget. It supports practical financial planning by linking revenue assumptions to the cost structure of the school, including instructor compensation, studio rent, teaching materials, payment processing, marketing, software, equipment, and other operating needs. Users can adjust assumptions to reflect their own pricing, student volume, class mix, growth expectations, and staffing plan. The model is built to support decision-making before launch, during expansion, or while reviewing the performance of an existing music school. It helps users evaluate whether lesson revenue can cover payroll and rent, how quickly the business may reach break-even, what cash reserves may be needed, and how different enrollment or pricing scenarios affect profit. With automated outputs, users can review projected income statements, cash flow, profitability trends, investment returns, and performance indicators without manually building formulas from scratch. Because the Music School Financial Model is editable and compatible with Excel and Google Sheets, it can be customized for different music education formats, from small private studios to larger academies offering group classes, private lessons, camps, and workshops. It gives users a professional structure for organizing assumptions, testing financial scenarios, presenting numbers to stakeholders, and making more confident planning decisions based on clear financial projections.
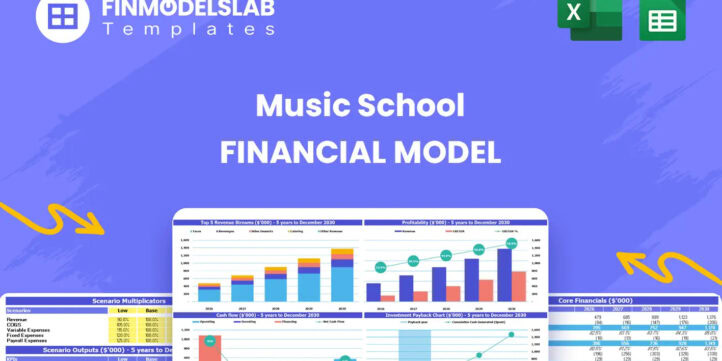


Music School Financial Model Overview
The Music School Financial Model is a ready-to-use financial model template designed to help entrepreneurs, music school owners, consultants, analysts, and business plan writers forecast the financial performance of a music education business. It brings together the major drivers of a music school, including student enrollment, class capacity, tuition pricing, workshops, instructor needs, studio rent, startup investment, operating costs, cash flow, profitability, and investor returns. For a music academy or private lesson studio, small changes in occupancy, class mix, payroll, and monthly fees can materially affect the business case, so the model gives users a structured way to see how those assumptions flow through the forecast. The template is useful for launching a new school, expanding an existing studio, preparing funding documents, comparing scenarios, or building an investor-ready business plan. It is editable, organized for practical use, and suitable for Excel or Google Sheets, helping users replace guesswork with a clear financial planning framework tailored to the music school business model.
All-in-One Dashboard
The all-in-one dashboard gives users a central place to review the most important inputs and outputs of the Music School Financial Model without jumping between multiple worksheets. This section typically brings together core assumptions such as student enrollment, occupancy rates, monthly tuition, revenue streams, startup investment, payroll, fixed expenses, variable costs, and funding assumptions, then summarizes the results through key financial metrics. The dashboard helps users quickly understand projected revenue, gross profit, EBITDA, net income, cash position, and other top-level indicators across the forecast period. For a music school, this is especially useful because the owner or founder needs to monitor whether lesson revenue is sufficient to cover instructor costs, studio rent, marketing, software, and equipment-related expenses. Instead of reviewing every detailed calculation manually, the dashboard provides a high-level control center for planning and decision-making. It can be used during internal budgeting sessions, business plan preparation, lender discussions, or investor meetings where stakeholders need to understand the financial picture quickly. Because the model is editable, users can adjust the assumptions behind the dashboard to reflect a small private studio, a larger academy with group classes, or a performing arts school with multiple programs. The dashboard is valuable because it connects operational decisions to financial outcomes, showing how enrollment, pricing, capacity, and expense choices influence the overall viability of the school.
Low, Base, and High Scenario Analysis
The Low, Base, and High scenario analysis section helps users test how the music school may perform under different business conditions. A base case can represent the most realistic forecast, while a low case may reflect slower enrollment growth, lower occupancy, reduced pricing power, higher marketing costs, or increased payroll pressure. A high case can show the impact of stronger student demand, faster class fill rates, higher tuition fees, better instructor utilization, or successful workshop and camp programs. This scenario structure is important because music school performance often depends on uncertain variables such as local demand, seasonality, competition, student retention, and the ability to fill group classes. By changing assumptions across scenarios, users can compare revenue, expenses, cash flow, profitability, and funding needs under different outcomes. This makes the model useful for risk assessment, funding preparation, and strategic planning. A lender or investor may want to see whether the school can remain solvent if enrollment is lower than expected, while a founder may want to understand what level of growth is needed to support hiring additional instructors or opening more rooms. The scenario analysis also supports practical decision-making by showing which assumptions have the greatest impact on results. For example, users can assess whether the business is more sensitive to occupancy rates, monthly tuition, instructor pay, rent, or marketing spend. This helps create a more resilient plan and encourages users to prepare for both downside risk and upside opportunity.
Professional Charts and Visual Reports
The professional charts and visual reports section converts the financial projections into presentation-ready visuals that make the forecast easier to understand and communicate. Instead of relying only on spreadsheet rows and columns, users can review charts for revenue growth, expense trends, cash balance, profitability, EBITDA, margins, and other performance measures. For a music school business plan, charts are useful because they help stakeholders see how the school is expected to scale over time, how costs behave as enrollment grows, and whether the business can maintain adequate cash flow while expanding. Visual reports are especially helpful when presenting to investors, lenders, partners, advisors, or internal team members who may not want to review the full model in detail. This section can support pitch decks, loan packages, board updates, and management presentations by turning the forecast into clear visual evidence. Users can also use charts to compare scenarios, track the relationship between student growth and revenue, or illustrate when profitability improves as fixed costs are spread across a larger student base. The outputs help make financial planning more practical because trends and potential issues become easier to spot. For example, if revenue grows but margins decline, the chart may point to rising instructor costs or inefficient class utilization. If cash flow weakens during a growth phase, the visual report can help highlight the need for working capital. These charts create a more polished and accessible way to communicate the Music School Financial Model’s results.
ROE Components and DuPont Analysis
The ROE components and DuPont analysis section helps users understand the drivers behind return on equity rather than looking at a single return percentage in isolation. DuPont analysis typically breaks return on equity into underlying components such as profitability, asset efficiency, and leverage, allowing users to see how operational performance and financial structure combine to influence investor returns. For a music school, this can be useful when assessing whether returns are being driven by healthy margins, efficient use of startup assets, strong revenue generation from the studio space, or the chosen funding structure. Inputs may include projected net income, equity investment, total assets, revenue, margins, and balance sheet assumptions. The outputs help users evaluate whether the school is using its capital effectively and whether the return profile is attractive enough for owners, partners, or outside investors. This section is particularly relevant for funding discussions because investors often want to understand how their capital will be used and what financial return the business may generate over time. A music school with strong enrollment, efficient room usage, and disciplined expenses may show stronger equity returns than one with underutilized capacity or high fixed overhead. The DuPont view also supports better management decisions by showing whether improvements should come from pricing, cost control, utilization, or capital structure. Instead of focusing only on revenue growth, users can examine whether that growth translates into efficient returns. This makes the Music School Financial Model more useful for strategic planning, ownership analysis, and investor-ready financial evaluation.
Revenue Inputs
The revenue inputs section is where users define the core commercial assumptions that drive the music school forecast. This area may include the number of available student places, class types, occupancy rates, tuition fees, program categories, student growth assumptions, workshops, camps, private lessons, group lessons, and other income sources. For example, a music academy may model beginner guitar, piano, vocals, drums, and other group classes separately, with each program using its own capacity and monthly fee assumptions. The model can then calculate projected revenue by multiplying available seats, expected occupancy, pricing, and billing frequency. This structure is important because a music school’s financial performance is highly dependent on enrollment density and the mix of programs offered. Group classes may create scalable revenue when rooms and instructors are efficiently scheduled, while private lessons may command higher prices but have different capacity constraints. Workshops and summer camps may add seasonal income that improves annual performance. By organizing these assumptions clearly, the template helps users build a forecast that reflects how a music education business actually earns money. The revenue inputs also make it easy to test pricing changes, enrollment campaigns, class capacity expansion, and new program launches. Users can adjust assumptions as market research improves or as the school moves from planning to actual operations. This section is useful for business planning because it shows whether the planned number of students and price points can realistically support payroll, rent, marketing, materials, and other expenses.
Bank-Ready Financial Reports
The bank-ready financial reports section organizes the model’s outputs into lender-friendly financial statements and summaries that can support loan applications, funding requests, and professional business planning. Banks and other financing partners typically want to see structured projections that explain revenue, expenses, profit, cash flow, debt capacity, and financial stability. This section helps present the Music School Financial Model in a format that is easier for lenders, advisors, and stakeholders to review. It may include projected income statements, cash flow statements, balance sheet summaries, debt repayment assumptions, profit metrics, and key financial outputs over the forecast period. For a music school, these reports can help demonstrate how initial startup costs, such as instruments, furnishings, sound equipment, deposits, and marketing, will be funded and how ongoing tuition revenue will support monthly obligations. The reports also help show whether the business can maintain enough cash to cover rent, instructor payroll, utilities, software, teaching materials, payment processing fees, and loan payments. This is useful because lenders are not only interested in growth potential; they also need evidence that the business can service debt and remain liquid. A clear reporting section can make the financial plan look more credible and organized, reducing confusion during funding discussions. Users can also use these reports internally to review whether the business is on track, compare actual results to projections, and prepare updated forecasts. The section supports professional presentation while keeping the underlying assumptions fully editable.
Revenue Breakdown
The revenue breakdown section provides a more detailed view of the music school’s income by revenue stream, helping users understand which programs or services contribute most to total sales. Rather than treating revenue as a single number, this section can separate group classes, private lessons, instrument-specific programs, workshops, summer camps, registration fees, recitals, online lessons, and other offerings if applicable. For each revenue stream, the model may use assumptions such as student count, class capacity, occupancy rate, price per student, billing period, and growth rate. The output helps users see how revenue is distributed across programs and how that mix changes over time. This is valuable because different music school services may have different margins, staffing needs, space requirements, and demand patterns. A high-volume group class may generate strong revenue if occupancy is high, while a private lesson program may depend more heavily on instructor availability and scheduling. Camps and workshops may create additional revenue during school breaks or seasonal periods, improving cash flow and customer engagement. The revenue breakdown also helps users identify where to focus marketing and operational resources. If one program has strong profitability and capacity to grow, it may deserve more promotional effort. If another program uses significant instructor time but generates limited revenue, the owner can reconsider pricing or scheduling. This section supports more informed decision-making because it links strategic program choices to financial results. It also makes the forecast more transparent for investors and lenders who want to understand how the school earns its projected income.
KPI Dashboard
The KPI dashboard section tracks performance metrics that help users evaluate the health of the music school beyond standard financial statements. Key performance indicators may include occupancy rate, student enrollment, average revenue per student, revenue per class, gross margin, EBITDA margin, instructor utilization, payroll as a percentage of revenue, marketing spend as a percentage of revenue, cash balance, break-even timing, and return metrics. For a music school, these indicators are useful because they connect operating performance with financial outcomes. A school may show revenue growth, but KPIs can reveal whether that growth is efficient, whether classes are filling properly, whether instructor costs are under control, and whether marketing spend is producing enough enrollment. This section can also incorporate benchmark comparisons, allowing users to assess whether their assumptions and projected performance appear reasonable compared with industry expectations. The KPI dashboard supports decision-making by helping owners identify issues early and focus on the metrics that matter most. For example, if occupancy is below target, the school may need stronger local marketing, better scheduling, or revised pricing. If payroll consumes too much revenue, the owner may need to adjust class sizes, instructor hours, or program mix. If cash balance trends downward despite profitability, the model may point to timing issues or investment needs. The KPI dashboard is also useful for stakeholder communication because it summarizes the business in a concise, measurable way. It gives founders, consultants, and analysts a practical tool for monitoring progress, evaluating strategy, and presenting performance in an organized format.
Similar ProductsOther customers were also interested in...

 HenrySheykin
Day Care Financial Model Excel Template
The Daycare Center Financial Model helps entrepreneurs, childcare founders, consultants, analysts, a... Read more

Flight School Financial Model Excel Template
The Flight School Financial Model helps users turn an aviation training concept into a structured fi... Read more
Martial Arts School Financial Model Excel Template
The Martial Arts School Financial Model helps founders, school owners, consultants, and business pla... Read more

Driving School Financial Model Excel Template
The Driving School Financial Model Template helps users turn a driving school concept into a structu... Read more

Foreign Languages School Financial Model Excel Tem...
The Language School Financial Model helps users turn a language academy, tutoring center, or languag... Read more

Martial Arts School Financial Model Excel Template
The Martial Arts School Financial Model helps founders, school owners, consultants, and business pla... Read more

Dog Obedience School Financial Model Excel Templat...
The Dog Training Financial Model helps users turn a dog training business concept into a structured ... Read more

Dance School Financial Model Excel Template
The Dance School Financial Model helps users turn a studio concept into a structured financial forec... Read more

Beauty School Financial Model Excel Template
The Beauty School Financial Model helps entrepreneurs, founders, consultants, and business planners ... Read more

IT Compliance and Governance Financial Model Excel...
The IT Compliance and Governance Financial Model helps users turn an IT compliance, governance, risk... Read more
You must log in to submit a review.