
0 ITEMS

Limousine Taxi Financial Model Excel Template
The Limousine Service Financial Model helps entrepreneurs, operators, consultants, analysts, and founders turn a luxury transportation business concept into a structured financial forecast. Instead of relying on scattered assumptions or a generic spreadsheet, this financial model template gives users a ready-to-use framework for estimating revenue, startup costs, operating expenses, payroll, cash flow, profitability, and funding needs. It is especially useful for people preparing a business plan, investor pitch, bank loan application, internal budget, or expansion strategy for a limousine service, chauffeur marketplace, premium car service, or luxury transport platform. The model is built around the real financial drivers of a limousine service, including ride volume, average order value, commissions, subscriptions, customer acquisition costs, staffing, platform or operating setup costs, and ongoing business expenses. Users can customize assumptions to reflect their own market, pricing strategy, service mix, fleet approach, chauffeur network, corporate client base, and growth targets. By connecting these inputs to automated forecasts, the template helps users understand how commercial decisions affect revenue generation, operating margins, cash burn, and long-term profitability. This template is designed to support practical financial planning and decision-making. Users can test different revenue assumptions, review startup investment requirements, estimate payroll and headcount needs, monitor operating expenses, analyze cash flow timing, and evaluate the path to break-even. It also helps clarify whether the business has enough capital runway to manage early losses before reaching sustainable performance. For founders and business owners, this makes it easier to plan launch timing, fundraising needs, marketing budgets, staffing levels, and pricing decisions with greater confidence. The Limousine Service Financial Model is fully editable and works with Microsoft Excel and Google Sheets, making it accessible for both finance professionals and non-financial users. It includes presentation-ready outputs, scenario views, dashboards, reports, and key performance indicators that can be shared with investors, lenders, partners, or internal teams. Whether you are launching a new limousine service, building a chauffeured transport marketplace, or expanding an existing premium car business, the template provides a structured way to evaluate feasibility, communicate the numbers, and make better strategic decisions.
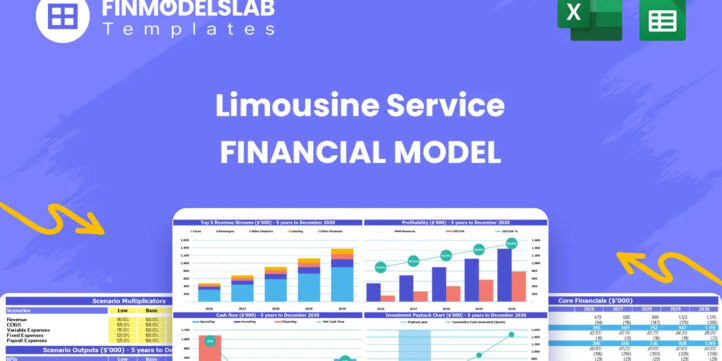


Financial Model Overview
The Limousine Service Financial Model is a ready-to-use financial model template designed to help entrepreneurs, business owners, consultants, analysts, and founders plan the financial performance of a limousine service or luxury chauffeur business. It brings together the key assumptions needed to forecast revenue, startup investment, operating costs, payroll, cash flow, profitability, and funding needs in one structured planning tool. A limousine service can involve several moving parts, including customer acquisition, chauffeur or driver supply, ride commissions, subscription revenue, premium service fees, corporate accounts, platform costs, staffing, and capital requirements. This model helps organize those assumptions so users can evaluate the business before launch, prepare investor or lender materials, or make more confident decisions about growth. Instead of building a spreadsheet from scratch, users can work from an editable template with pre-built formulas, clean outputs, and practical sections that are aligned with the economics of a premium transportation business.
All-in-One Dashboard
The all-in-one dashboard gives users a central view of the core inputs and outputs that drive the Limousine Service Financial Model. This section is useful because it summarizes the most important planning assumptions and financial results without forcing users to search through multiple tabs or disconnected calculations. Inputs may include average order value, ride volume, commission rates, subscription pricing, customer acquisition costs, payroll assumptions, operating expenses, startup costs, and funding assumptions. Outputs may include projected revenue, gross profit, EBITDA, net profit, ending cash balance, cash runway, return metrics, and other summary financial indicators. For a limousine service, this is especially valuable because the business often depends on balancing customer demand, driver or chauffeur availability, marketing spend, operating efficiency, and cash flow timing. The dashboard helps founders and managers quickly understand how the overall plan is performing, whether the assumptions are realistic, and which areas need attention before presenting the model to investors, lenders, partners, or internal stakeholders.
Low Base High Scenario Analysis
The low, base, and high scenario analysis section helps users evaluate how the limousine service could perform under different business conditions. A single forecast can be misleading if it assumes everything goes exactly as planned, so this component allows users to test a conservative case, an expected case, and an upside case. Inputs may include ride demand, customer growth, driver acquisition, order frequency, average order value, subscription adoption, commission rates, marketing efficiency, payroll growth, and operating expense levels. The outputs help show how revenue, profit, cash flow, funding needs, and break-even timing may change when the business performs below expectations, in line with expectations, or above expectations. This is particularly useful for a limousine service because demand can vary by local market, corporate travel patterns, tourism cycles, event activity, airport transfer demand, and competitive pricing. Scenario analysis gives business owners and investors a more realistic view of risk and opportunity, helping them decide how much capital to raise, how aggressively to spend on marketing, when to hire, and what operating targets must be reached to make the business financially sustainable.
Professional Charts
The professional charts section translates the financial model into clear visual reports that are easier to review, present, and discuss. Financial projections can be difficult for stakeholders to interpret when they are shown only as rows of numbers, so presentation-ready charts help communicate the story behind the model. This component may visualize revenue growth, expense trends, gross profit, EBITDA, net income, cash balance, monthly burn, funding requirements, return metrics, and key operational drivers. For a limousine service, charts can make it easier to show how bookings scale over time, how recurring subscription revenue develops, how customer acquisition costs affect profitability, and how the business moves from early losses toward break-even. These visual outputs are useful for investor decks, lender conversations, internal planning meetings, and business plan documents because they give decision-makers a fast way to understand performance trends. By combining automated calculations with clean visual formatting, the model helps users present their luxury transportation financial plan in a polished and professional way.
ROE Components and DuPont Analysis
The ROE components and DuPont analysis section helps users understand what is driving return on equity within the limousine service business. Return on equity can be affected by profitability, asset efficiency, and financial leverage, and DuPont analysis breaks those factors into clearer components. Inputs may include net income, revenue, total assets, equity investment, debt assumptions, operating margins, and asset utilization. Outputs may show how margin performance, revenue efficiency, and capital structure contribute to overall ROE. This is useful for a limousine service because the business may require meaningful upfront investment in platform development, office setup, technology, marketing, working capital, fleet-related costs, or other operating infrastructure. Investors and owners often want to know not only whether the business can become profitable, but also whether the capital invested in the business is being used effectively. This section supports that discussion by helping users evaluate whether returns are being limited by low margins, slow revenue growth, high capital intensity, or inefficient use of resources. It also supports strategic decisions about pricing, cost control, funding mix, and growth pacing.
Revenue Inputs
The revenue inputs section is where users define the commercial assumptions that power the financial forecast. For a limousine service or chauffeured transport marketplace, revenue may come from several sources, such as commissions on gross order value, monthly subscription fees from drivers or chauffeurs, corporate client subscriptions, premium service tiers, promoted listings, advertising fees, airport transfer bookings, event transportation, hourly charters, and other service-based income. This component may include inputs for ride volume, average order value, commission percentage, order frequency, number of active customers, number of active drivers, pricing tiers, subscription conversion rates, customer segments, and expected growth rates. The outputs feed into projected monthly and annual revenue, allowing users to see how each assumption affects the size and timing of income. This is important because limousine service revenue is often shaped by both demand-side factors, such as corporate accounts and traveler bookings, and supply-side factors, such as chauffeur availability and service coverage. By organizing revenue assumptions clearly, the model helps users build a forecast that is easier to explain, defend, and update as new market information becomes available.
Bank-Ready Reports
The bank-ready reports section provides lender-friendly financial outputs that can support loan applications, funding discussions, and formal business planning. Banks and lenders typically want to see structured financial statements, clear assumptions, cash flow projections, repayment capacity, profitability trends, and evidence that the business has considered startup costs and operating risks. This component may generate summaries such as profit and loss forecasts, cash flow statements, balance sheet projections, debt schedules, funding requirements, and key financial metrics. For a limousine service, this is valuable because lenders may need to understand how the business will cover early losses, manage monthly expenses, acquire customers, pay staff, and generate sufficient cash to meet financial obligations. The reports help present the forecast in a more organized and professional format, reducing the need to manually reformat spreadsheets for external review. Whether the user is seeking a bank loan, investor funding, equipment financing, working capital support, or strategic partner backing, this section helps communicate the financial plan in a way that stakeholders can review with greater confidence.
Revenue Breakdown
The revenue breakdown section gives users a detailed view of how total revenue is generated across different streams. Rather than showing only one combined sales number, this component separates the major revenue categories so users can understand which parts of the limousine service are contributing the most to growth and profitability. Inputs may include commission revenue from rides, recurring driver subscriptions, corporate client subscriptions, promotional fees, advertising income, premium booking fees, or other revenue streams relevant to the business model. Outputs may show monthly and annual revenue by category, revenue mix percentages, growth by stream, and the contribution of recurring versus transaction-based income. This is especially useful for a limousine service because a diversified revenue model can reduce dependence on a single source of income and help improve investor confidence. For example, transaction commissions may scale with ride volume, while subscription revenue may provide more predictable recurring income. The revenue breakdown helps users evaluate which services deserve more marketing focus, which pricing tiers are most important, and how the business model might evolve as the customer base and chauffeur network grow.
KPI Dashboard
The KPI dashboard helps users monitor the operating metrics that matter most for a limousine service, chauffeur platform, or premium transportation business. Financial statements show the outcome of business activity, but key performance indicators help explain why those outcomes are happening. Inputs may include customer acquisition cost for buyers and drivers, average order value by customer segment, monthly recurring revenue, ride frequency, active customers, active drivers, churn rates, conversion rates, utilization levels, gross order value, and marketing efficiency. Outputs may include summarized performance metrics, benchmark comparisons, and visual indicators that help users track whether the business is moving in the right direction. This section is useful because limousine service performance depends heavily on both customer demand and service supply. If acquisition costs are too high, ride frequency is too low, or average order value does not support the cost structure, profitability may take longer than expected. By tracking KPIs alongside the financial forecast, users can make better decisions about marketing budgets, customer segments, pricing, driver recruitment, corporate sales, and operational improvements.
Startup Cost and Funding Requirements
The startup cost and funding requirements section helps users estimate the initial investment needed to launch or scale the limousine service. A premium transportation business may require upfront spending before meaningful revenue begins, and this component gives users a structured place to capture those costs. Inputs may include platform development, booking system setup, office setup, furnishings, server infrastructure, licensing, legal and professional fees, insurance deposits, branding, website development, initial marketing, recruiting, training, payment processing setup, working capital, and contingency reserves. Outputs may include total startup costs, funding required before launch, capital allocation by category, and the expected cash needed to support the business until it becomes self-sustaining. This is useful for business planning and fundraising because it gives founders a clearer answer to how much money is needed and why. Investors and lenders often want to see that startup funding has been carefully planned rather than estimated loosely. By separating one-time startup costs from recurring operating expenses, the model helps users avoid underfunding the launch and gives them a more realistic view of early capital needs.
Break-Even and Cash Flow Runway Analysis
The break-even and cash flow runway analysis section helps users understand when the limousine service may become financially sustainable and how much cash may be required to reach that point. Break-even analysis may use revenue, gross margin, fixed costs, variable costs, payroll, marketing spend, and operating expenses to estimate when the business can cover its costs. Cash flow runway analysis may track monthly cash inflows and outflows, opening and ending cash balances, operating losses, capital injections, and funding gaps. Outputs may include the projected break-even month, minimum cash balance, cumulative funding need, monthly cash burn, and timing of cash shortfalls. This section is particularly important for a limousine service because early growth may require heavy spending on customer acquisition, staffing, technology, and driver or chauffeur onboarding before revenue reaches scale. Understanding the runway helps users decide whether they need additional seed funding, whether hiring should be delayed, whether marketing spend should be paced differently, or whether pricing and commission assumptions need adjustment. It also supports more credible conversations with investors and lenders by showing that the business has planned for early losses and has a strategy for reaching profitability.
File types:
Excel – Single-User: .xlsx
Excel – Multi-User: .xlsx
Similar ProductsOther customers were also interested in...


 HenrySheykin
Car Rental Financial Model Excel Template
The Car Rental Financial Model helps entrepreneurs, founders, business owners, consultants, and anal... Read more

Concierge Service Financial Model Excel Template
The Concierge Service Financial Model helps entrepreneurs, founders, consultants, analysts, and busi... Read more

 eFinancialModels
Car Rental Business Financial Model
This Car Rental Business Financial Model Template in Excel offers an ideal basis for developing a bu... Read more

 Pushkar
Online Car Rental – 3 Statement Financial Mo...
Online Car Rental Platform Business Plan Model is a perfect tool for a feasibility study on launchin... Read more
Freight Brokerage Financial Model Excel Template
The Freight Brokerage Financial Model Financial Model Template helps entrepreneurs, founders, busine... Read more

Ambulance Service Financial Model Excel Template
The Ambulance Service Financial Model is a ready-to-use financial model template designed to help en... Read more
Mopeds Rental Financial Model Excel Template
The Scooter Rental Financial Model helps users turn a shared mobility or electric scooter rental con... Read more

Helicopter Taxi Financial Model Excel Template
The Helicopter Transportation Financial Model helps entrepreneurs, founders, operators, consultants,... Read more

 Giorgos
Driving School – 5 Year Financial Model
Financial Model providing an advanced 5-year financial plan for a startup or operating Driving Schoo... Read more

Crane Rental Company Financial Model
Dive into the financial planning of your Crane Rental Company with our comprehensive 10-year monthly... Read more
You must log in to submit a review.