
0 ITEMS

Car Rental Financial Model Excel Template
The Car Rental Financial Model helps entrepreneurs, founders, business owners, consultants, and analysts turn a rental car business idea into a structured financial forecast. Instead of estimating fleet costs, rental income, operating expenses, payroll, cash flow, and profitability in separate spreadsheets, this template brings the planning process into one editable model. It is designed for users preparing a business plan, evaluating a new launch, expanding an existing fleet, or building funding documents for lenders, investors, or internal stakeholders. This financial model template gives users a practical way to forecast revenue assumptions based on fleet size, vehicle classes, utilization, average daily rental rates, and add-on services such as insurance, GPS rentals, child seats, mileage fees, and one-way charges. It also helps organize the major startup costs required for a car rental business, including vehicle purchases, location buildout, booking systems, deposits, launch marketing, and working capital. By connecting these assumptions with operating expenses, staffing, maintenance, insurance, marketing, and other ongoing costs, the model helps users understand how the business may perform over time. The template is especially useful for financial planning and decision-making because it shows how changes in pricing, occupancy, fleet growth, and cost structure can affect profit, cash flow, break-even timing, and investment returns. Users can test different assumptions, review low, base, and high scenarios, and see whether the business can support its fixed costs and capital requirements. This is important in the car rental industry, where fleet investment is significant, cash flow timing matters, and profitability depends on keeping vehicles rented at the right rates while controlling maintenance, insurance, and customer acquisition costs. Built to save time and support professional presentation, the Car Rental Financial Model includes pre-built formulas, editable inputs, visual outputs, and investor-ready reporting logic. It can be used in Microsoft Excel or Google Sheets and adapted for startups, local operators, airport rental concepts, luxury rental services, fleet expansion plans, or multi-location rental businesses. Whether the goal is to secure financing, compare strategic options, set operating targets, or decide whether the opportunity is financially viable, this template provides a clear framework for building a more credible rental car business forecast.
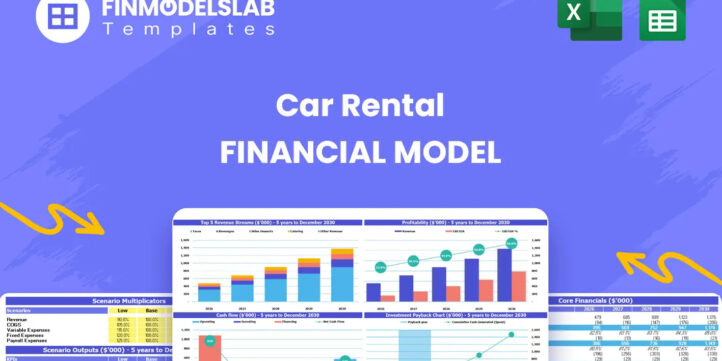


Car Rental Financial Model Overview
The Car Rental Financial Model is a ready-to-use financial model template built to help users plan, forecast, and evaluate a vehicle rental business with a structured financial approach. A car rental company is capital intensive because it requires a fleet, a location or operating base, insurance coverage, maintenance processes, booking systems, staff, and working capital before revenue can fully ramp up. This template helps bring those moving parts into one organized model so entrepreneurs, business owners, consultants, analysts, and founders can estimate revenue, costs, cash flow, profitability, financing needs, and investor returns without building a spreadsheet from scratch. It is suitable for startup planning, business plan development, bank loan preparation, investor discussions, fleet expansion analysis, and internal decision-making. The model is fully editable, compatible with Microsoft Excel and Google Sheets, and designed to translate assumptions such as fleet size, utilization rate, average daily rental rate, vehicle mix, ancillary revenue, staffing, operating expenses, and capital investment into a clear five-year financial forecast.
All-in-One Dashboard
The all-in-one dashboard component gives users a central view of the most important inputs and outputs in the Car Rental Financial Model. It is designed to connect the key assumptions that drive the business, such as fleet size, vehicle classes, utilization, average daily rates, ancillary revenue, startup investment, operating expenses, financing structure, and timing of launch, with the resulting financial outcomes. From this single planning area, users can review high-level revenue, EBITDA, profit, cash flow, investment requirements, payback, and other core performance indicators without searching through every worksheet. This component is useful because car rental planning depends on many connected variables, and a dashboard makes it easier to see whether the assumptions are working together in a realistic way. For example, a larger fleet may increase revenue potential, but it also increases capital requirements, insurance, maintenance, depreciation, and financing needs. By placing core inputs and core outputs in one accessible view, the dashboard helps users make faster decisions, identify unrealistic assumptions, and prepare a more organized financial plan for management, lenders, investors, or strategic partners.
Low, Base, and High Scenario Analysis
The low, base, and high scenario analysis component helps users evaluate how the car rental business may perform under different market conditions and operating outcomes. Instead of relying on one fixed forecast, users can compare a downside case, a realistic base case, and an upside case based on changes in assumptions such as occupancy rate, average daily rental rate, fleet utilization, fleet growth, marketing effectiveness, maintenance cost, insurance cost, and ancillary revenue conversion. This component can show how lower travel demand, aggressive competitor pricing, higher repair costs, or slower booking growth may affect cash flow, profitability, payback period, and funding needs. It can also show how stronger utilization, better pricing, and higher add-on sales may improve EBITDA, cash reserves, and return on investment. Scenario planning is especially valuable for a vehicle rental business because small changes in occupancy and pricing can have a significant impact on margins once the fleet and location costs are fixed. This section supports smarter decision-making by helping users understand risk, test strategic alternatives, set realistic operating targets, and prepare credible conversations with lenders or investors who will want to know how the business performs beyond the base case.
Professional Charts
The professional charts component converts the financial forecast into clean visual reports that are easier to understand and present. A car rental financial forecast can include many detailed figures, such as monthly revenue, annual profit, cash balance, fleet investment, operating expenses, debt service, EBITDA, payback timing, and return metrics. Charts help simplify this information by turning key trends into visual outputs that can be reviewed quickly by founders, managers, investors, lenders, and advisors. Users can rely on this component to illustrate revenue growth, profit development, cash flow movement, cost structure, utilization trends, and investment recovery over the forecast period. The inputs come from the model’s assumptions and financial statements, while the outputs are presentation-ready visuals that support business plans, pitch decks, loan applications, and internal strategy meetings. This is useful because stakeholders often need to understand the financial story quickly, not just review spreadsheet rows. Well-structured charts make it easier to show how the rental car business scales, when cash flow improves, how profitability develops, and where management should focus attention. They also help users spot trends or pressure points that may be less obvious in raw financial tables.
ROE Components and DuPont Analysis
The ROE components and DuPont analysis component helps users understand the drivers behind return on equity rather than viewing ROE as a single standalone number. In a car rental business, equity returns are affected by profit margins, asset utilization, leverage, fleet investment, financing choices, and operating efficiency. This section breaks return on equity into underlying components so users can see whether performance is being driven by strong margins, efficient use of assets, debt structure, or a combination of factors. Inputs may include net income, revenue, total assets, equity, debt levels, depreciation, and balance sheet movements over the forecast period. The outputs can help users assess whether the business is generating acceptable returns for owners and investors given the amount of capital required to purchase or finance the vehicle fleet. This is particularly important for car rental companies because the model is asset-heavy and return quality depends on using the fleet productively. DuPont-style analysis supports investment decision-making by showing whether improvements should come from better pricing, higher occupancy, tighter expense control, improved asset turnover, or a revised financing mix. It also helps founders and investors evaluate whether growth is creating sustainable value or simply increasing capital intensity.
Revenue Inputs
The revenue inputs component is where users define the commercial assumptions that drive the rental car business forecast. These inputs may include the number of vehicles in the fleet, vehicle categories such as economy, standard, SUV, luxury, and van, expected utilization or occupancy rates, average daily rental rates, seasonal adjustments, rental days, fleet growth, and add-on revenue assumptions. The section can also include revenue drivers for insurance products, GPS rentals, child seat rentals, mileage fees, one-way fees, late return charges, and other ancillary services. By organizing these assumptions in a structured way, the model helps users estimate rental income based on the actual mechanics of the business rather than a generic sales growth percentage. This is useful because revenue in a car rental operation depends heavily on fleet capacity and how efficiently that capacity is rented. A fleet with strong utilization but poor pricing may underperform, while a smaller fleet with higher daily rates and strong add-on conversion may produce better margins. The revenue inputs section allows users to test these tradeoffs, validate assumptions against market expectations, and create a forecast that reflects their intended location, customer segment, pricing strategy, and fleet mix.
Bank-Ready Reports
The bank-ready reports component provides lender-friendly financial outputs that can support financing applications and professional funding discussions. Car rental businesses often require substantial upfront capital for fleet acquisition, deposits, facilities, insurance, booking systems, and working capital, so banks and financing partners typically want to see a clear forecast before approving loans or credit lines. This component is designed to present the core financial statements and performance metrics in a format that is easy to follow, including revenue projections, profit and loss summaries, cash flow forecasts, balance sheet outputs, debt assumptions, repayment capacity, and key financial indicators. Inputs may include financing amounts, interest rates, repayment terms, startup costs, operating expenses, revenue assumptions, and cash reserve requirements. The outputs help users explain how the business will generate cash, cover expenses, service debt, and maintain liquidity during the launch and growth phases. This is useful because lenders are not only interested in revenue potential; they also want to understand cash flow timing, funding gaps, and downside risk. Bank-ready reports help make the financial case more credible, organized, and transparent, which can improve the quality of loan discussions and reduce the time spent reformatting financial data.
Revenue Breakdown
The revenue breakdown component gives users a detailed view of how total revenue is generated across the main income streams of the car rental business. Rather than showing only one total sales number, this section separates revenue by rental categories, vehicle classes, customer segments, or add-on services, depending on how the user customizes the model. It can show how much income comes from core vehicle rentals compared with ancillary services such as insurance add-ons, GPS rentals, child seat rentals, mileage fees, one-way fees, and other supplementary charges. Inputs may include daily rates by vehicle type, utilization by fleet category, rental days, conversion rates for add-ons, price per add-on, and growth assumptions over time. The resulting outputs help users understand which revenue streams contribute most to total sales and which ones may offer the highest margin opportunities. This matters because car rental profitability is often improved through a combination of strong fleet utilization and high-margin ancillary products. A detailed revenue breakdown allows users to refine pricing, prioritize fleet categories, identify underperforming vehicle segments, and evaluate whether certain services should be promoted more aggressively. It also supports investor and lender presentations by demonstrating that the revenue forecast is based on real operating drivers rather than broad assumptions.
KPI Dashboard
The KPI dashboard component focuses on the operational and financial performance metrics that matter most in a car rental business. These may include fleet utilization, occupancy rate, average daily rate, revenue per available vehicle, ancillary revenue per rental, maintenance cost as a percentage of revenue, insurance cost, EBITDA margin, net profit margin, cash balance, payback period, ROE, and other benchmark-oriented indicators. The inputs are drawn from the model’s revenue assumptions, cost structure, fleet data, and financial statements, while the outputs summarize performance in a way that supports quick analysis and ongoing management. This component is useful because car rental operators need to monitor more than just total revenue. A growing revenue line may hide weak utilization, excessive maintenance expenses, underpriced vehicles, or poor add-on conversion. The KPI dashboard helps users compare projected performance against internal goals or industry benchmarks and identify which operating levers need attention. For business planning, it helps make assumptions more defensible. For ongoing management, it helps track whether the business is moving in the right direction. For funding discussions, it gives investors and lenders a concise view of the metrics that indicate operational discipline and financial viability.
Startup Cost Breakdown
The startup cost breakdown component helps users estimate the initial capital required to launch or expand a car rental business. This section may include the initial fleet purchase or lease deposits, rental location buildout, signage, office setup, booking system development, website and software costs, licenses and permits, legal and accounting fees, insurance deposits, launch marketing, security deposits, pre-opening payroll, and working capital reserves. The component is designed to separate one-time startup costs from recurring operating expenses so users can clearly understand how much funding is needed before the business begins generating consistent rental income. Outputs may include total startup investment, capital expenditure requirements, pre-opening cash needs, and the amount of funding required from equity, debt, or other financing sources. This is valuable because car rental businesses can face large early cash outflows, particularly when vehicles are purchased upfront. A clear startup cost plan helps prevent undercapitalization, supports loan and investor requests, and gives founders a more realistic view of launch feasibility. It also helps users compare strategic options, such as buying the fleet versus financing vehicles, starting with a smaller vehicle mix, delaying certain expenses, or allocating more funds to marketing and customer acquisition.
Break-Even Analysis
The break-even analysis component helps users identify when the car rental business is expected to cover its costs and begin generating positive operating results. It uses assumptions such as fixed monthly expenses, variable costs, rental revenue, utilization rate, average daily rate, ancillary sales, payroll, rent, insurance, marketing, maintenance, and administrative costs to estimate the level of activity required to reach break-even. Outputs may include the break-even month, required revenue level, required rental days, required occupancy rate, and the relationship between fixed costs and contribution margin. This is especially important in the car rental industry because once the fleet, location, insurance, and staffing costs are in place, the business needs enough rental volume to absorb those commitments. Break-even analysis helps users understand whether their planned fleet size, pricing strategy, and demand assumptions are sufficient to support the cost structure. It can also guide practical decisions, such as how aggressively to market before launch, whether to pursue corporate accounts for weekday demand, how to price introductory offers, and how much working capital is needed while the business ramps up. For lenders and investors, this component provides a clear indication of when the business may become financially self-sustaining and what assumptions must be achieved to reach that point.
Similar ProductsOther customers were also interested in...



 Pushkar
Online Car Rental – 3 Statement Financial Mo...
Online Car Rental Platform Business Plan Model is a perfect tool for a feasibility study on launchin... Read more

 eFinancialModels
Car Rental Business Financial Model
This Car Rental Business Financial Model Template in Excel offers an ideal basis for developing a bu... Read more

Crane Rental Company Financial Model
Dive into the financial planning of your Crane Rental Company with our comprehensive 10-year monthly... Read more

 City Finance
Car Hire Company Financial Model 5 Year 3 Statemen...
A comprehensive editable, MS Excel spreadsheet for tracking car hire company finances, including yea... Read more
 HenrySheykin
Freight Brokerage Financial Model Excel Template
The Freight Brokerage Financial Model Financial Model Template helps entrepreneurs, founders, busine... Read more
Limousine Taxi Financial Model Excel Template
The Limousine Service Financial Model helps entrepreneurs, operators, consultants, analysts, and fou... Read more
Mopeds Rental Financial Model Excel Template
The Scooter Rental Financial Model helps users turn a shared mobility or electric scooter rental con... Read more

Concierge Service Financial Model Excel Template
The Concierge Service Financial Model helps entrepreneurs, founders, consultants, analysts, and busi... Read more

 Giorgos
Bike Rental Company – 5 Year Financial Model
Financial Model providing an advanced 5-year financial plan for a startup or operating Bike Rental C... Read more

Car Rental Company Financial Model – Dynamic 10 ...
A Financial model presenting a business scenario of a Car Rental Company which offers Daily Car Rent... Read more
You must log in to submit a review.