
0 ITEMS

Health Clinic Financial Model Excel Template
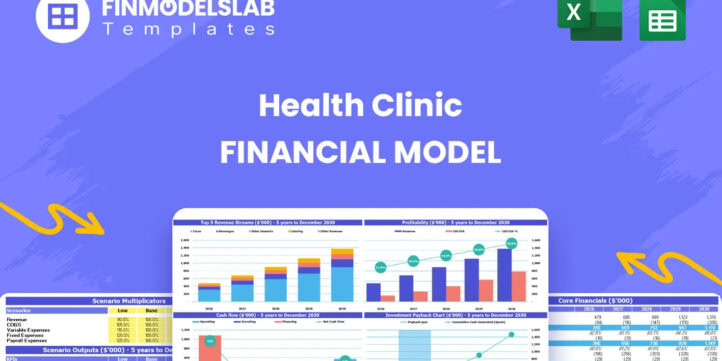
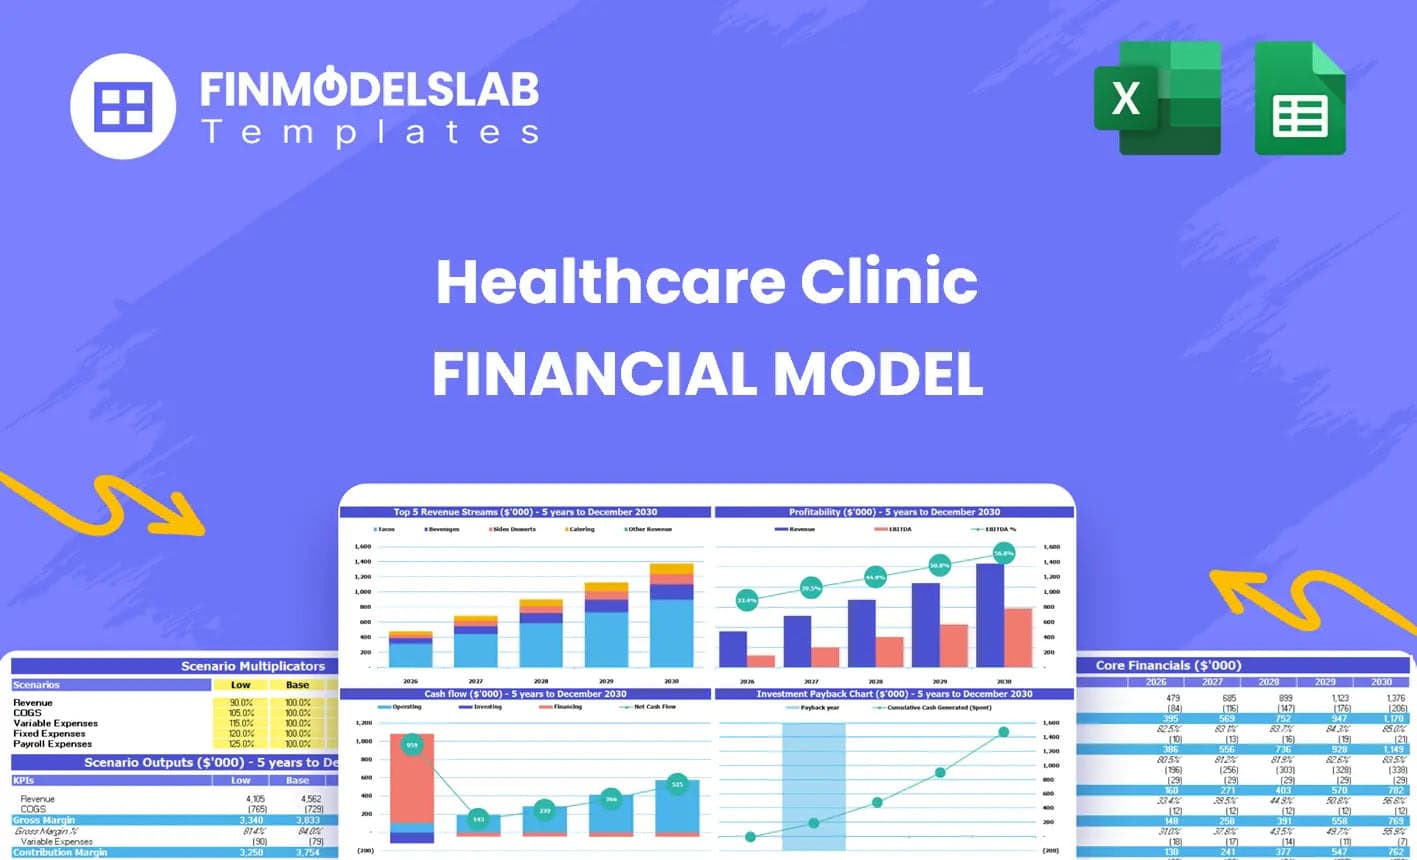
The Health Clinic Financial Model helps users build a structured financial forecast for a medical clinic, primary care practice, outpatient clinic, or multi-practitioner healthcare business. Instead of starting with a blank spreadsheet, buyers get a ready-to-use model designed around clinic-specific revenue drivers, operating costs, staffing needs, startup investment, cash flow, and profitability. It helps translate assumptions such as practitioner capacity, patient visits, service pricing, utilization rates, payroll, medical supplies, rent, equipment, and working capital into a complete five-year financial plan. This financial model template is built for entrepreneurs, clinic founders, business owners, consultants, analysts, and teams preparing business plans, funding applications, investor materials, or internal budgets. It supports decision-making by showing how the clinic may perform under realistic assumptions, how much startup capital may be required, when revenue can cover expenses, and how changes in patient volume or pricing can affect results. Users can customize the model for their own service mix, staffing structure, local cost base, reimbursement expectations, and growth strategy. The template brings together revenue assumptions, startup costs, operating expenses, payroll planning, cash flow forecasting, profitability analysis, break-even analysis, scenario planning, and presentation-ready reporting. It helps users evaluate whether the clinic can support its cost structure, when additional hiring or equipment purchases may be financially realistic, and what funding may be needed to manage early-stage cash flow. The model is designed to make financial planning more practical, transparent, and lender-friendly. With editable assumptions, automated calculations, professional formatting, and compatibility with Excel and Google Sheets, the Health Clinic Financial Model gives buyers a flexible planning tool that can be reused and updated as the business evolves. It is useful for testing different launch plans, comparing conservative and growth-oriented scenarios, preparing financial statements, reviewing key performance indicators, and presenting a more credible financial case to banks, investors, partners, advisors, or internal stakeholders.


Financial Model Overview
The Health Clinic Financial Model is a ready-to-use financial model template designed to help entrepreneurs, clinic owners, healthcare consultants, analysts, and planning teams forecast the financial performance of a medical clinic or outpatient healthcare practice. It organizes the major financial drivers of a clinic into one connected planning tool, including patient volume, practitioner capacity, service pricing, operating expenses, payroll, startup investment, cash flow, profitability, and funding needs. For a clinic business, financial planning is especially important because early setup costs can be significant, staffing decisions must match expected patient demand, and cash flow can be affected by billing cycles, insurance collections, rent, equipment, medical supplies, and working capital requirements. This template helps users replace guesswork with structured assumptions and automatically generated outputs, making it easier to prepare business plans, lender submissions, investor discussions, internal budgets, and expansion forecasts. The model is fully editable, compatible with Excel and Google Sheets, and designed to support practical decision-making over a five-year forecast period.
All-in-One Dashboard
The all-in-one dashboard gives users a central view of the most important inputs and outputs in the Health Clinic Financial Model. Instead of moving through multiple tabs to understand the financial position of the clinic, users can review key assumptions, projected revenue, profitability, cash flow, funding needs, and summary performance indicators in one organized place. The dashboard may pull from assumptions such as number of practitioners, patient visit capacity, utilization rates, service pricing, payroll levels, rent, direct costs, startup investment, and financing structure. It then helps convert those inputs into high-level outputs such as revenue growth, EBITDA, net profit, cash balance, and return metrics. This component is useful because it gives founders, managers, lenders, and investors a quick understanding of whether the clinic plan is financially viable. It also helps users identify which areas require attention, such as low utilization, high fixed costs, delayed profitability, or insufficient cash reserves. For planning and presentations, the dashboard acts as the executive summary of the model.
Low Base High Scenario Analysis
The low, base, and high scenario analysis section allows users to test how different operating outcomes could affect the financial performance of the clinic. A health clinic rarely performs exactly according to a single forecast, so this component gives users a practical way to compare conservative, expected, and optimistic cases. Inputs may include patient volume, practitioner utilization, average service price, reimbursement assumptions, cost inflation, staffing levels, marketing performance, and collection timing. The model can then show how each scenario affects revenue, gross profit, EBITDA, cash flow, break-even timing, and funding requirements. This is especially valuable for business planning and lender conversations because it demonstrates that the user has considered risk, not just upside potential. A low case may reveal how much cash the clinic needs if patient acquisition is slower than planned, while a high case may show when additional practitioners, treatment rooms, or equipment may be needed. Scenario analysis helps users make more resilient decisions before committing capital or signing long-term obligations.
Professional Charts
The professional charts component turns the financial forecast into visual outputs that are easier to understand, review, and present. Healthcare financial models can contain many rows of assumptions and calculations, but charts help users communicate the story behind the numbers. This section may visualize revenue growth, EBITDA development, monthly or annual cash flow, patient volume trends, expense categories, profit margins, funding requirements, and return metrics. The inputs come from the model’s revenue, cost, staffing, and cash flow calculations, while the outputs provide clear visual summaries for business plans, investor decks, lender meetings, and management reviews. For a health clinic, charts are useful because stakeholders often want to see whether patient demand grows steadily, when losses turn into profits, and whether the clinic maintains enough cash through the launch period. Visual reporting can also help founders compare scenarios, monitor progress against targets, and explain complex financial assumptions in a more accessible format. The result is a more polished, presentation-ready financial plan.
ROE Components and DuPont Analysis
The ROE components and DuPont analysis section helps users evaluate return on equity by breaking performance into the drivers that influence shareholder or owner returns. Instead of looking only at a single return figure, this component can separate profitability, asset efficiency, and financial leverage to show why return on equity changes over time. Inputs may include net income, revenue, total assets, equity, debt financing, retained earnings, and balance sheet assumptions. Outputs can include return on equity, profit margin, asset turnover, equity multiplier, and related performance measures. For a health clinic, this is useful because owners and investors may want to understand whether returns are improving because the clinic is becoming more profitable, using assets more efficiently, or relying more heavily on financing. DuPont analysis can also highlight whether expensive equipment, build-out costs, or underutilized capacity are limiting returns. This section supports strategic decision-making by showing how operational improvements, pricing changes, cost control, and capital structure choices affect investor-level outcomes.
Revenue Inputs
The revenue inputs section is where users define the commercial assumptions that drive the clinic’s income forecast. In a health clinic model, revenue is commonly shaped by the number of practitioners, appointment capacity, utilization rates, patient visits, service categories, pricing, reimbursement levels, and ramp-up timing. This component may allow users to adjust assumptions for general physician consultations, nurse practitioner visits, specialist services, medical assistant procedures, lab tests, or other clinic-specific revenue streams. The model then uses those inputs to calculate projected monthly and annual revenue over the forecast period. This section is useful because revenue planning must reflect how the clinic actually operates, not just a generic growth percentage. If a physician can only see a certain number of patients per day, revenue should be tied to that capacity and expected utilization. By structuring revenue around practical operating drivers, the model helps users test pricing, patient acquisition targets, staffing plans, and service mix decisions in a realistic way.
Bank-Ready Reports
The bank-ready reports component provides lender-friendly financial outputs that help users present the clinic’s financial case in a structured and professional format. Banks, financing partners, and other stakeholders usually want to see more than a revenue estimate. They need clear financial statements, assumptions, profitability projections, debt service capacity, cash flow coverage, and a credible explanation of startup and working capital needs. This section may include outputs such as profit and loss statements, cash flow statements, balance sheet summaries, financing schedules, debt repayment assumptions, and key lender metrics. Inputs come from the broader model, including startup costs, operating expenses, payroll, revenue assumptions, loans, equity contributions, and repayment terms. The value of this component is that it helps users prepare a more complete funding package without building financial statements from scratch. It can support applications for equipment financing, startup loans, working capital lines, landlord discussions, investor review, or internal approval processes by presenting the clinic forecast in a clear and defensible way.
Revenue Breakdown
The revenue breakdown section gives users a detailed view of how total clinic revenue is generated across different services, practitioners, or revenue streams. This is important because not all clinic services have the same price, volume, margin, or growth potential. A general physician visit, specialist consultation, nurse practitioner appointment, lab service, and medical assistant procedure can each contribute differently to revenue and profitability. This component may use inputs such as service category, price per visit, number of providers, appointment volume, utilization rate, and ramp-up schedule. It then helps generate outputs showing revenue by stream, percentage contribution, growth trends, and areas of concentration. For planning, this helps users understand which services are most important to the clinic’s financial success and where additional focus may be needed. If one revenue stream is expected to carry most of the forecast, the user can assess whether that assumption is realistic. It also supports pricing decisions, staffing plans, capacity management, marketing priorities, and expansion into higher-margin services.
KPI Dashboard
The KPI dashboard provides a focused view of the key performance indicators that matter most for managing a health clinic. While full financial statements are essential, operators also need practical metrics that connect day-to-day clinic activity with financial outcomes. This component may track metrics such as patient visits, practitioner utilization, average revenue per visit, revenue per practitioner, EBITDA margin, cash balance, payroll as a percentage of revenue, medical supplies as a percentage of revenue, break-even progress, and return measures. The inputs are drawn from the model’s operating assumptions, revenue forecast, expense plan, staffing schedule, and financial statements. The outputs help users monitor whether the clinic is moving toward its targets and where corrective action may be needed. For example, low utilization may indicate a need for stronger marketing or scheduling improvements, while high payroll as a percentage of revenue may signal overstaffing or slow patient ramp-up. The KPI dashboard is useful for internal management, monthly reviews, investor updates, and ongoing decision-making after launch.
Break-Even Analysis
The break-even analysis section helps users estimate when the clinic’s revenue will be sufficient to cover its operating costs. For a healthcare startup, this is one of the most important planning questions because the business may incur significant expenses before patient volume reaches a sustainable level. Inputs may include fixed costs such as rent, insurance, administrative salaries, software, utilities, and loan payments, as well as variable costs such as medical supplies, lab-related costs, transaction fees, and other expenses tied to patient volume. The model can then calculate the level of revenue or patient visits needed to cover monthly costs and identify the timing of break-even within the forecast. This output is useful for founders and lenders because it clarifies how long the clinic may need funding support before becoming self-sustaining. It also helps users evaluate decisions that affect the path to profitability, such as pricing, practitioner hiring, marketing investment, operating hours, and cost control. A clear break-even view makes the financial plan more practical and easier to defend.
Startup Costs and Capital Requirements
The startup costs and capital requirements section organizes the initial investment needed to open and prepare the clinic for operations. A health clinic may require funding for leasehold improvements, clinic build-out, diagnostic equipment, exam room furniture, office furniture, IT infrastructure, electronic health record implementation, licensing, insurance deposits, opening inventory, marketing, professional fees, and working capital reserves. This component allows users to estimate one-time launch costs separately from recurring operating expenses, which is essential for accurate funding planning. The model can then show how much capital may be required before the clinic generates revenue and whether that capital should come from owner equity, bank loans, equipment financing, investor funds, or a combination of sources. This section is useful because underestimating startup costs can create cash pressure early in the launch period, even if the long-term business model is profitable. By detailing capital needs upfront, users can prepare stronger funding requests, avoid overlooked expenses, and make more informed decisions about launch timing, facility size, equipment purchases, and initial staffing.
File types:
Excel – Single-User: .xlsx
Excel – Multi-User: .xlsx
Similar ProductsOther customers were also interested in...


 HenrySheykin
Drug Rehab Clinic Financial Model Excel Template
The Drug and Alcohol Rehab Center Financial Model helps users turn a treatment facility concept into... Read more

Alcohol Treatment Center Financial Model Excel Tem...
The Drug and Alcohol Rehab Center Financial Model helps users turn a treatment facility concept into... Read more

Ayurveda Center Financial Model Excel Template
The Ayurvedic Consultation Service Financial Model helps entrepreneurs, practitioners, wellness foun... Read more

Acupuncture Center Financial Model Excel Template
The Acupuncture Clinic Financial Model helps users turn an acupuncture practice concept into a struc... Read more

Occupational Therapy Financial Model Excel Templat...
The Occupational Therapy Financial Model helps users build a structured forecast for an OT clinic or... Read more

 Giorgos
Speech Therapy Center – 5 Year Financial Model
Financial Model providing an advanced 5-year financial plan for a startup or operating Speech Therap... Read more
Medical Practice Financial Model Excel Template
The Medical Practice Financial Model helps users turn a clinic concept, expansion plan, or healthcar... Read more
Dental Practice Financial Model Excel Template
The Dental Clinic Financial Model helps users turn a dental practice concept, launch plan, or expans... Read more

Ambulatory Surgical Center Financial Model Excel T...
The Ambulatory Surgery Center Financial Model helps founders, healthcare operators, consultants, ana... Read more
Clinic Financial Model Excel Template
The Healthcare Clinic Financial Model helps founders, clinic owners, consultants, analysts, and busi... Read more
You must log in to submit a review.