
0 ITEMS

Condo Hotel Financial Model Excel Template
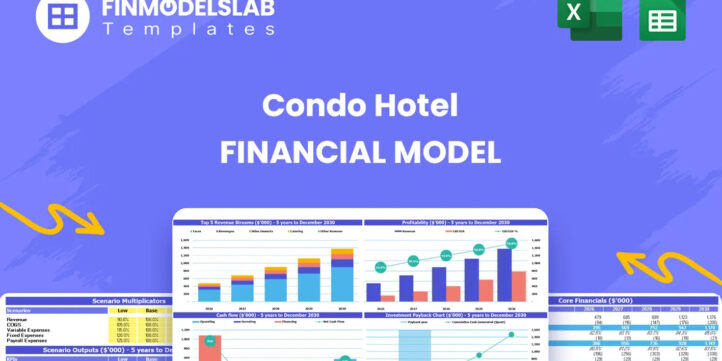
The Condo Hotel Financial Model helps users turn a condo hotel concept, launch plan, or investment opportunity into a structured financial forecast. Built for hospitality projects that combine room revenue, ancillary services, ownership economics, and property-level operating costs, this financial model template gives entrepreneurs, developers, business owners, consultants, analysts, and founders a practical way to estimate revenue assumptions, startup costs, operating expenses, payroll, cash flow, profitability, and funding needs before making major commitments. Instead of starting with a blank spreadsheet, users can work from a ready-to-use model designed around the key drivers lenders and investors typically review first. The template helps organize assumptions for available units, occupancy, average daily rate, room mix, food and beverage income, parking, spa services, staffing, variable costs, fixed costs, capital investment, and cash timing. It supports business planning, funding preparation, internal budgeting, and decision-making by connecting commercial assumptions directly to financial outputs such as revenue, EBITDA, profit and loss, cash flow, and return metrics. The model is especially useful for people preparing a condo hotel business plan, evaluating a hotel-style real estate investment, reviewing an expansion opportunity, or presenting a funding request to banks, investors, partners, or internal stakeholders. It allows users to customize assumptions, compare scenarios, monitor liquidity, review profitability, and assess whether the business can sustain its cost structure as occupancy and rates change over time. Built-in break-even analysis helps users identify when the project may become profitable, while revenue and expense forecasting supports more confident planning around launch, operations, and growth. With editable inputs, professional reports, dashboards, charts, and KPI views, the Condo Hotel Financial Model gives buyers a clearer view of how the business may perform over a multi-year period. It helps simplify complex hospitality finance into a more manageable planning tool, making it easier to test assumptions, communicate the financial story, evaluate risks, and make better decisions about pricing, staffing, capital spending, investor presentations, and long-term profitability.


Financial Model Overview
The Condo Hotel Financial Model is a ready-to-use financial model template designed to help entrepreneurs, property developers, business owners, consultants, analysts, and investment teams evaluate the economics of a condo hotel project. A condo hotel has multiple financial drivers, including room nights sold, average daily rate, occupancy, unit mix, ancillary services, staffing, property operating costs, capital expenditures, and investor return expectations. This template brings those assumptions together in one structured model so users can forecast revenue, estimate startup and operating costs, evaluate cash flow timing, review profitability, and prepare more professional materials for lenders, investors, partners, or internal decision-makers. Instead of building a complex spreadsheet from scratch, users can begin with an editable framework that is tailored to condo hotel planning and adaptable to a specific location, room count, pricing strategy, service offering, operating structure, and funding plan.
All-in-One Dashboard
The all-in-one dashboard gives users a central place to review the most important inputs and outputs of the Condo Hotel Financial Model. This component is useful because condo hotel planning involves many moving parts, and decision-makers need a clear way to see how the business performs without searching through every worksheet. The dashboard may summarize revenue, occupancy, average daily rate, operating expenses, EBITDA, profit, cash balance, funding needs, and investor return metrics in one organized view. Users can adjust core assumptions such as available units, room rates, ancillary revenue, cost percentages, payroll levels, and capital spending, then review how those inputs affect the overall forecast. For business planning, the dashboard helps turn detailed spreadsheet logic into a practical management view. For funding discussions, it helps investors and lenders quickly understand the project’s scale, profitability, and liquidity position. For internal decision-making, it provides a quick reference point for comparing plan versus target and identifying areas that need deeper review.
Low, Base, and High Scenario Analysis
The low, base, and high scenario analysis component helps users evaluate how the condo hotel may perform under different market conditions. A single forecast can create a false sense of certainty, especially in hospitality where occupancy, average daily rate, booking mix, operating costs, and guest demand can shift significantly. This section allows users to test a conservative case, a realistic base case, and an upside case by changing the most important business drivers. Inputs may include occupancy changes, ADR adjustments, room supply growth, ancillary revenue variation, cost inflation, payroll assumptions, and marketing efficiency. Outputs may show differences in revenue, gross profit, EBITDA, cash flow, profit margins, and funding requirements across scenarios. This is especially useful for strategic planning because users can see whether the project remains viable if demand is lower than expected or if expenses rise faster than planned. It is also valuable for investor presentations because it shows that management has considered risk, upside potential, and contingency planning rather than relying on one fixed forecast.
Professional Charts
The professional charts component helps users communicate the financial story of the condo hotel in a visual, presentation-ready format. Financial projections can be difficult for stakeholders to interpret when they are shown only as rows of numbers, so charts make it easier to see trends, growth patterns, pressure points, and key performance movements over time. This section may visualize revenue growth, occupancy trends, average daily rate changes, EBITDA expansion, cash balance movement, expense categories, profit margins, and return metrics. The inputs come from the model’s underlying forecasts, while the outputs provide clear visual summaries that can be used in business plans, pitch decks, lender discussions, board updates, and internal planning sessions. For a condo hotel project, charts are especially helpful because they show how operational improvements, such as higher occupancy or stronger ADR, flow through to profitability. They also help users explain how ancillary services, capital spending, and cost controls support the overall investment case. A visual reporting section makes the model easier to present and helps stakeholders understand the forecast more quickly.
ROE Components and DuPont Analysis
The ROE components and DuPont analysis section helps users understand the drivers behind return on equity rather than looking only at a single headline return metric. For a condo hotel investment, return on equity can be influenced by profit margin, asset efficiency, financing structure, operating leverage, and the relationship between invested capital and generated earnings. This component may break ROE into its underlying elements so users can see whether performance is being driven by strong profitability, efficient asset utilization, leverage, or a combination of these factors. Inputs may include net income, equity investment, total assets, revenue, margins, and balance sheet assumptions. Outputs may include ROE, margin indicators, asset turnover, leverage effects, and related return insights. This is useful for investors and analysts because it gives a more detailed explanation of why returns are improving or weakening over the forecast period. It also supports decision-making by showing which operational or financial levers have the greatest impact on investor returns, such as improving room pricing, reducing operating costs, increasing direct bookings, or optimizing the capital structure.
Revenue Inputs
The revenue inputs component is where users define the core commercial assumptions that drive the condo hotel forecast. This section is especially important because room revenue and ancillary income typically form the foundation of the entire financial model. Users may enter assumptions for the number of available units, unit types, occupancy rates, weekday and weekend average daily rates, seasonality, booking mix, food and beverage sales, parking fees, spa services, event income, and other guest-related revenue streams. The model uses these inputs to calculate room nights sold, room revenue, ancillary revenue, total revenue, and revenue growth over time. For a condo hotel, this approach is valuable because it connects operating assumptions directly to financial performance. Rather than entering one flat sales number, users can build revenue from the actual drivers of the business. This supports better pricing decisions, more realistic business planning, and clearer investor communication. It also allows users to test how changes in occupancy, ADR, unit count, or guest spending affect profitability, cash flow, break-even timing, and funding requirements.
Bank-Ready Reports
The bank-ready reports component provides lender-friendly financial outputs that help users present the condo hotel project in a professional and organized way. Lenders typically want to review revenue assumptions, operating costs, profitability, debt capacity, cash flow timing, and the ability of the business to cover obligations. This section may include summarized financial statements, profit and loss projections, cash flow forecasts, balance sheet outputs, debt-related metrics, operating summaries, and key assumptions. Inputs are drawn from the model’s revenue, cost, payroll, startup, financing, and investment assumptions, while outputs are formatted for review by banks, credit teams, investors, partners, and advisors. This is useful because a well-structured report can make the difference between a rough idea and a financeable business case. For users preparing a loan application, investment memorandum, business plan, or internal approval package, bank-ready reports help communicate the financial plan clearly. They also allow users to identify weaknesses before presenting the project, such as thin cash reserves, excessive startup costs, weak margins, or unrealistic occupancy targets.
Revenue Breakdown
The revenue breakdown component gives users a detailed view of how total condo hotel revenue is built across different streams. A condo hotel may earn income from room rentals, food and beverage, parking, spa and wellness services, events, resort fees, management fees, or other guest services, and each stream may have different margins, growth rates, and operational requirements. This section helps users separate those sources so they can understand which parts of the business contribute most to revenue and profitability. Inputs may include room type pricing, occupancy assumptions, guest spending estimates, service utilization rates, pricing per service, and monthly or annual growth assumptions. Outputs may show revenue by category, revenue mix, monthly and annual totals, and the contribution of each stream to overall performance. This is useful for planning because it highlights opportunities to improve the business model, such as increasing direct room revenue, expanding high-margin services, or adjusting underperforming ancillary offers. It is also valuable for budgeting and staffing because different revenue streams may require different labor, inventory, marketing, and operating cost assumptions.
KPI Dashboard
The KPI dashboard component helps users monitor performance through the most relevant condo hotel metrics and benchmarks. While financial statements show the final results, key performance indicators explain what is happening operationally. This section may track occupancy rate, average daily rate, revenue per available room, total revenue, EBITDA, profit margin, cash balance, payroll as a percentage of revenue, operating expense ratios, ancillary revenue per guest, return on equity, and other hospitality-focused performance measures. Inputs come from the model’s operational and financial assumptions, while outputs provide an accessible performance view for owners, managers, analysts, and investors. The KPI dashboard is useful because it helps users evaluate whether the project is performing in line with expectations and industry standards. It can also support management decisions by identifying where performance needs attention, such as low occupancy, weak ADR, rising payroll costs, or insufficient ancillary revenue. For stakeholder presentations, the KPI dashboard helps simplify the discussion by focusing on the metrics that matter most for growth, profitability, liquidity, and long-term investment performance.
Break-Even Analysis
The break-even analysis component helps users identify when the condo hotel may generate enough revenue to cover its fixed and variable operating costs. This is a critical planning tool because profitability depends not only on total revenue but also on the relationship between occupancy, room rates, service income, payroll, commissions, supplies, property costs, and other operating expenses. Users may input fixed costs such as insurance, software, base staffing, utilities, management fees, maintenance, marketing retainers, and administrative expenses, along with variable costs such as OTA commissions, housekeeping supplies, guest amenities, food and beverage cost of sales, and transaction fees. The model can then estimate the revenue level, occupancy level, or timing required to reach break-even. This output is useful for founders and investors because it shows how much operating activity is needed before the business becomes self-sustaining. It also supports pricing, launch planning, and risk management by showing how changes in ADR, occupancy, or cost structure can accelerate or delay profitability. For lenders, break-even analysis helps demonstrate whether the project has a realistic path to covering operating obligations.
Startup Costs and Operating Expense Planning
The startup costs and operating expense planning component helps users estimate both the initial investment required before launch and the ongoing cost structure needed to operate the condo hotel. Startup costs may include common area furniture, initial food and beverage kitchen equipment, spa and fitness equipment, technology setup, licenses, deposits, branding, pre-opening marketing, professional fees, opening inventory, and working capital reserves. Operating expenses may include payroll, housekeeping, utilities, property insurance, repairs and maintenance, software, booking platform fees, marketing, management expenses, supplies, and administrative costs. Users can customize these assumptions to match their location, property size, service level, staffing model, and opening timeline. The model can then calculate total startup funding needs, monthly operating costs, annual expense forecasts, cost ratios, and the impact of expenses on cash flow and profitability. This component is useful because underestimating startup costs or recurring expenses can create funding gaps even when revenue looks attractive. A clear cost plan helps users budget more accurately, prepare investor and lender discussions, and make better decisions about when to hire staff, invest in amenities, expand services, or control expenses during slower demand periods.
File types:
Excel – Single-User: .xlsx
Excel – Multi-User: .xlsx
Similar ProductsOther customers were also interested in...


 anthony
Real Estate Development Bundle
This Real Estate Development Bundle is a collection of real estate calculators or tools in MS Excel ... Read more

Hotel/Guesthouse/Resort Development Model and Valu...
This Hotel / Holiday Resort Development Model will take you through a 20-year period of Three Statem... Read more
 Andreas
Real Estate Bundle 2 (6 models)
Planning to start a real estate endeavor but don’t know the financial implications of your investm... Read more

 Giorgos
Real Estate Development Financial Models Bundle
A collection of seven Real Estate Development Financial Models offered at a discounted price you can... Read more

Real Estate Acquisition Financial Models Bundle
A collection of six Real Estate Development Financial Models offered at a discounted price you can�... Read more
 HenrySheykin
Vacation Rentals Hotel Financial Model Excel Templ...
The Vacation Rental Financial Model helps users turn a short-term rental concept, property managemen... Read more
Condominium Development REFM Financial Model Excel...
The Condo Development Financial Model helps developers, investors, analysts, consultants, and busine... Read more
Hotel Development REIT Financial Model Excel Templ...
The Hotel Development Financial Model helps users evaluate a hotel construction or expansion project... Read more

Airbnb Financial Model
Air BnB Financial Model Template presents the business case of the purchase of up to 5 properties wi... Read more

 David
Property Development & Rental Financial Projec...
3-Statement 5-year rolling projection model with a valuation for new or existing business developing... Read more
You must log in to submit a review.