
0 ITEMS

Tea Store Financial Model Excel Template
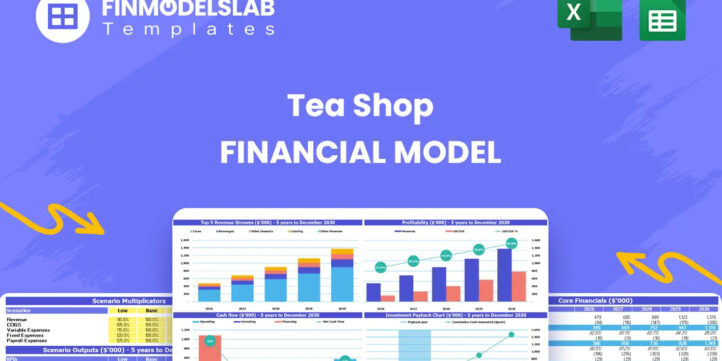
The Tea Shop Financial Model Financial Model Template helps entrepreneurs, founders, consultants, analysts, and business owners turn a tea shop concept into a structured financial forecast. Instead of relying on a generic spreadsheet, the template is designed around the real drivers of a tea shop business, including customer traffic, average order value, beverage and food mix, private events, cost of goods sold, staffing, startup investment, and ongoing operating expenses. It gives users a practical way to estimate revenue potential, understand cost behavior, and evaluate whether the business can become financially sustainable before committing major capital. Built for business planning, funding preparation, and internal decision-making, this template supports up to five years of projections and helps users connect assumptions with financial outcomes. You can adjust revenue assumptions, model weekday and weekend traffic patterns, estimate payroll, plan startup costs, forecast operating expenses, and review profitability over time. The model is useful for new tea shops, specialty tea cafes, tea lounges, bubble tea concepts, hybrid tea and food businesses, and existing operators planning expansion or seeking a clearer financial plan. The template also helps users think through cash flow, break-even analysis, and funding needs with more discipline. Tea shops often face upfront build-out costs, equipment purchases, inventory requirements, rent commitments, marketing expenses, and payroll obligations before revenue stabilizes. A structured financial model helps identify when cash may be tight, how much working capital may be needed, and what level of sales is required to cover fixed and variable costs. This makes it valuable for investor conversations, lender submissions, business plan documents, and owner-level planning. Because the Tea Shop Financial Model is editable and built for Excel and Google Sheets, users can tailor it to their location, pricing, menu strategy, staffing plan, and growth goals. The template saves time by providing a ready-made framework with connected formulas, financial statements, dashboards, charts, and performance metrics. It is designed to help users move beyond guesswork, test scenarios, compare outcomes, and make better decisions about launch timing, pricing, investment, hiring, marketing, and profitability.
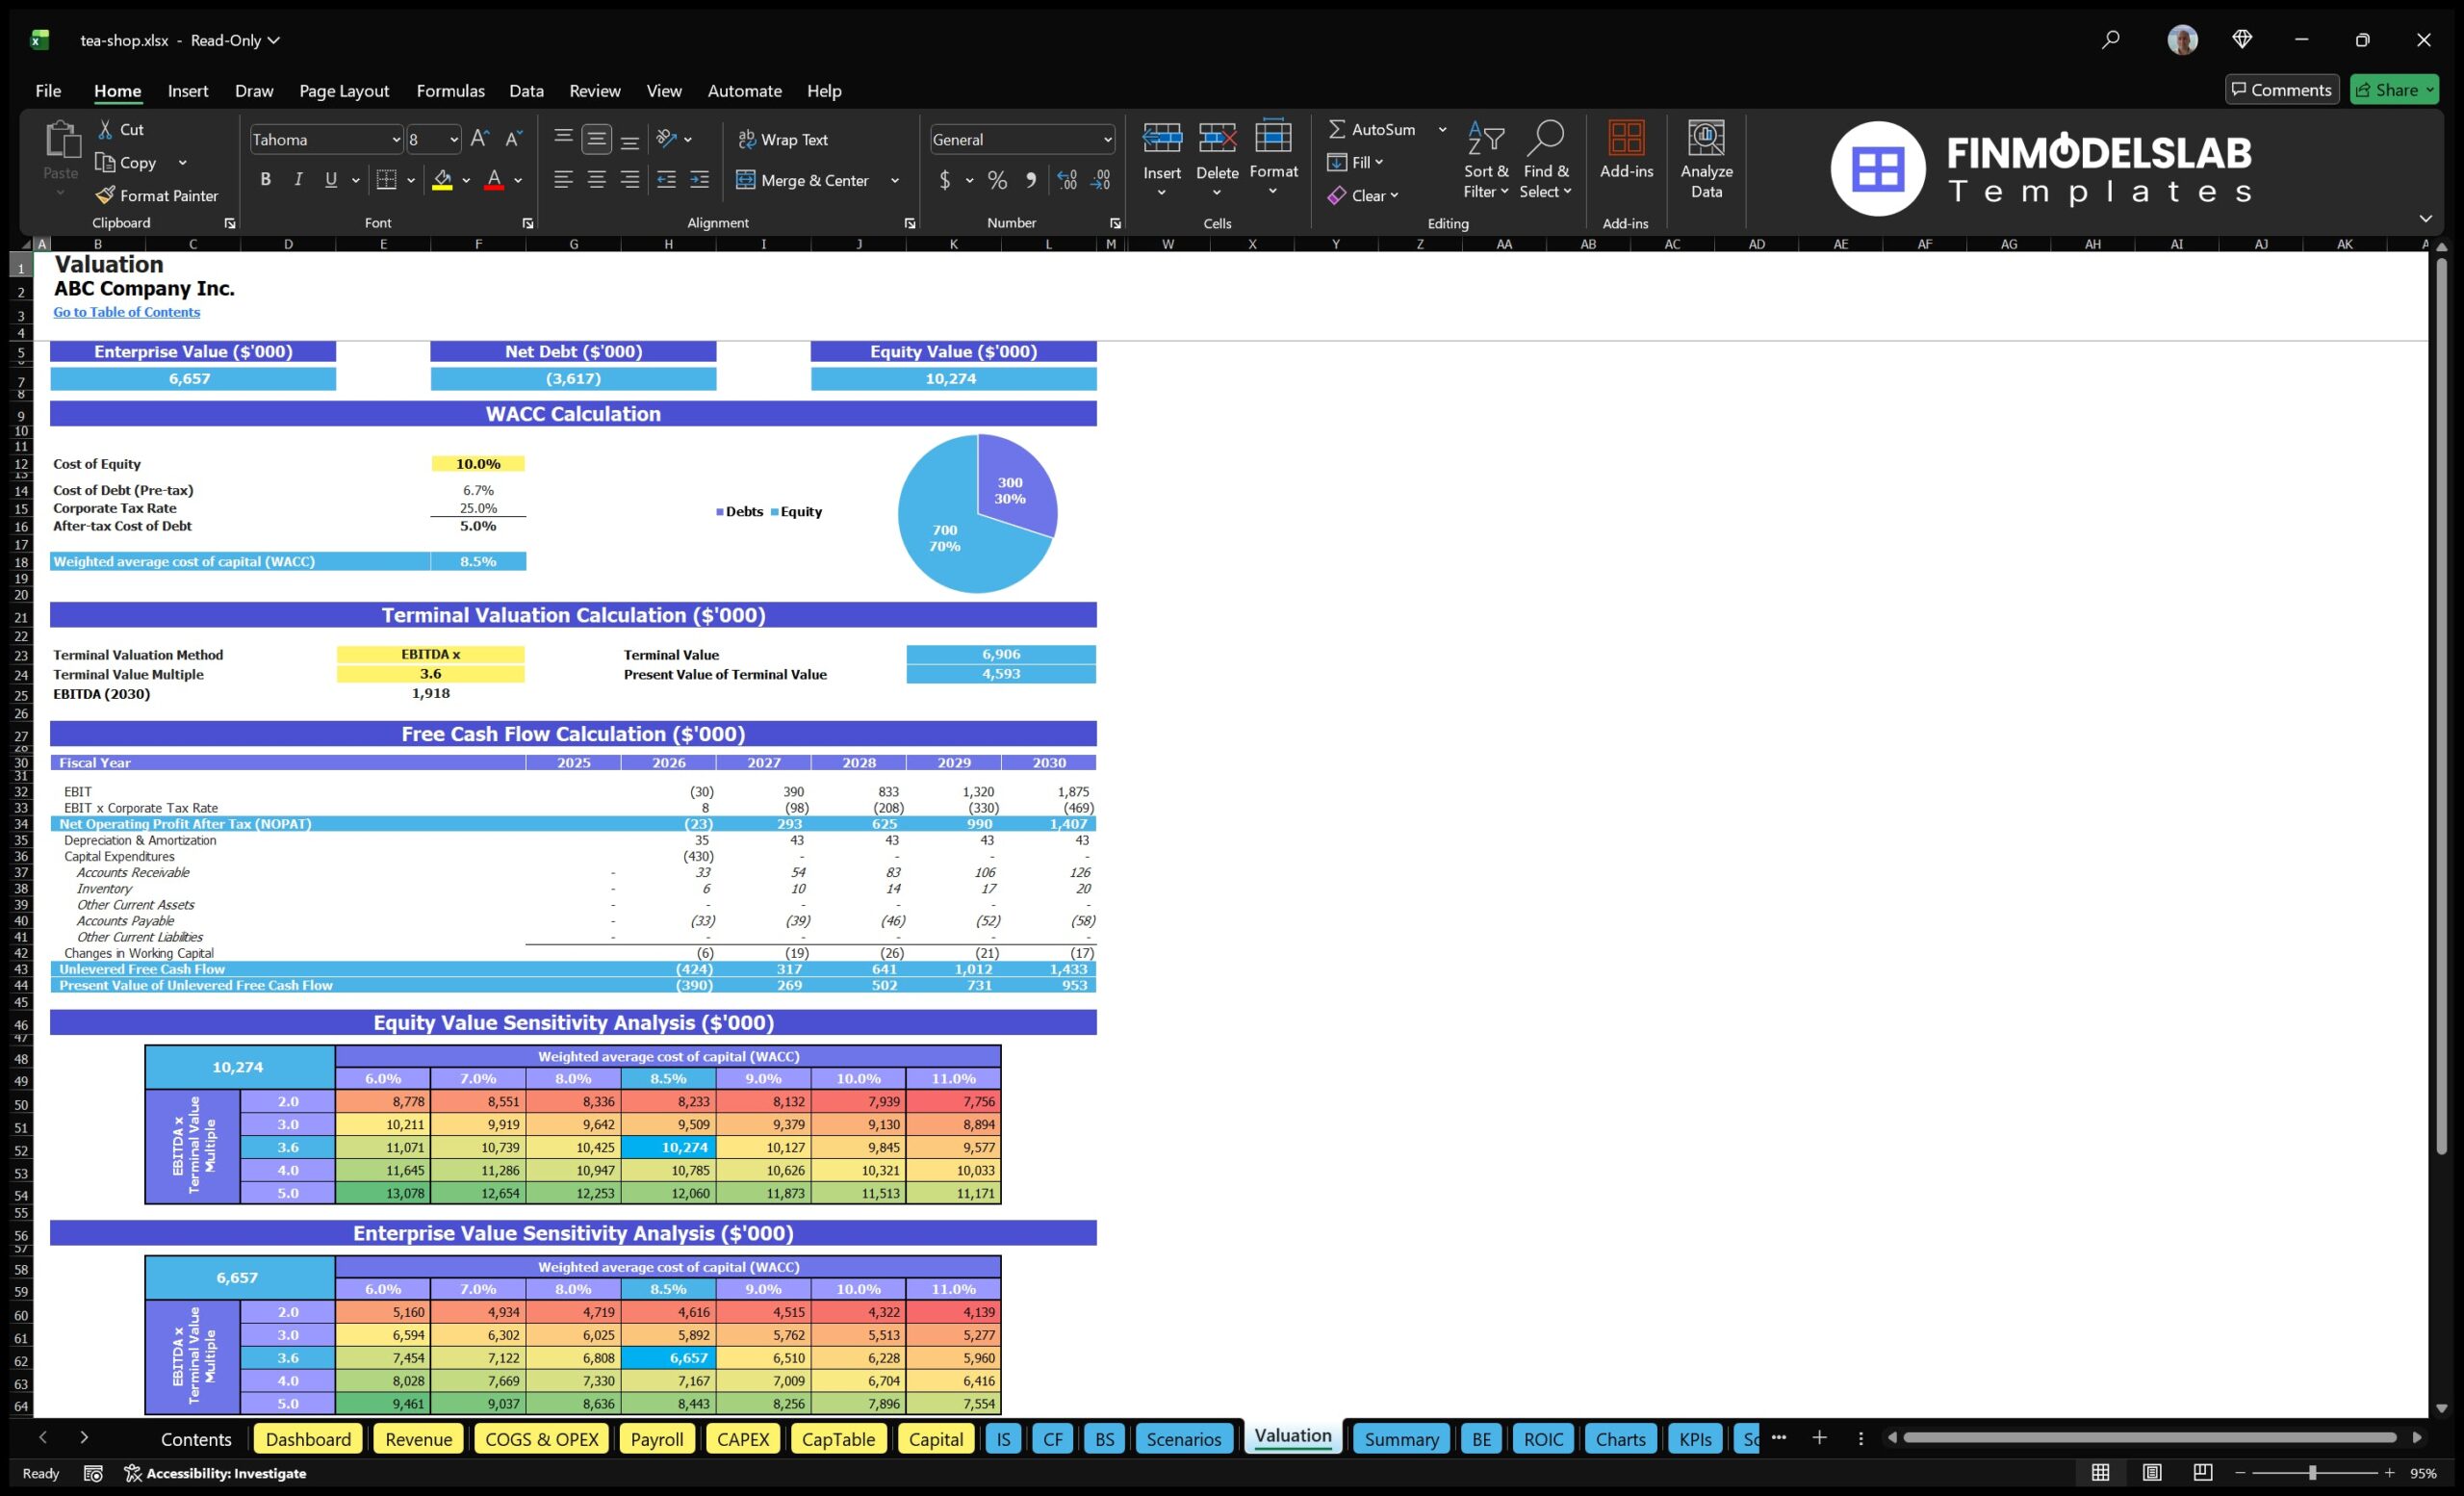
Financial Model Overview
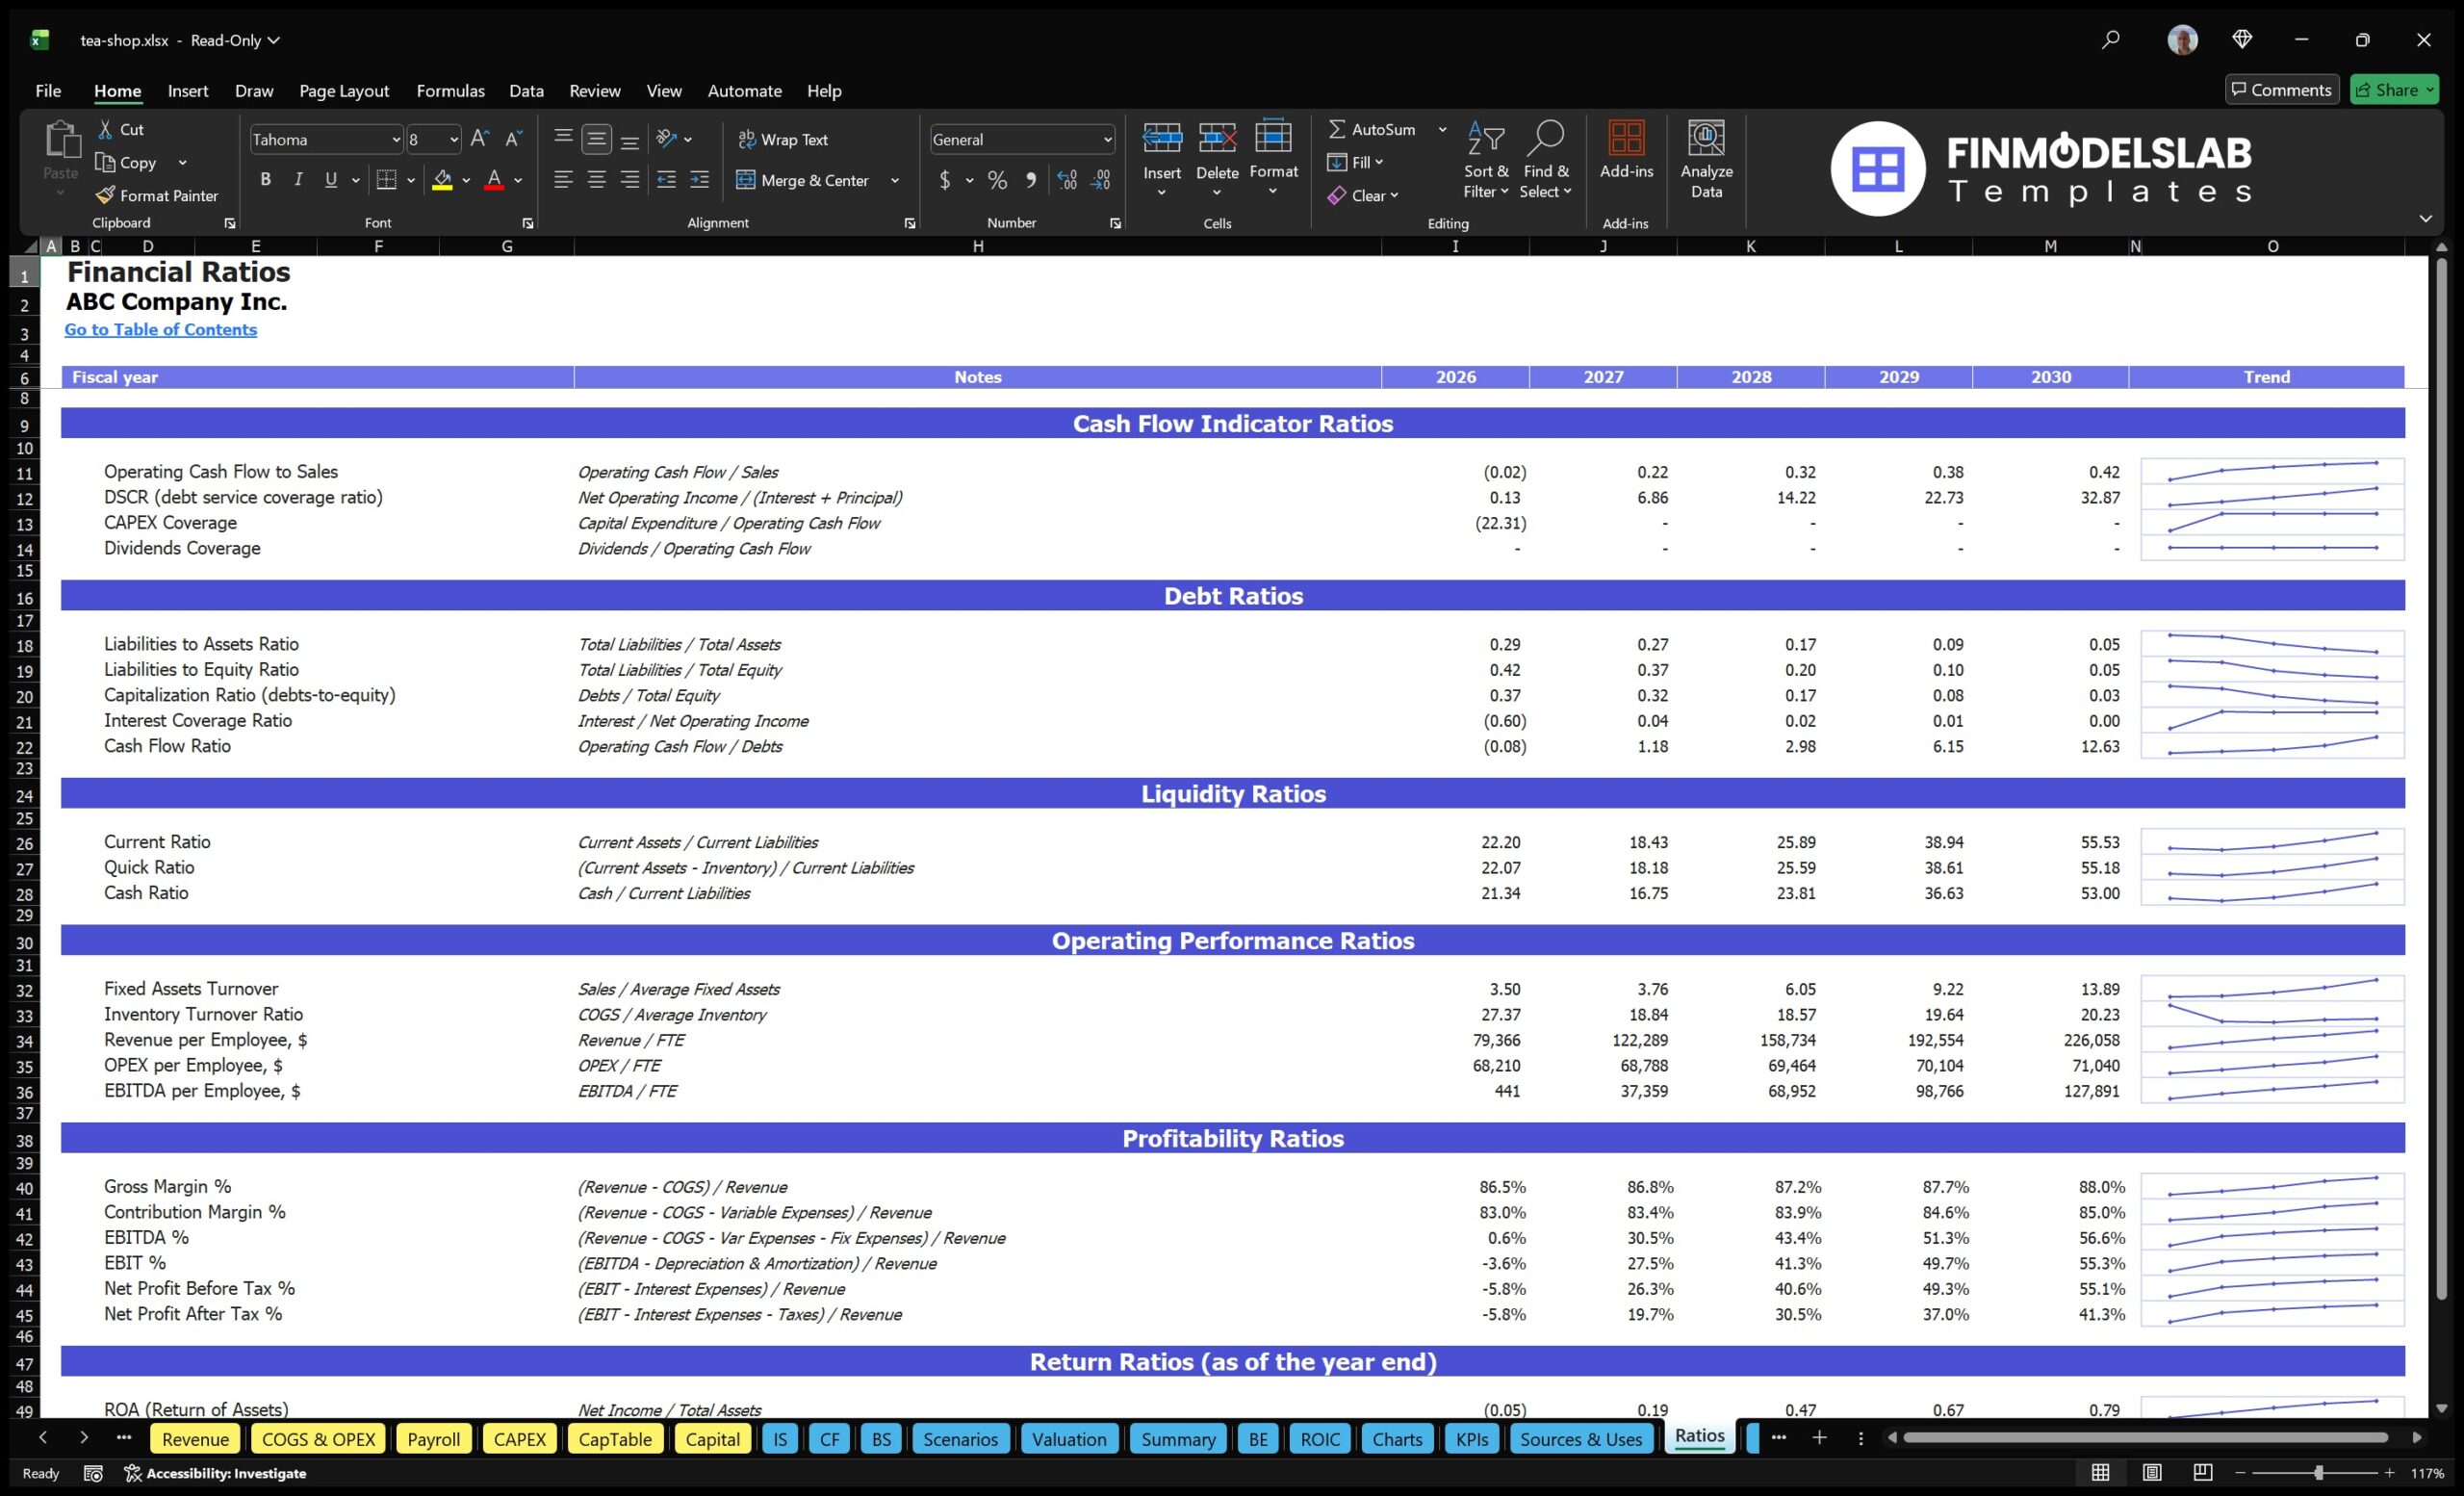
The Tea Shop Financial Model Financial Model Template is a ready-to-use planning tool created for entrepreneurs, business owners, consultants, analysts, and founders who need a structured way to forecast the financial performance of a tea shop. A tea shop is driven by specific operating assumptions, including daily customer traffic, average order value, beverage sales mix, food sales, private events, gross margin, staffing levels, rent, inventory costs, and launch expenses. This template brings those assumptions together in one editable model so users can estimate revenue, startup capital, operating expenses, cash flow, profitability, and investor returns over a multi-year period. It is useful for preparing a tea shop business plan, evaluating funding needs, presenting to lenders or investors, comparing launch scenarios, and making practical decisions before opening or expanding. Instead of building a spreadsheet from scratch, users can start from a professional framework designed around the economics of a tea shop and adjust the assumptions to match their own concept, location, pricing strategy, menu mix, and growth expectations.
All-in-One Dashboard
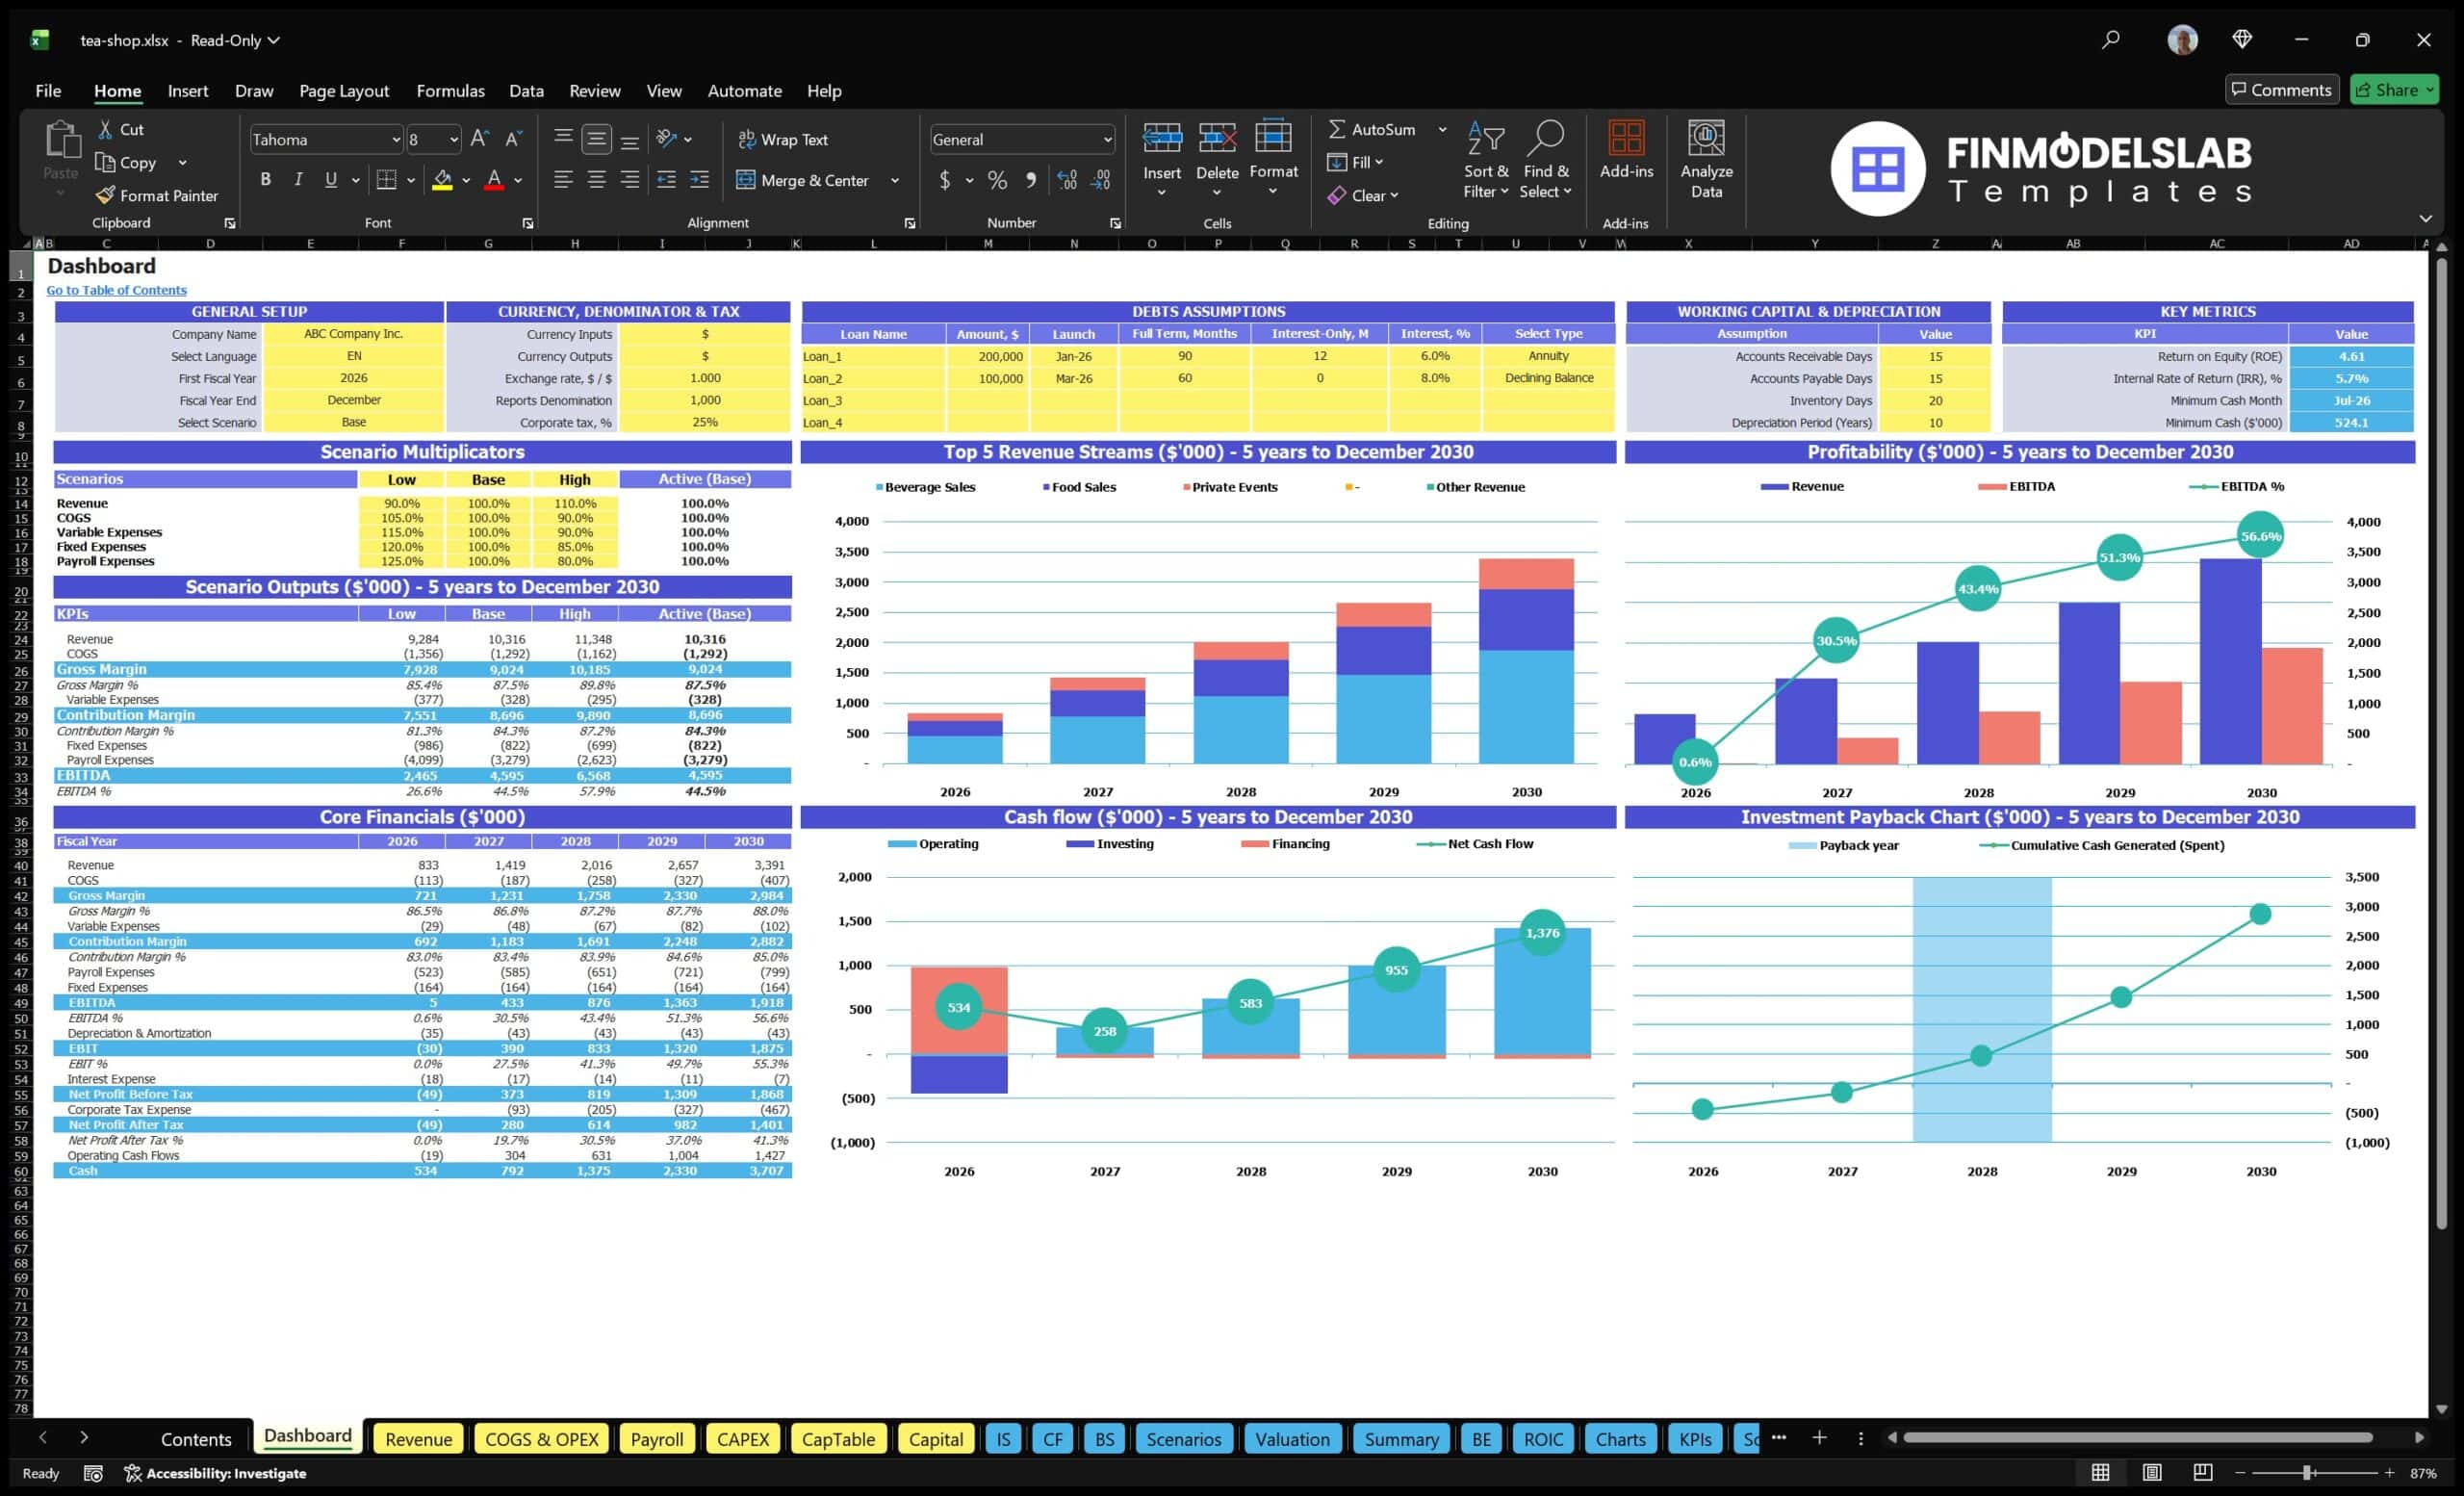
The all-in-one dashboard gives users a central view of the most important inputs and outputs in the Tea Shop Financial Model. It is designed to help users see the connection between assumptions and results without searching through multiple tabs or calculations. Core inputs may include customer volume, average ticket size, revenue stream mix, cost of goods sold, payroll assumptions, rent, startup investment, and other operating expenses. Core outputs may include total revenue, gross profit, EBITDA, net income, cash position, break-even timing, investment return, and funding requirements. This component is useful because tea shop planning involves many moving parts, from drink margins to staffing needs and lease commitments, and the dashboard brings the key numbers into one practical management view. For business owners, it provides a quick way to check whether the model still makes financial sense after changing assumptions. For consultants and analysts, it creates a clear summary that can be used in client reviews, funding discussions, and strategic planning meetings.
Low, Base, and High Scenario Analysis
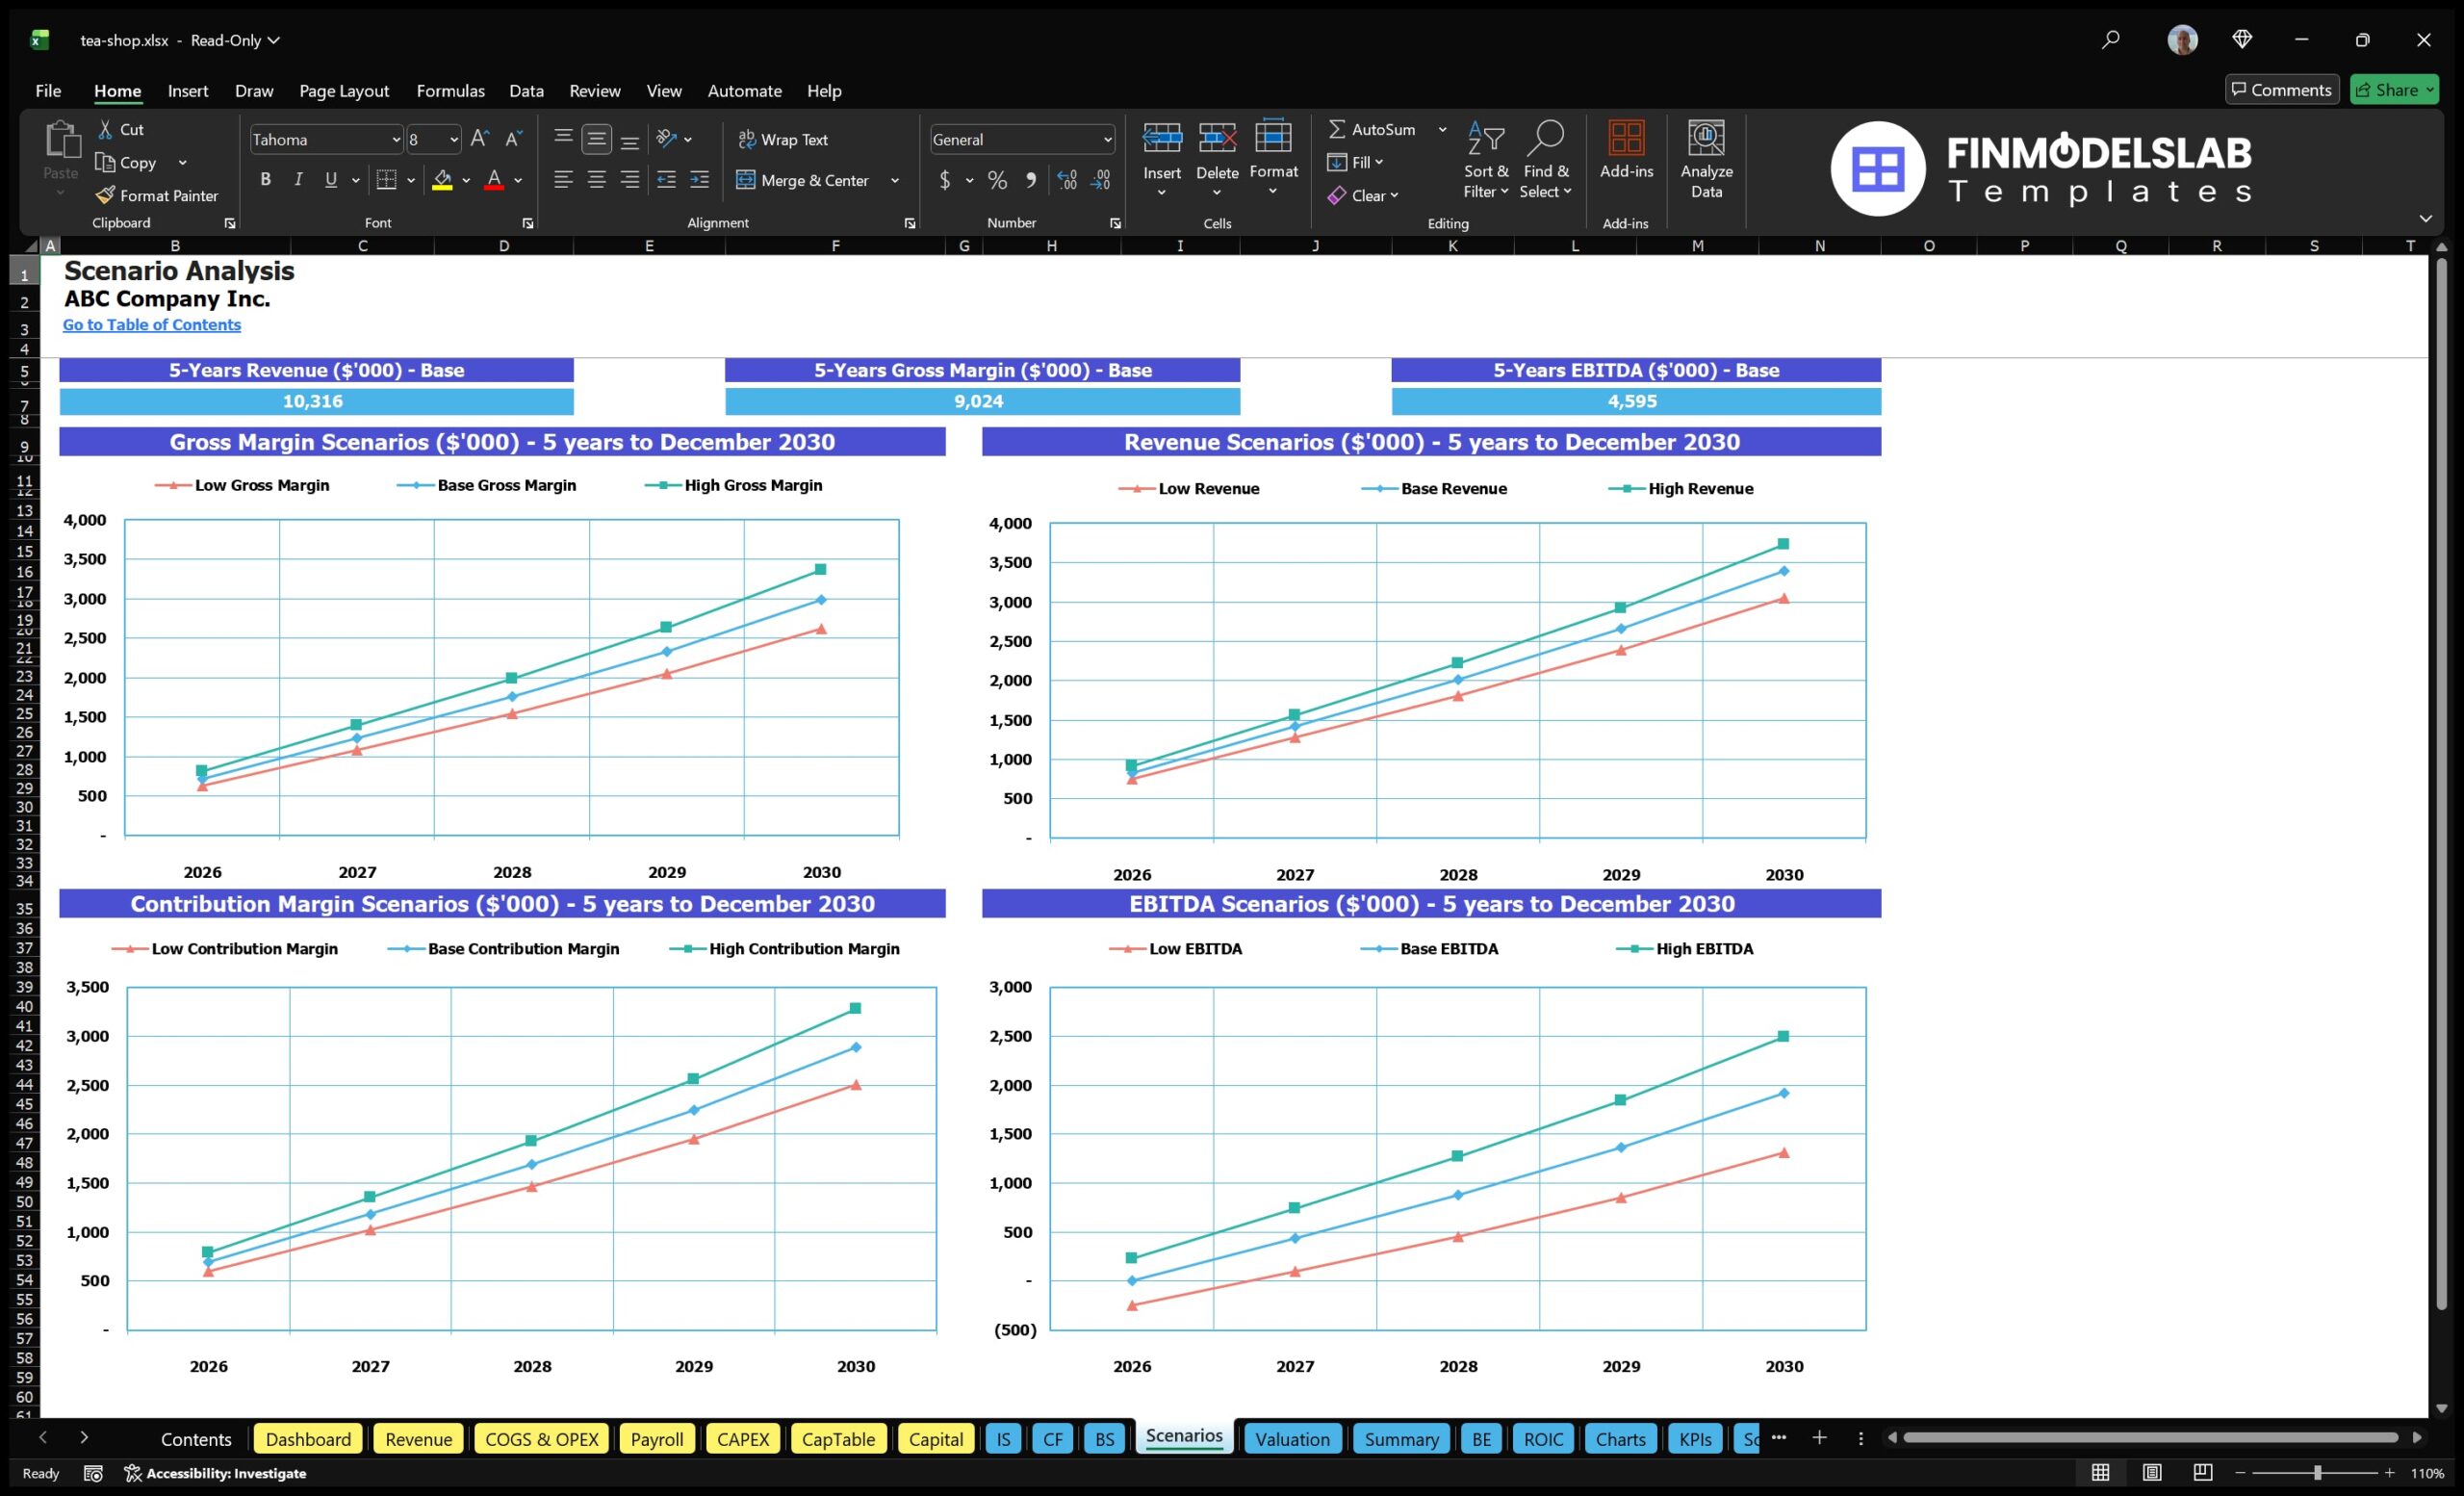
The low, base, and high scenario analysis component helps users test how the tea shop may perform under different business conditions. The base case can reflect the expected plan, while the low case can show the impact of weaker customer traffic, lower average order value, slower ramp-up, higher costs, or delays in reaching stable sales. The high case can show the potential upside from stronger weekend demand, successful marketing, higher private event bookings, improved beverage mix, or better pricing. Inputs may include changes to daily customer counts, weekday and weekend demand, average check size, revenue growth, cost percentages, staffing levels, and operating expenses. Outputs may show how each scenario affects revenue, gross margin, cash flow, EBITDA, net profit, payback period, and break-even timing. This component is especially useful for decision-making because a tea shop owner rarely operates in a perfectly predictable environment. By comparing low, base, and high outcomes, users can understand risk, prepare contingency plans, evaluate whether enough working capital is available, and present a more credible forecast to investors or lenders.
Professional Charts
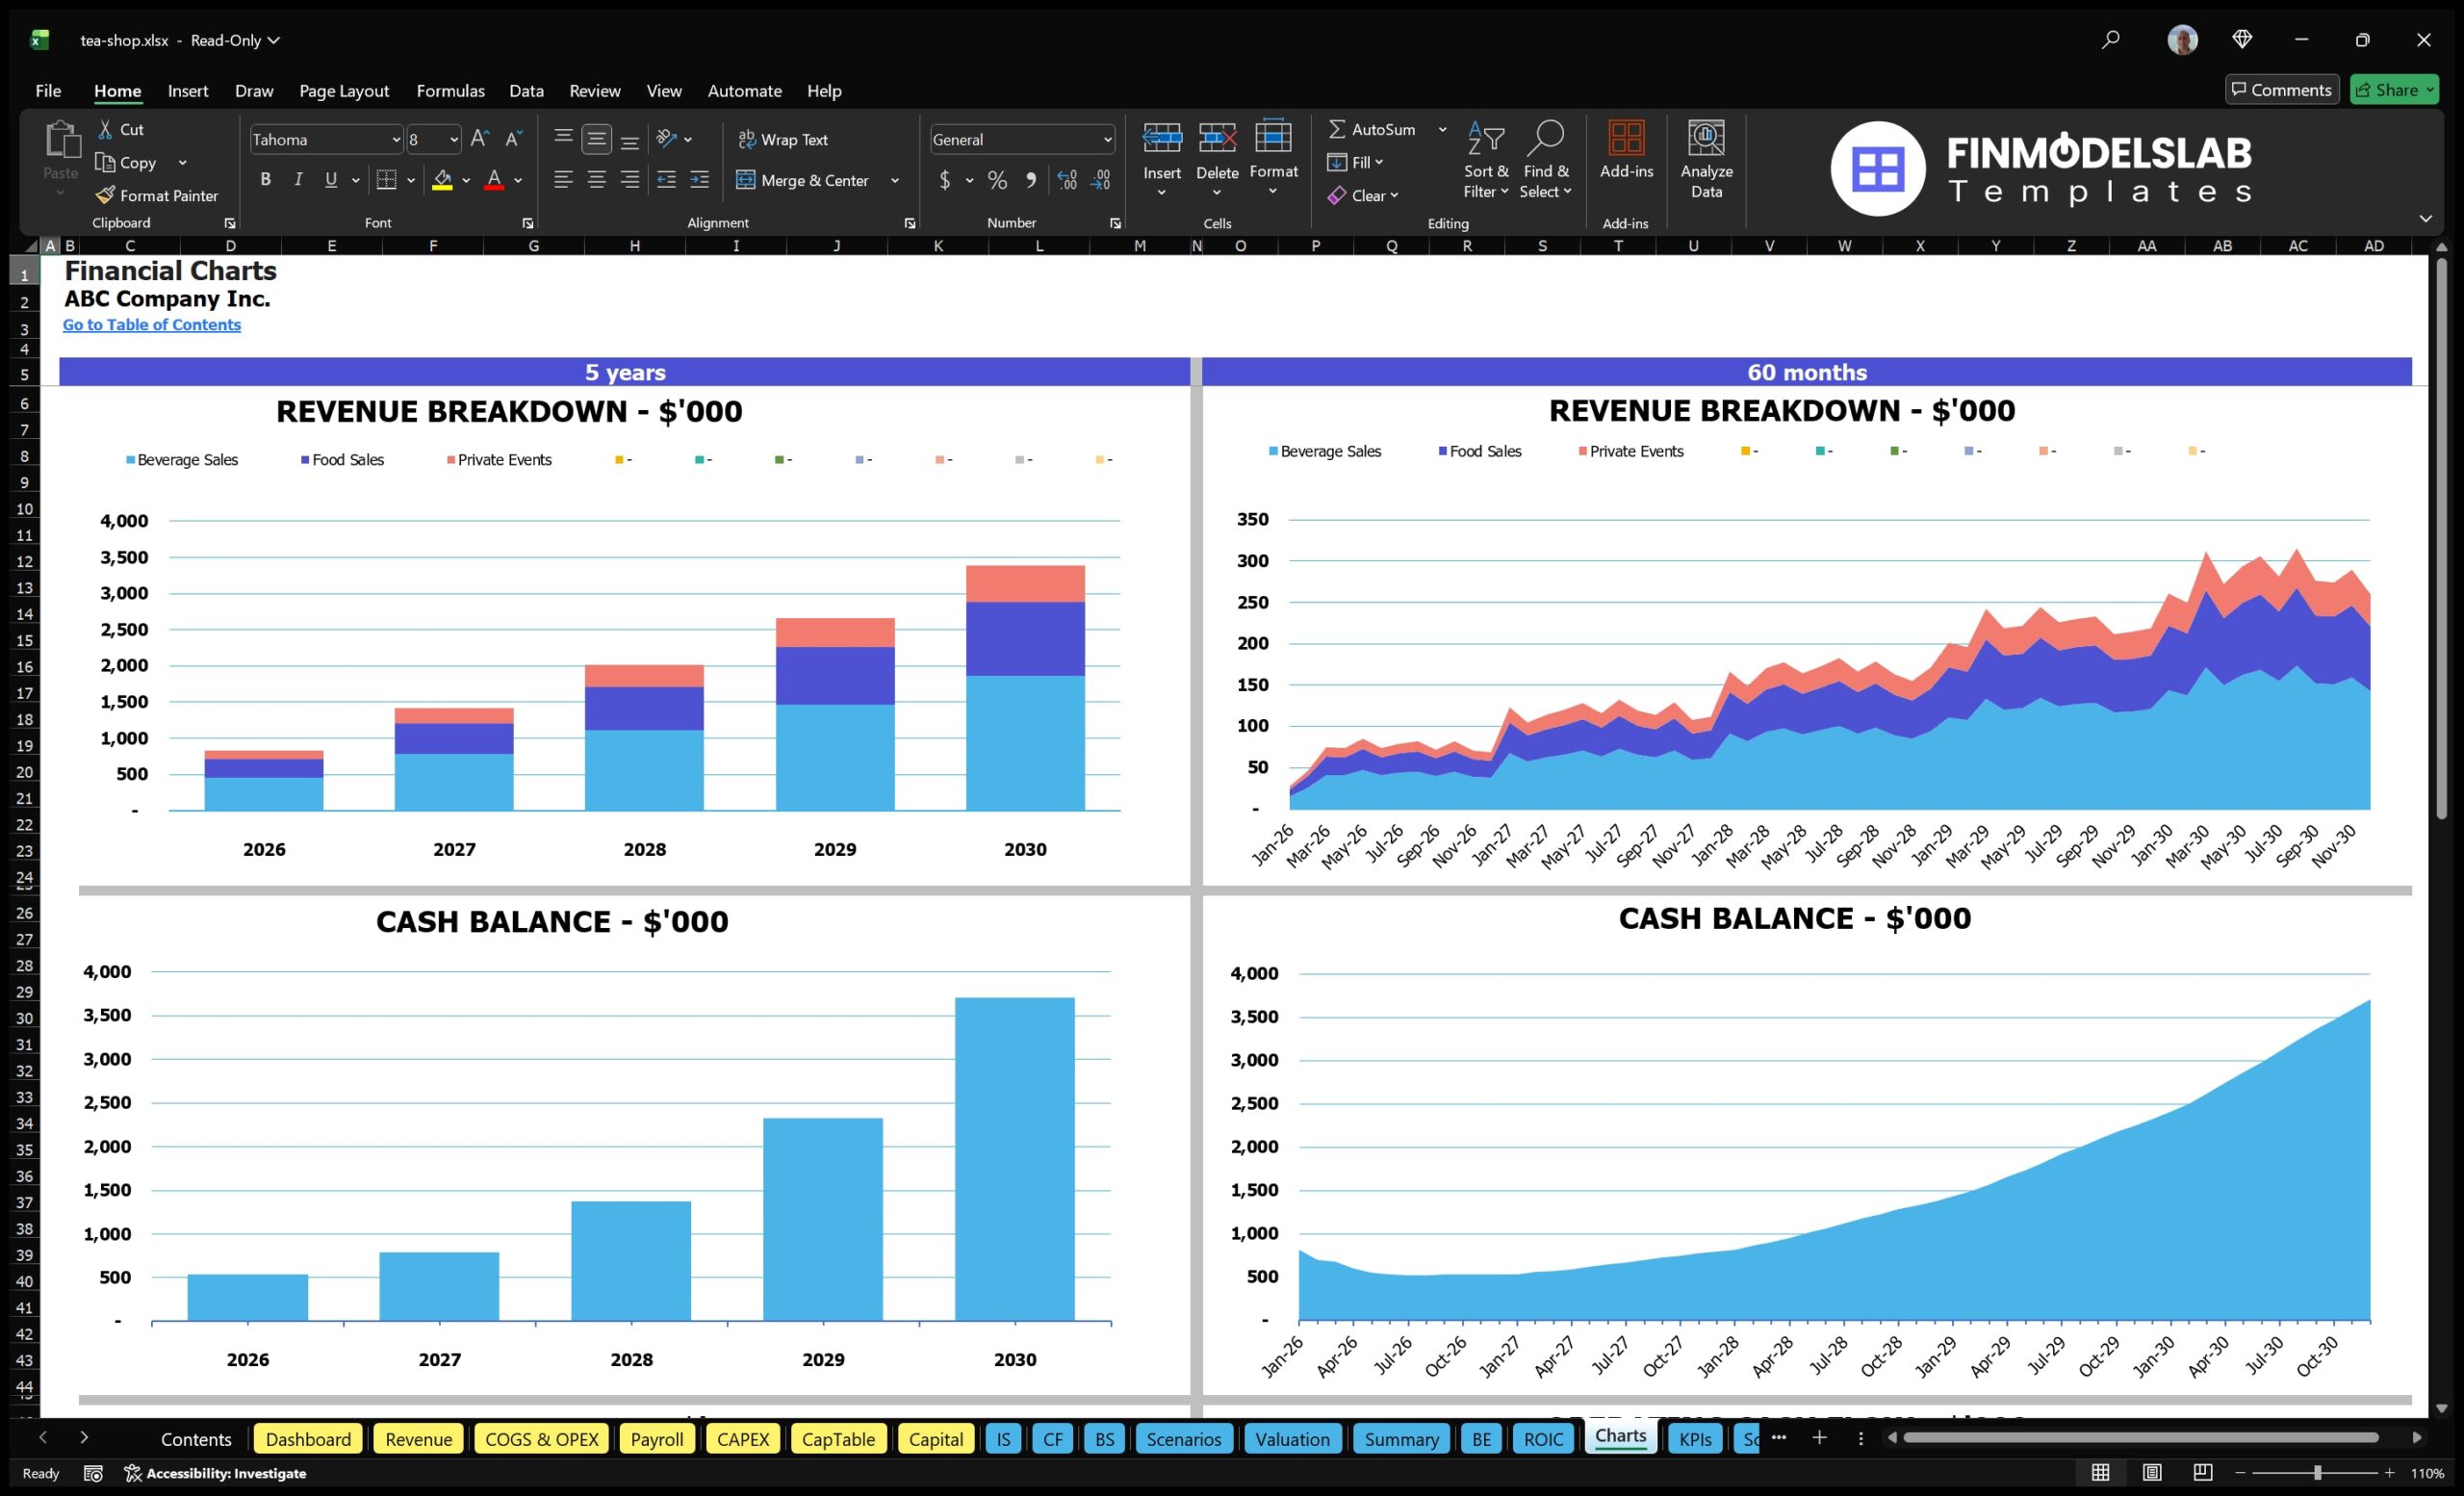
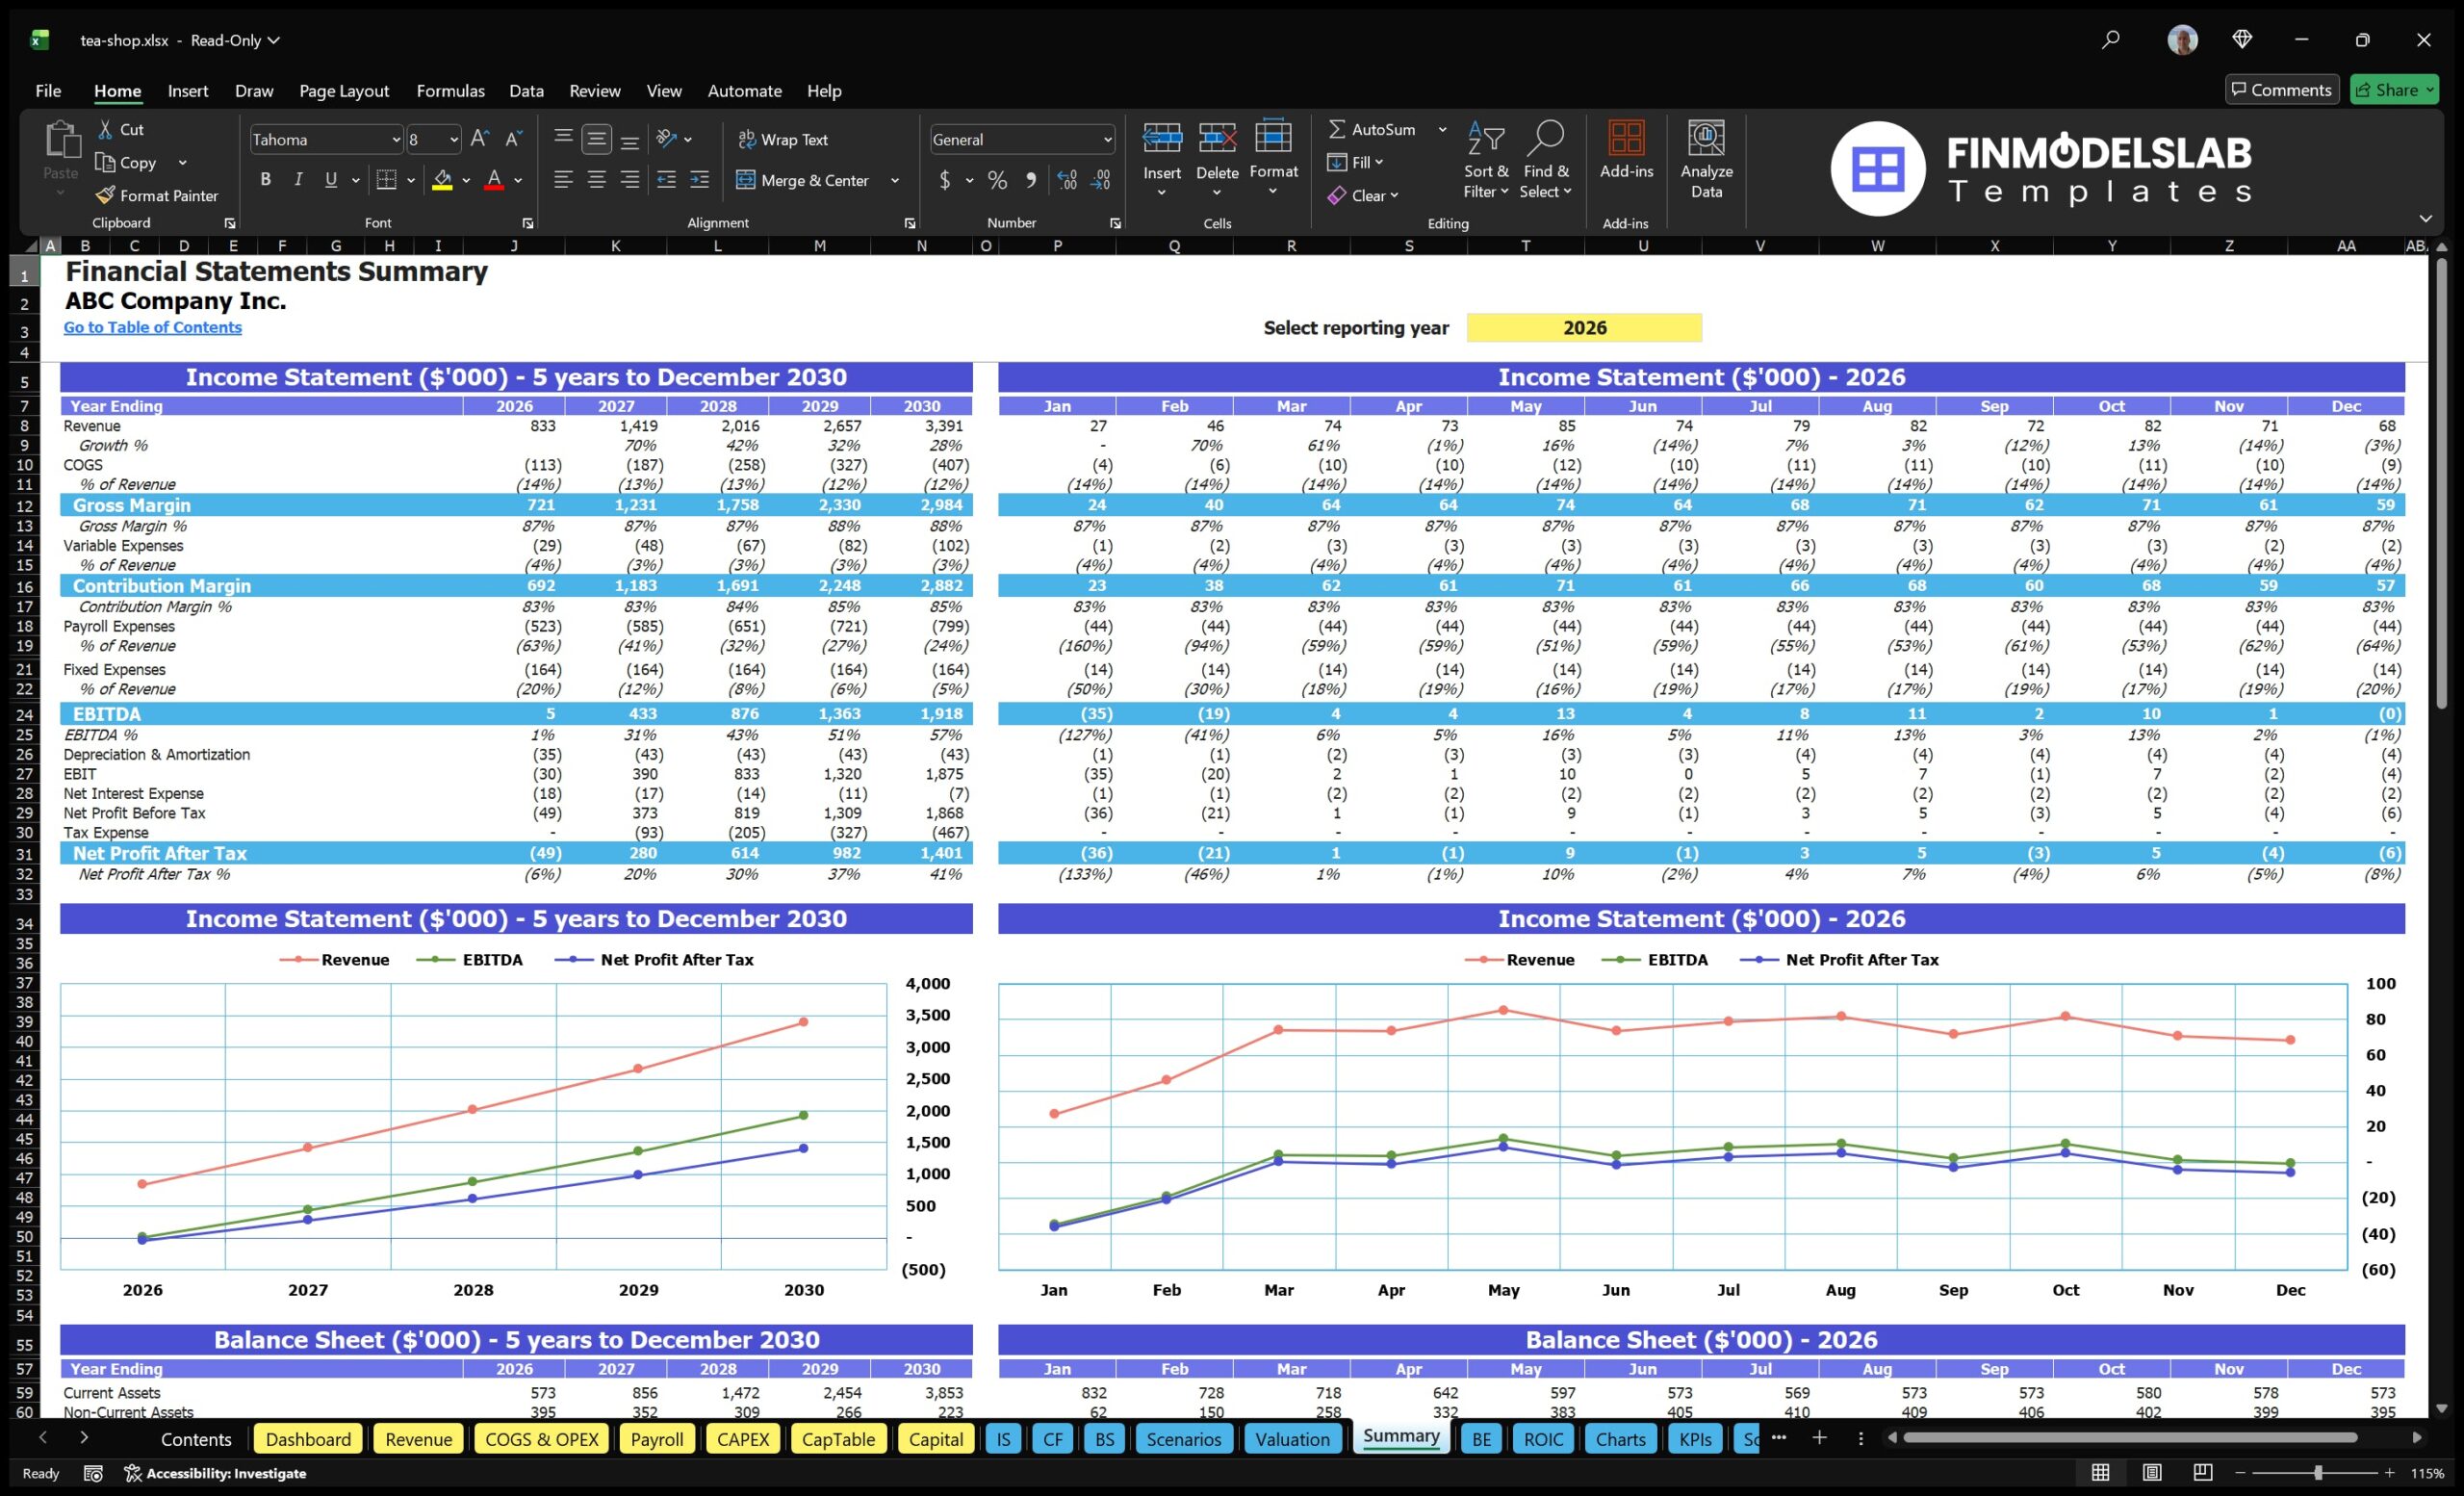
The professional charts component turns financial data into clear visual reports that are easier to review, explain, and present. A tea shop forecast can include many detailed figures, but stakeholders often need to understand the overall story quickly, such as whether revenue is growing, margins are improving, cash is sufficient, and profitability is trending in the right direction. This component may visualize monthly and annual revenue, gross profit, EBITDA, cash flow, expense categories, investment recovery, and key operating metrics. The charts are useful for identifying trends and potential issues that may not be obvious in raw spreadsheet tables. For example, a chart may show whether cash dips during the early launch months, whether labor costs are increasing faster than sales, or whether beverage sales are driving most of the margin improvement. For investor presentations, bank meetings, partner discussions, and internal planning, professional charts help communicate the financial plan in a polished and accessible way. They also support better owner-level decision-making by making complex numbers easier to interpret at a glance.
ROE Components and DuPont Analysis
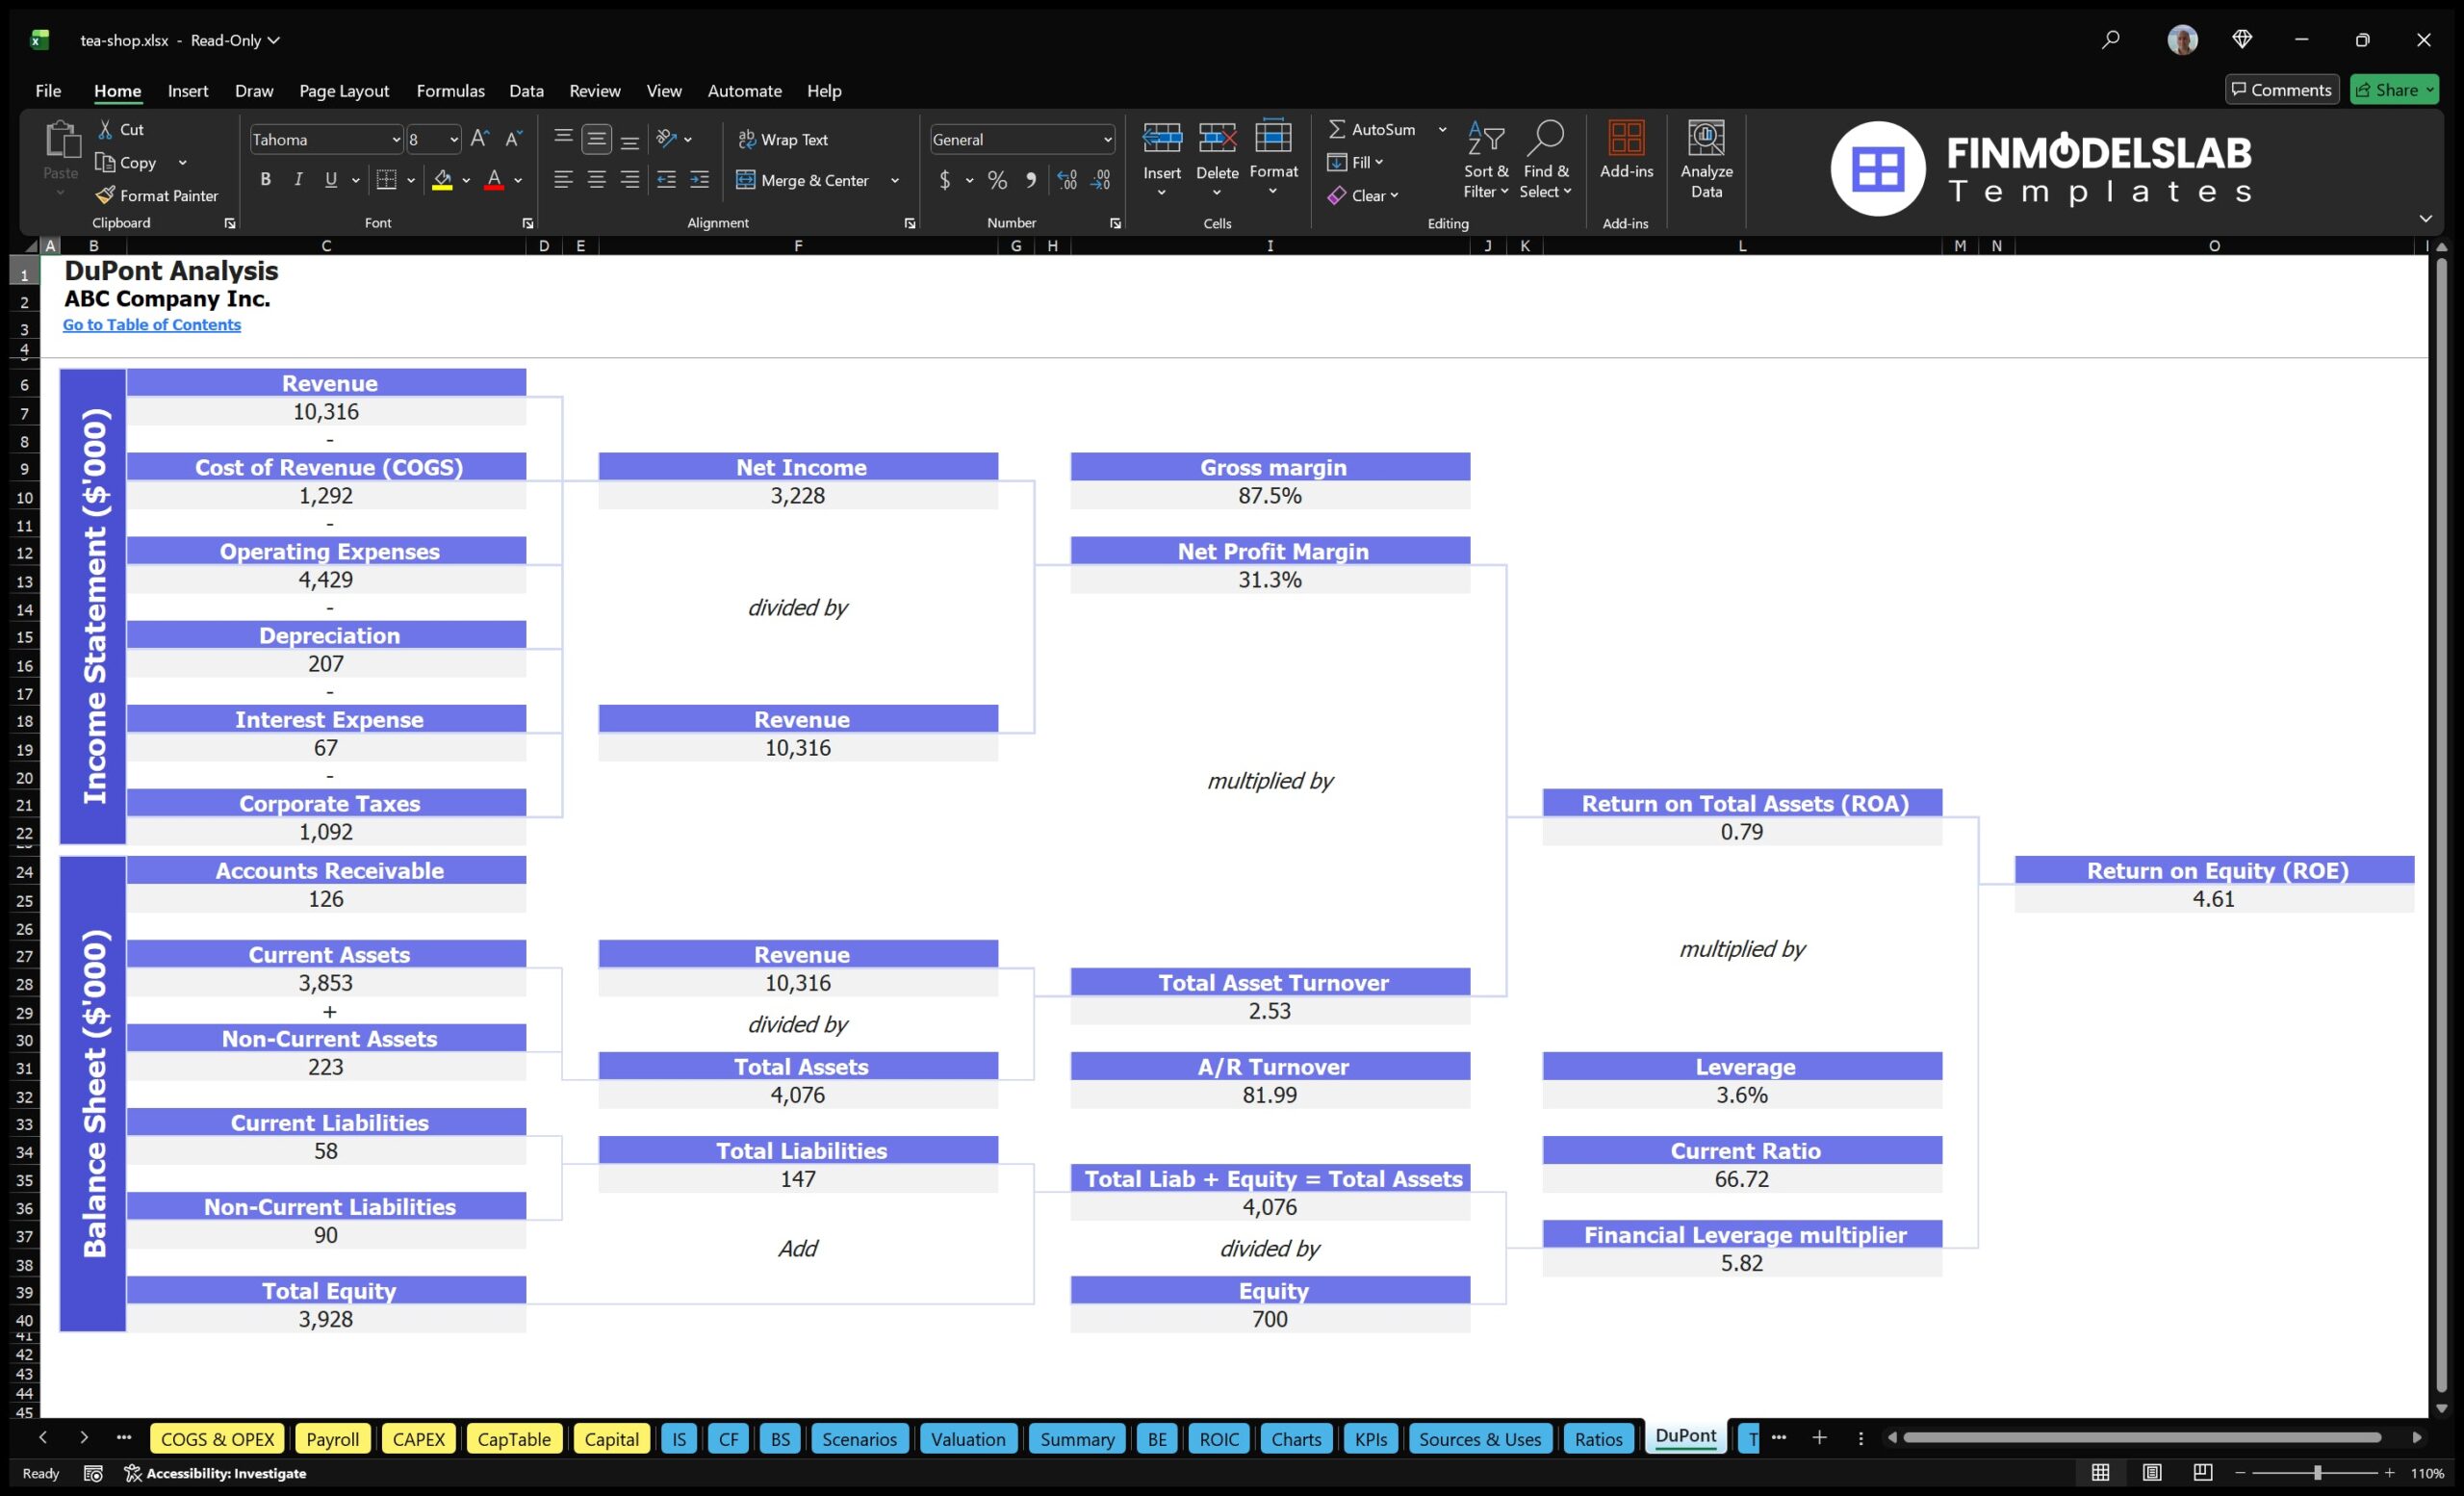
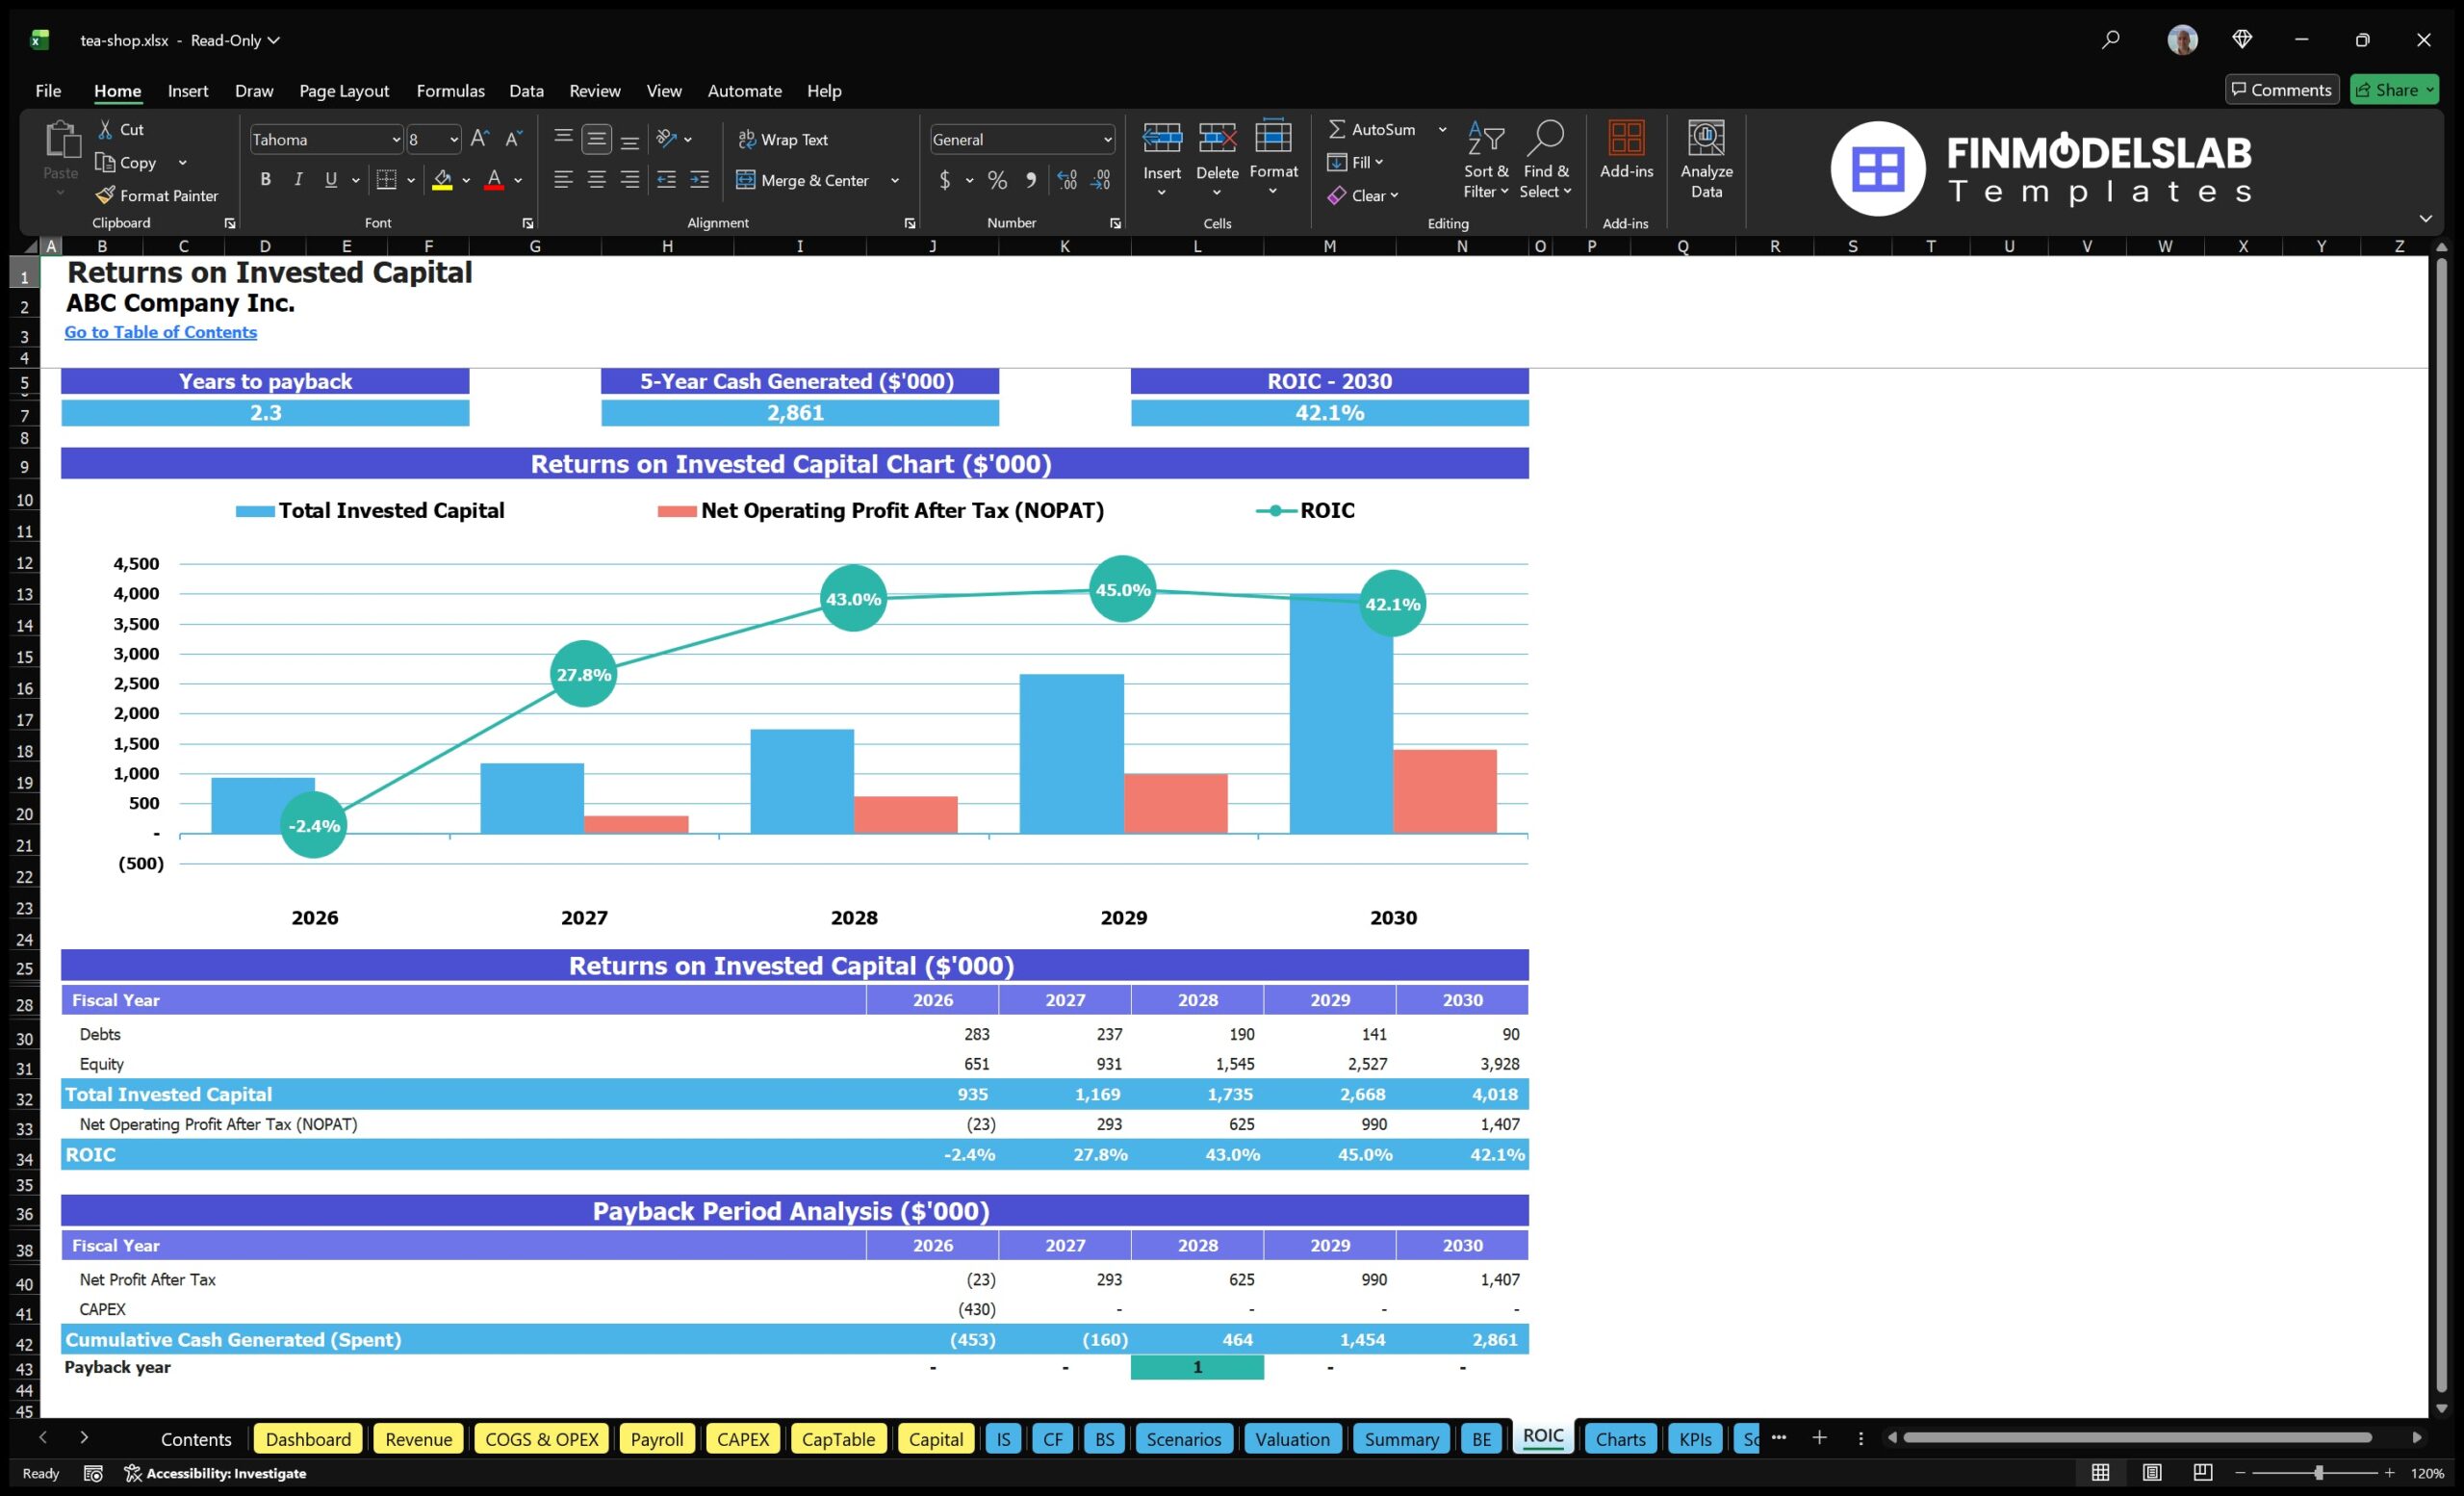
The ROE components and DuPont analysis section helps users understand what is driving return on equity in the Tea Shop Financial Model. Rather than showing return as a single figure, this component breaks it into underlying drivers such as profitability, asset efficiency, and financial leverage. Inputs may include net income, revenue, total assets, equity investment, debt assumptions, and balance sheet projections. Outputs may help users see whether returns are being influenced more by operating margins, revenue generation from assets, or the capital structure used to fund the business. This is useful for a tea shop because owners and investors need to understand whether the business is creating returns through healthy operations or simply relying on financing structure. A tea shop with strong revenue but weak margins may produce a different return profile than one with disciplined costs and efficient asset use. This component supports investor analysis, management review, and strategic decisions about pricing, cost control, reinvestment, and financing. It also adds a level of financial sophistication that can make the plan more credible for stakeholders who expect deeper performance analysis.
Revenue Inputs
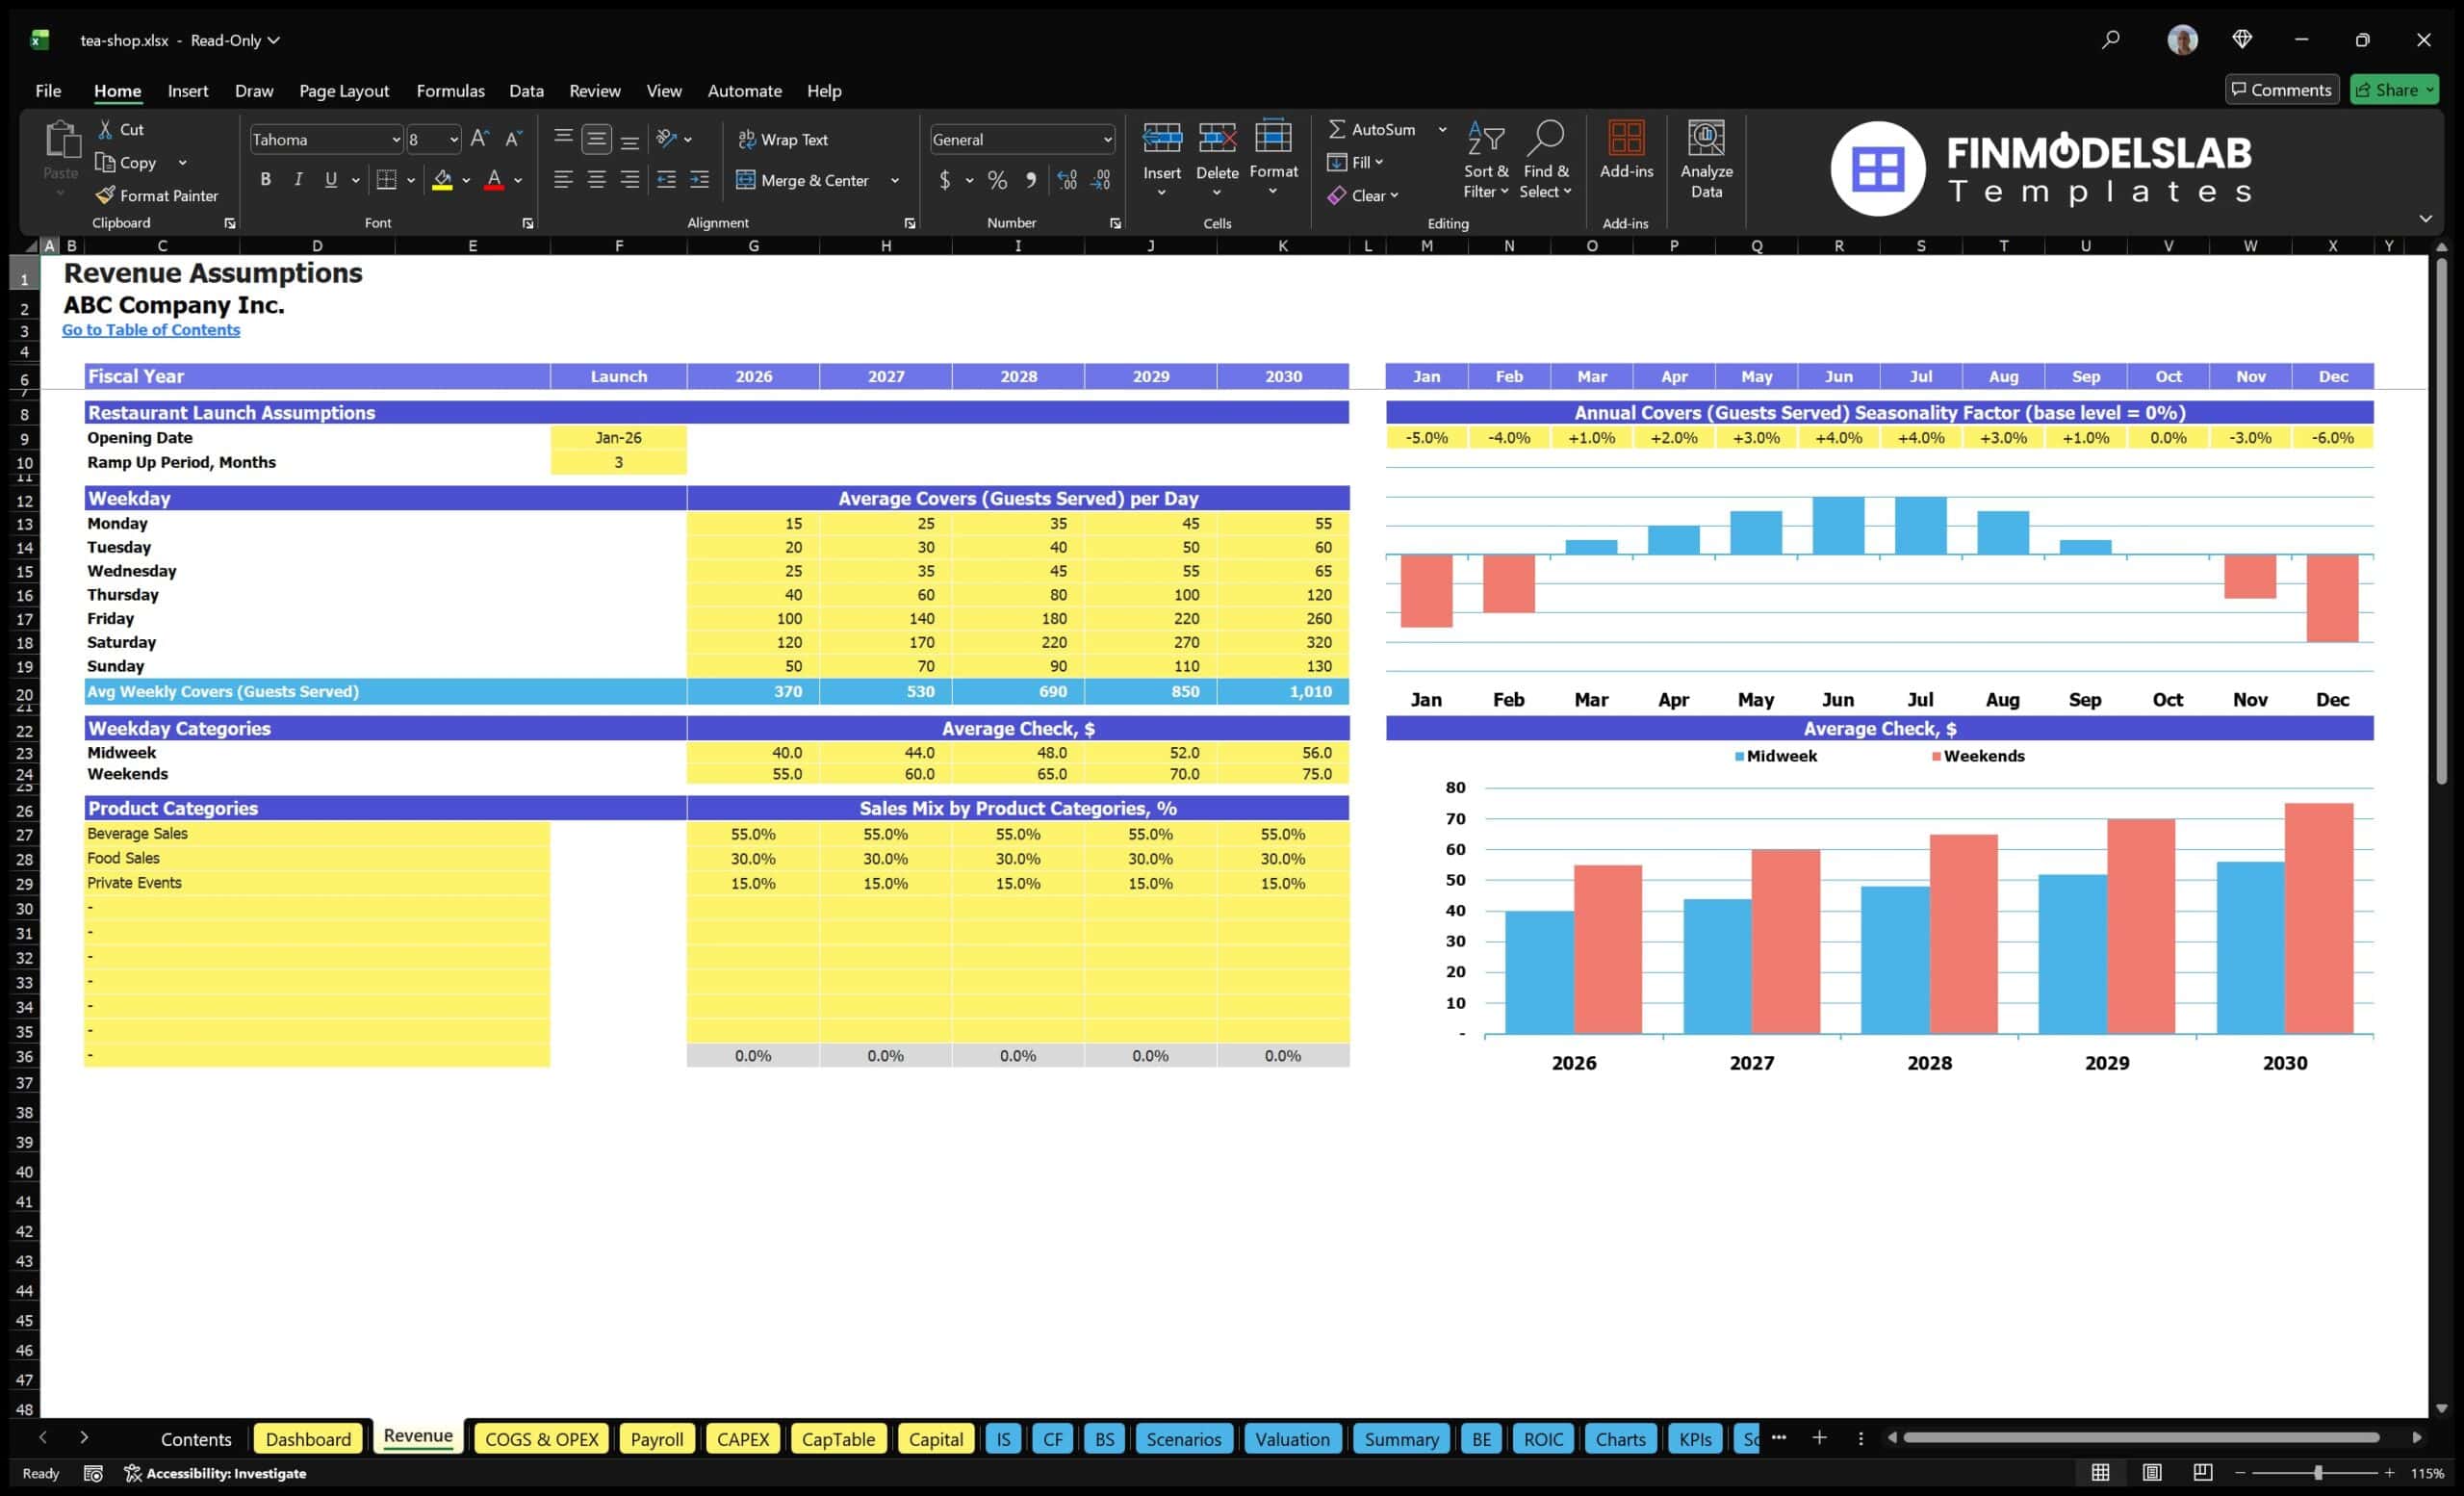
The revenue inputs component is where users define the assumptions that drive tea shop sales. Instead of using a single generic revenue line, the Tea Shop Financial Model is structured around the operating factors that matter for a physical tea business, such as daily customer volume, weekday versus weekend traffic, average order value, beverage sales, food sales, private events, and potential additional revenue streams. Users can adjust customer counts, pricing, growth rates, mix percentages, and sales assumptions to reflect their location, concept, opening schedule, marketing plan, and customer base. Outputs from this component feed into the revenue forecast, profitability analysis, cash flow forecast, and financial statements. This section is useful because small changes in customer traffic or average ticket size can significantly affect the viability of a tea shop. For example, a modest improvement in weekend traffic or a stronger mix of high-margin beverages may improve profitability much faster than expected. By building revenue from clear assumptions, users can explain their forecast more confidently and test whether their planned pricing and customer targets are realistic.
Bank-Ready Reports
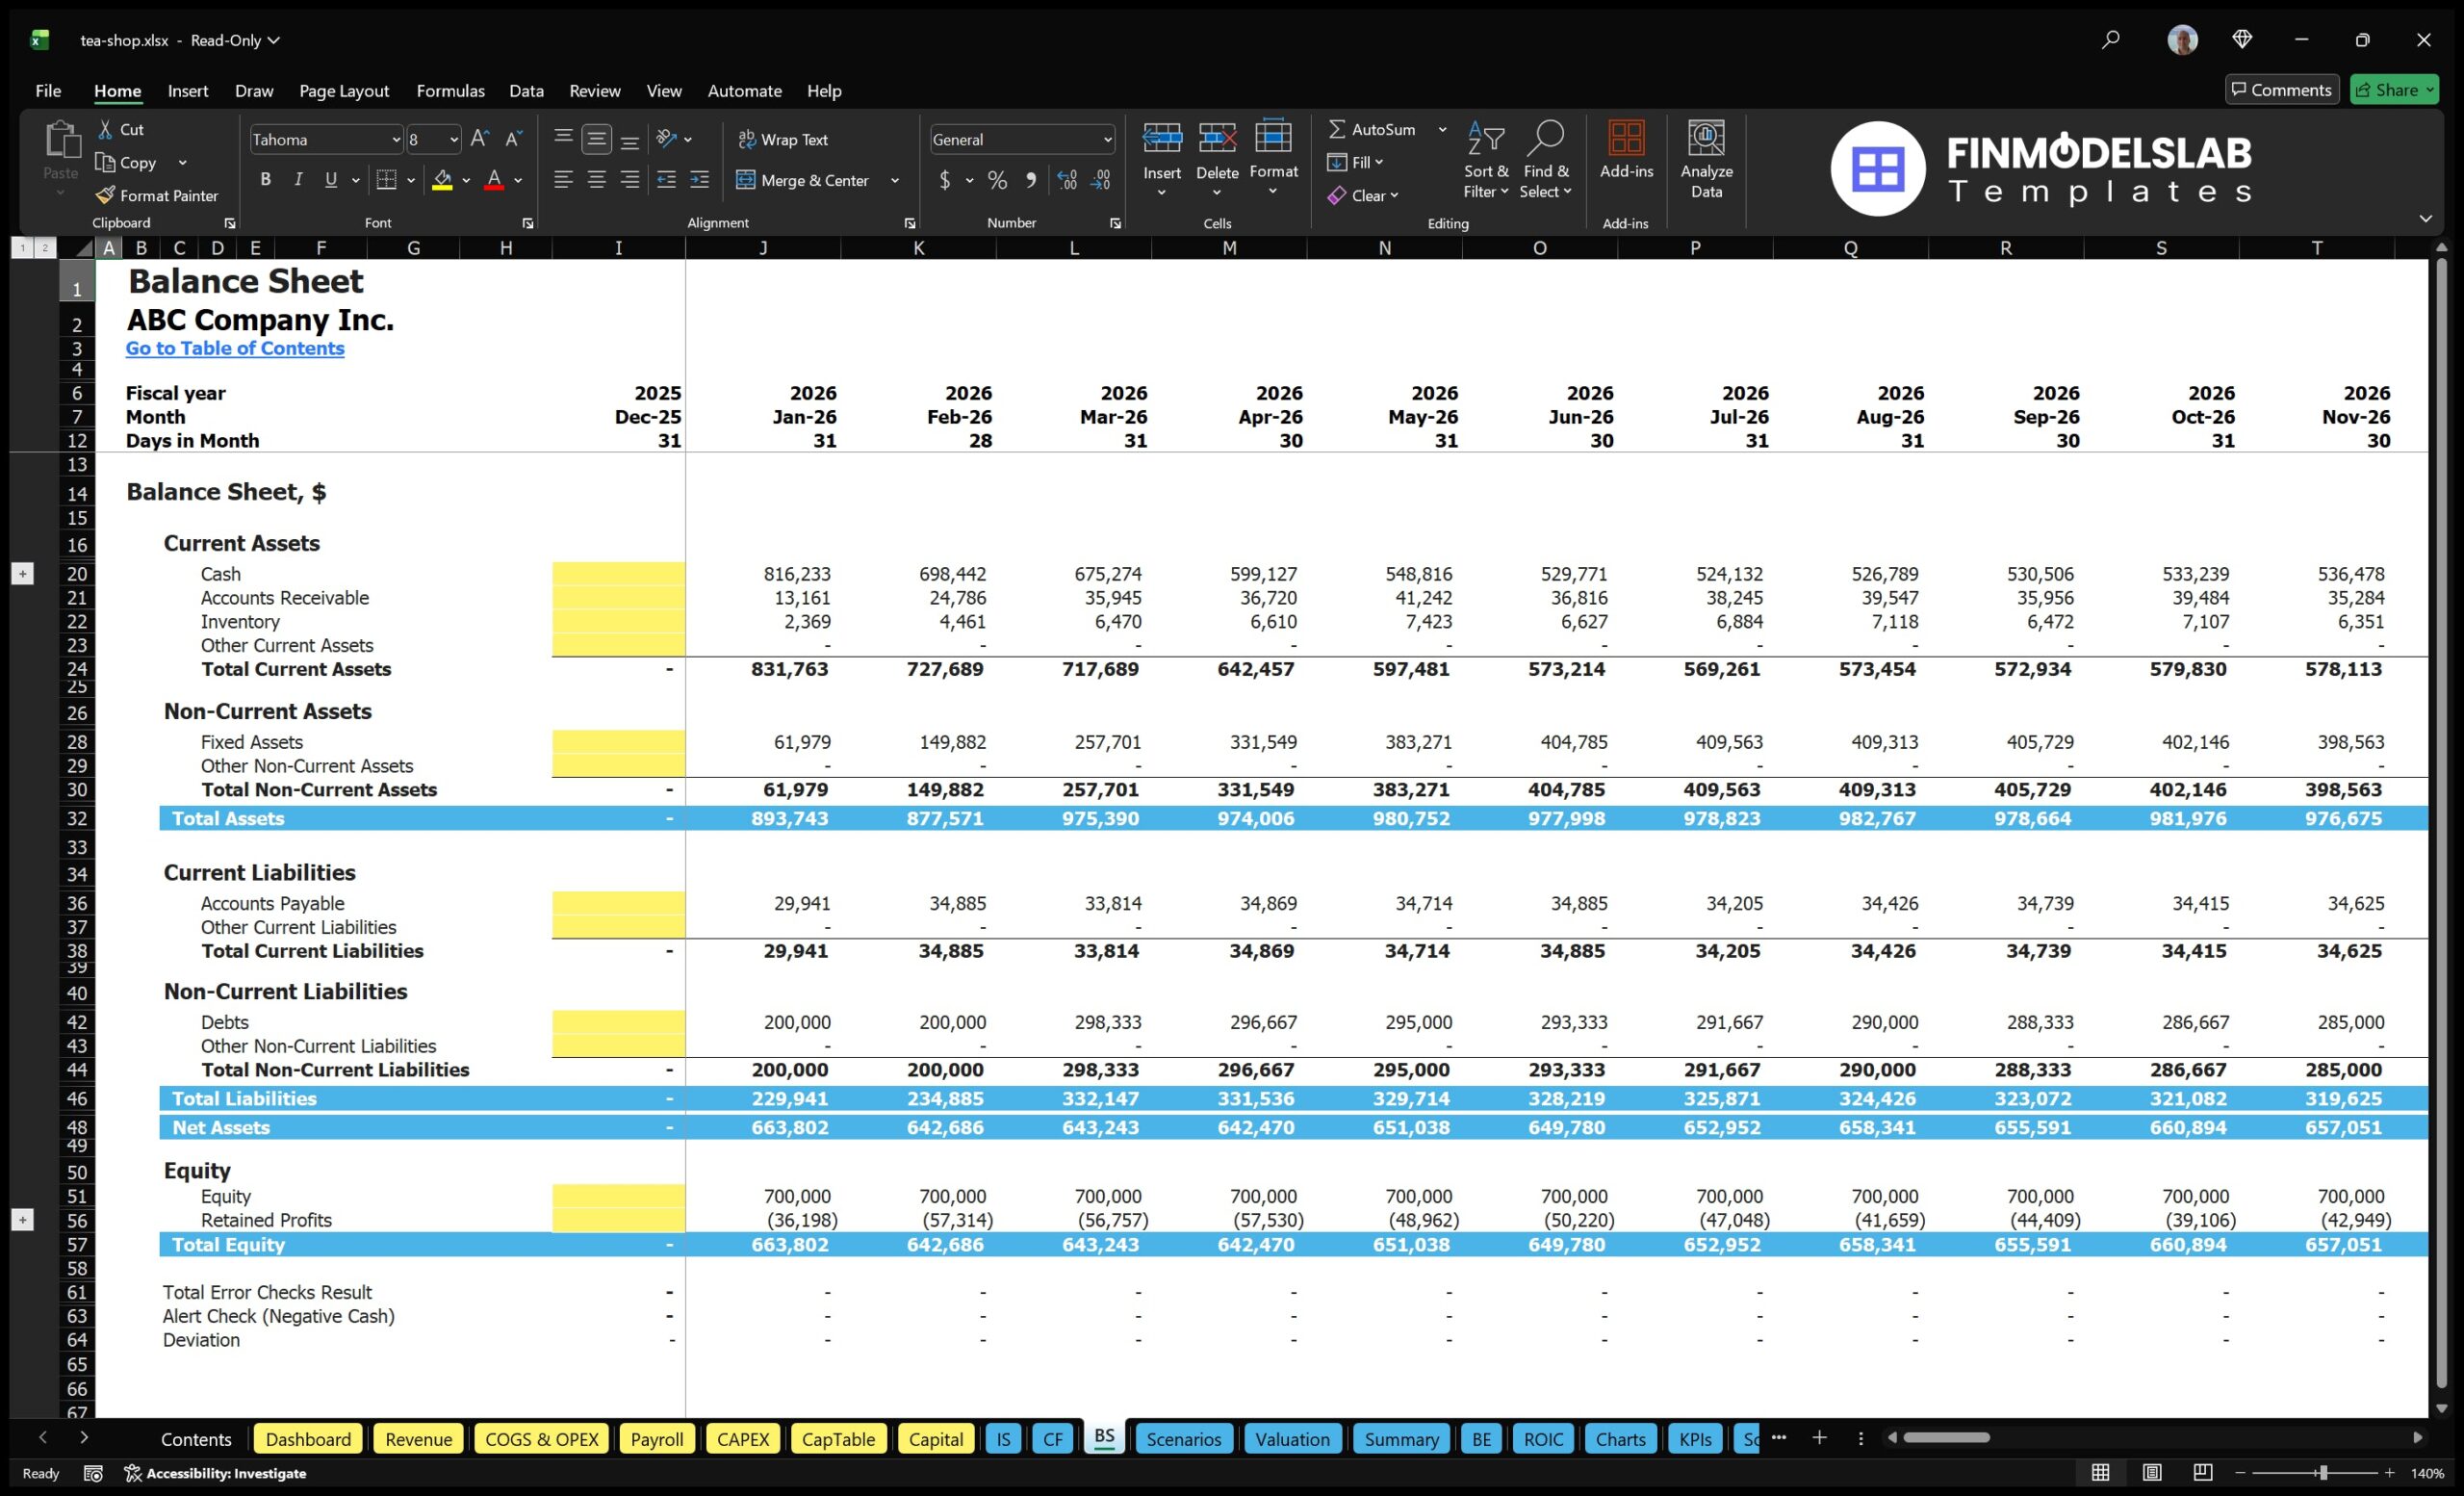
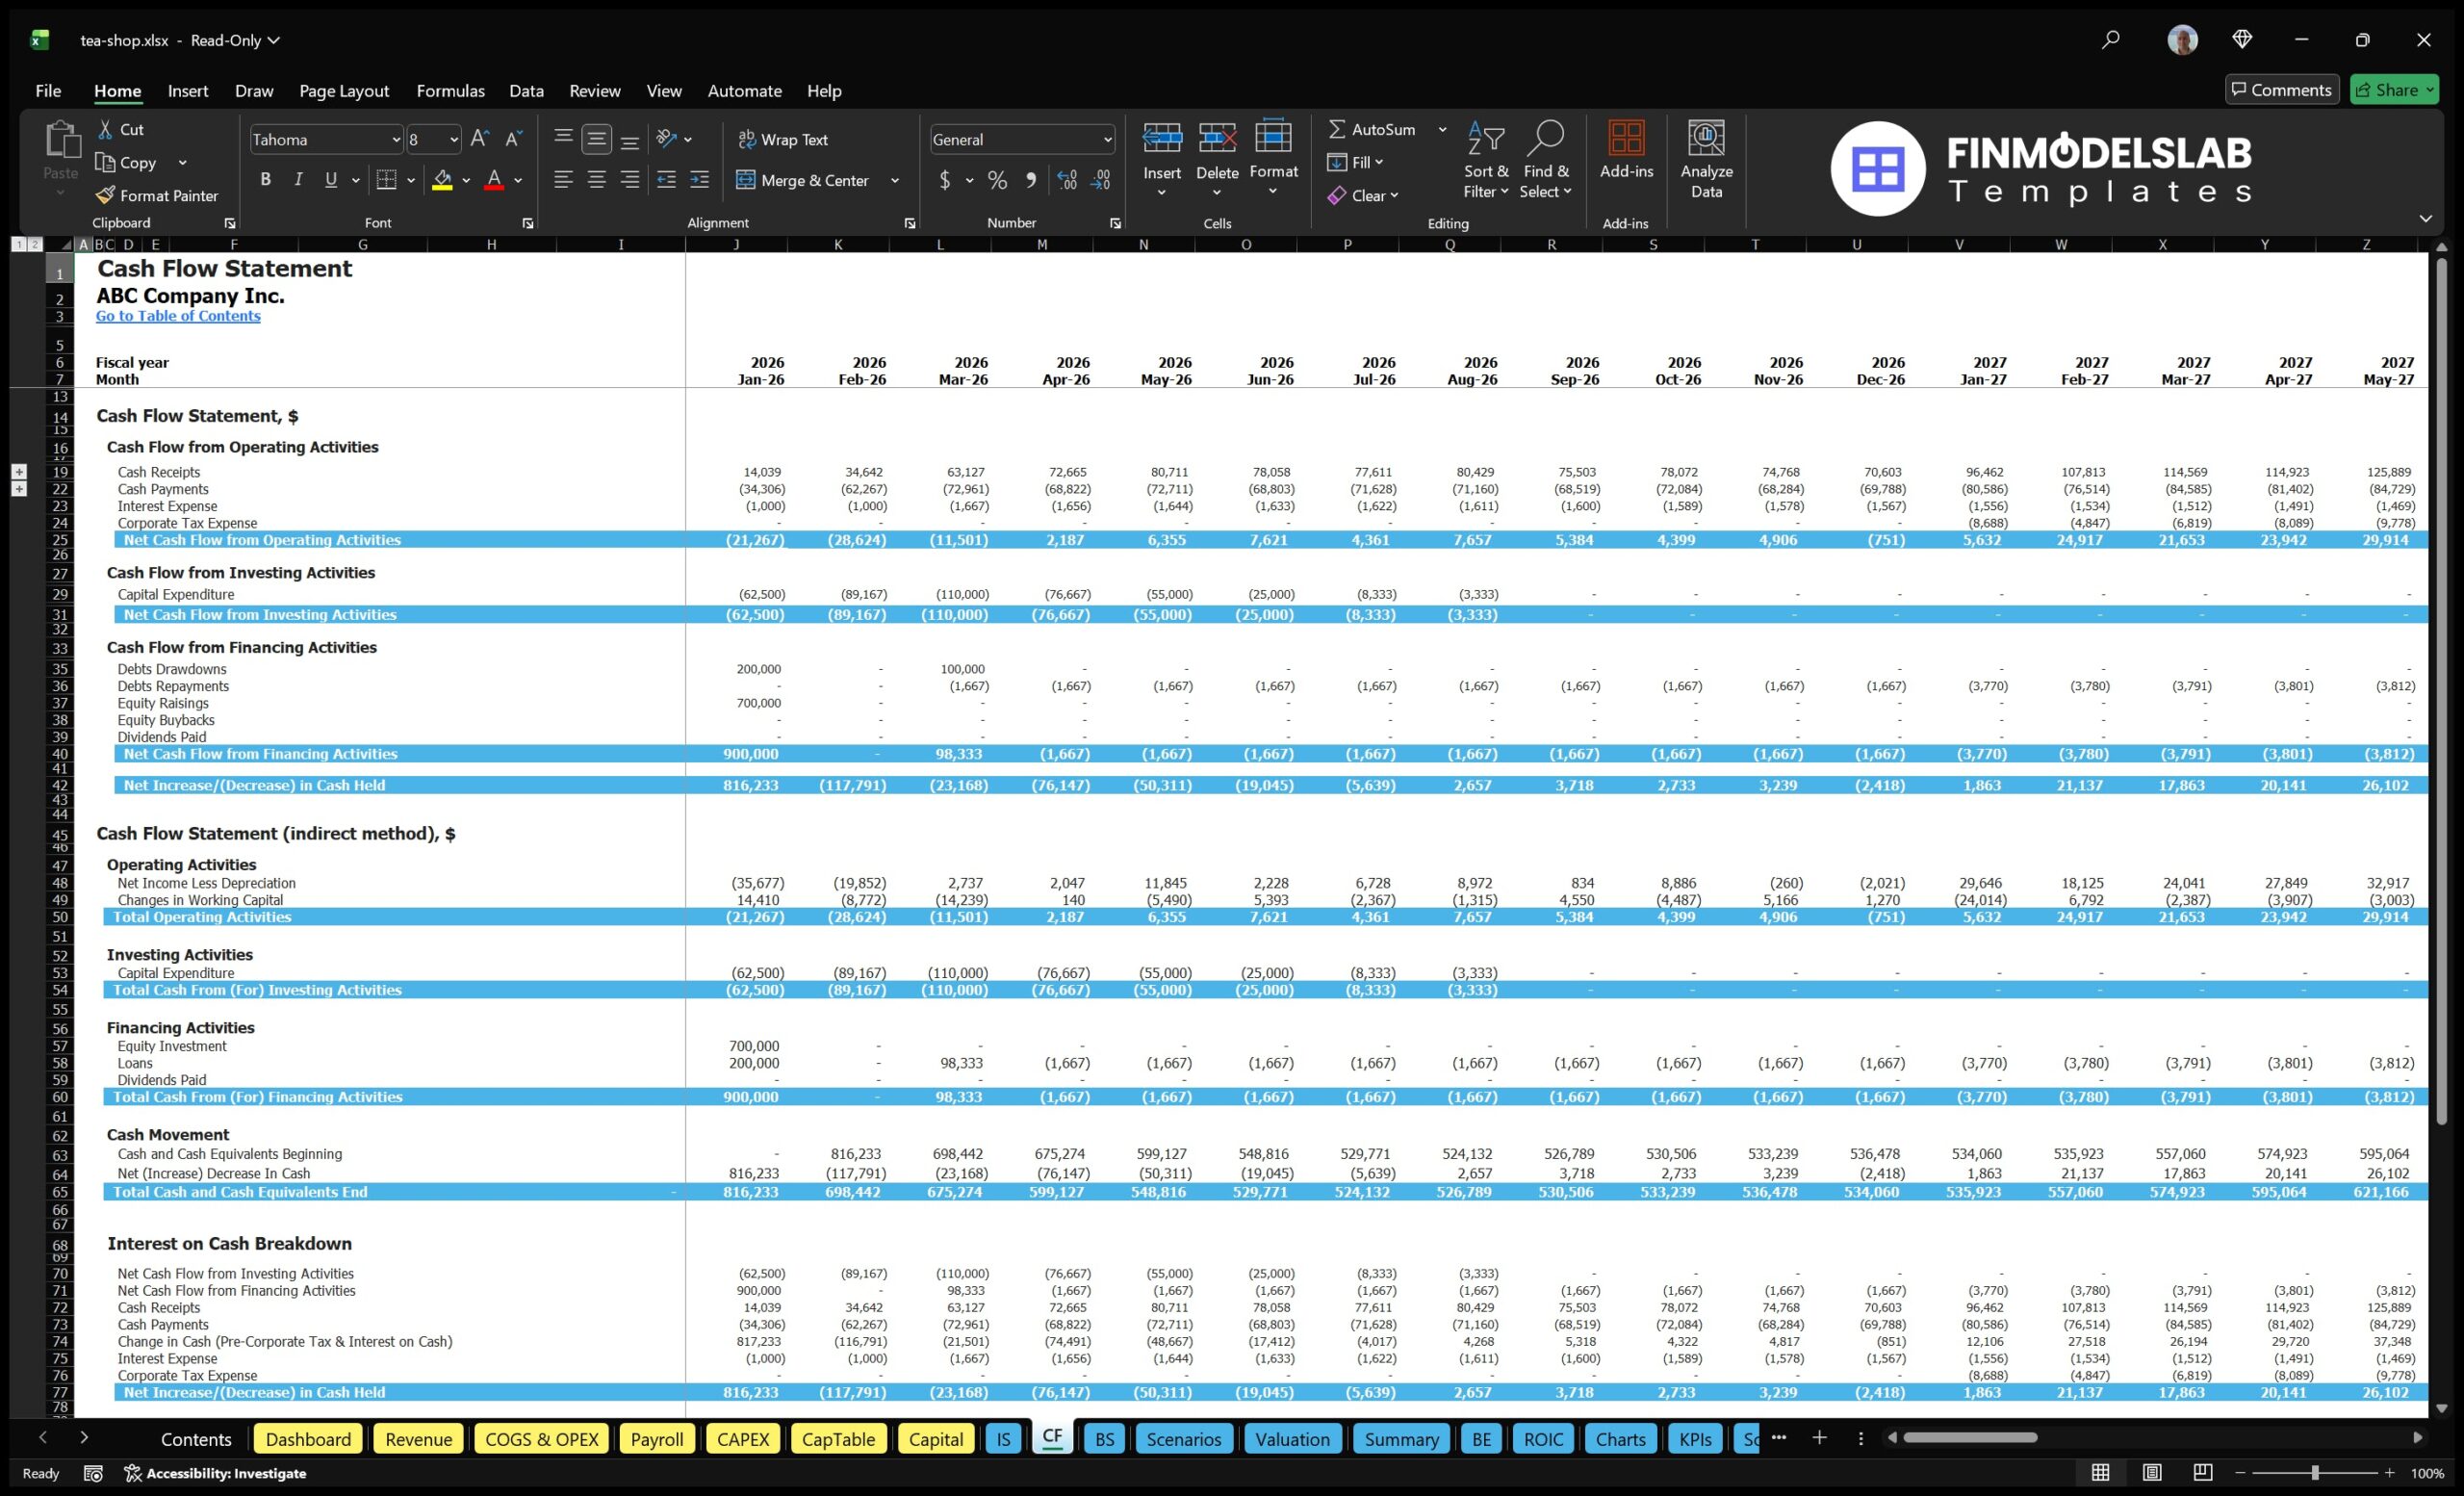
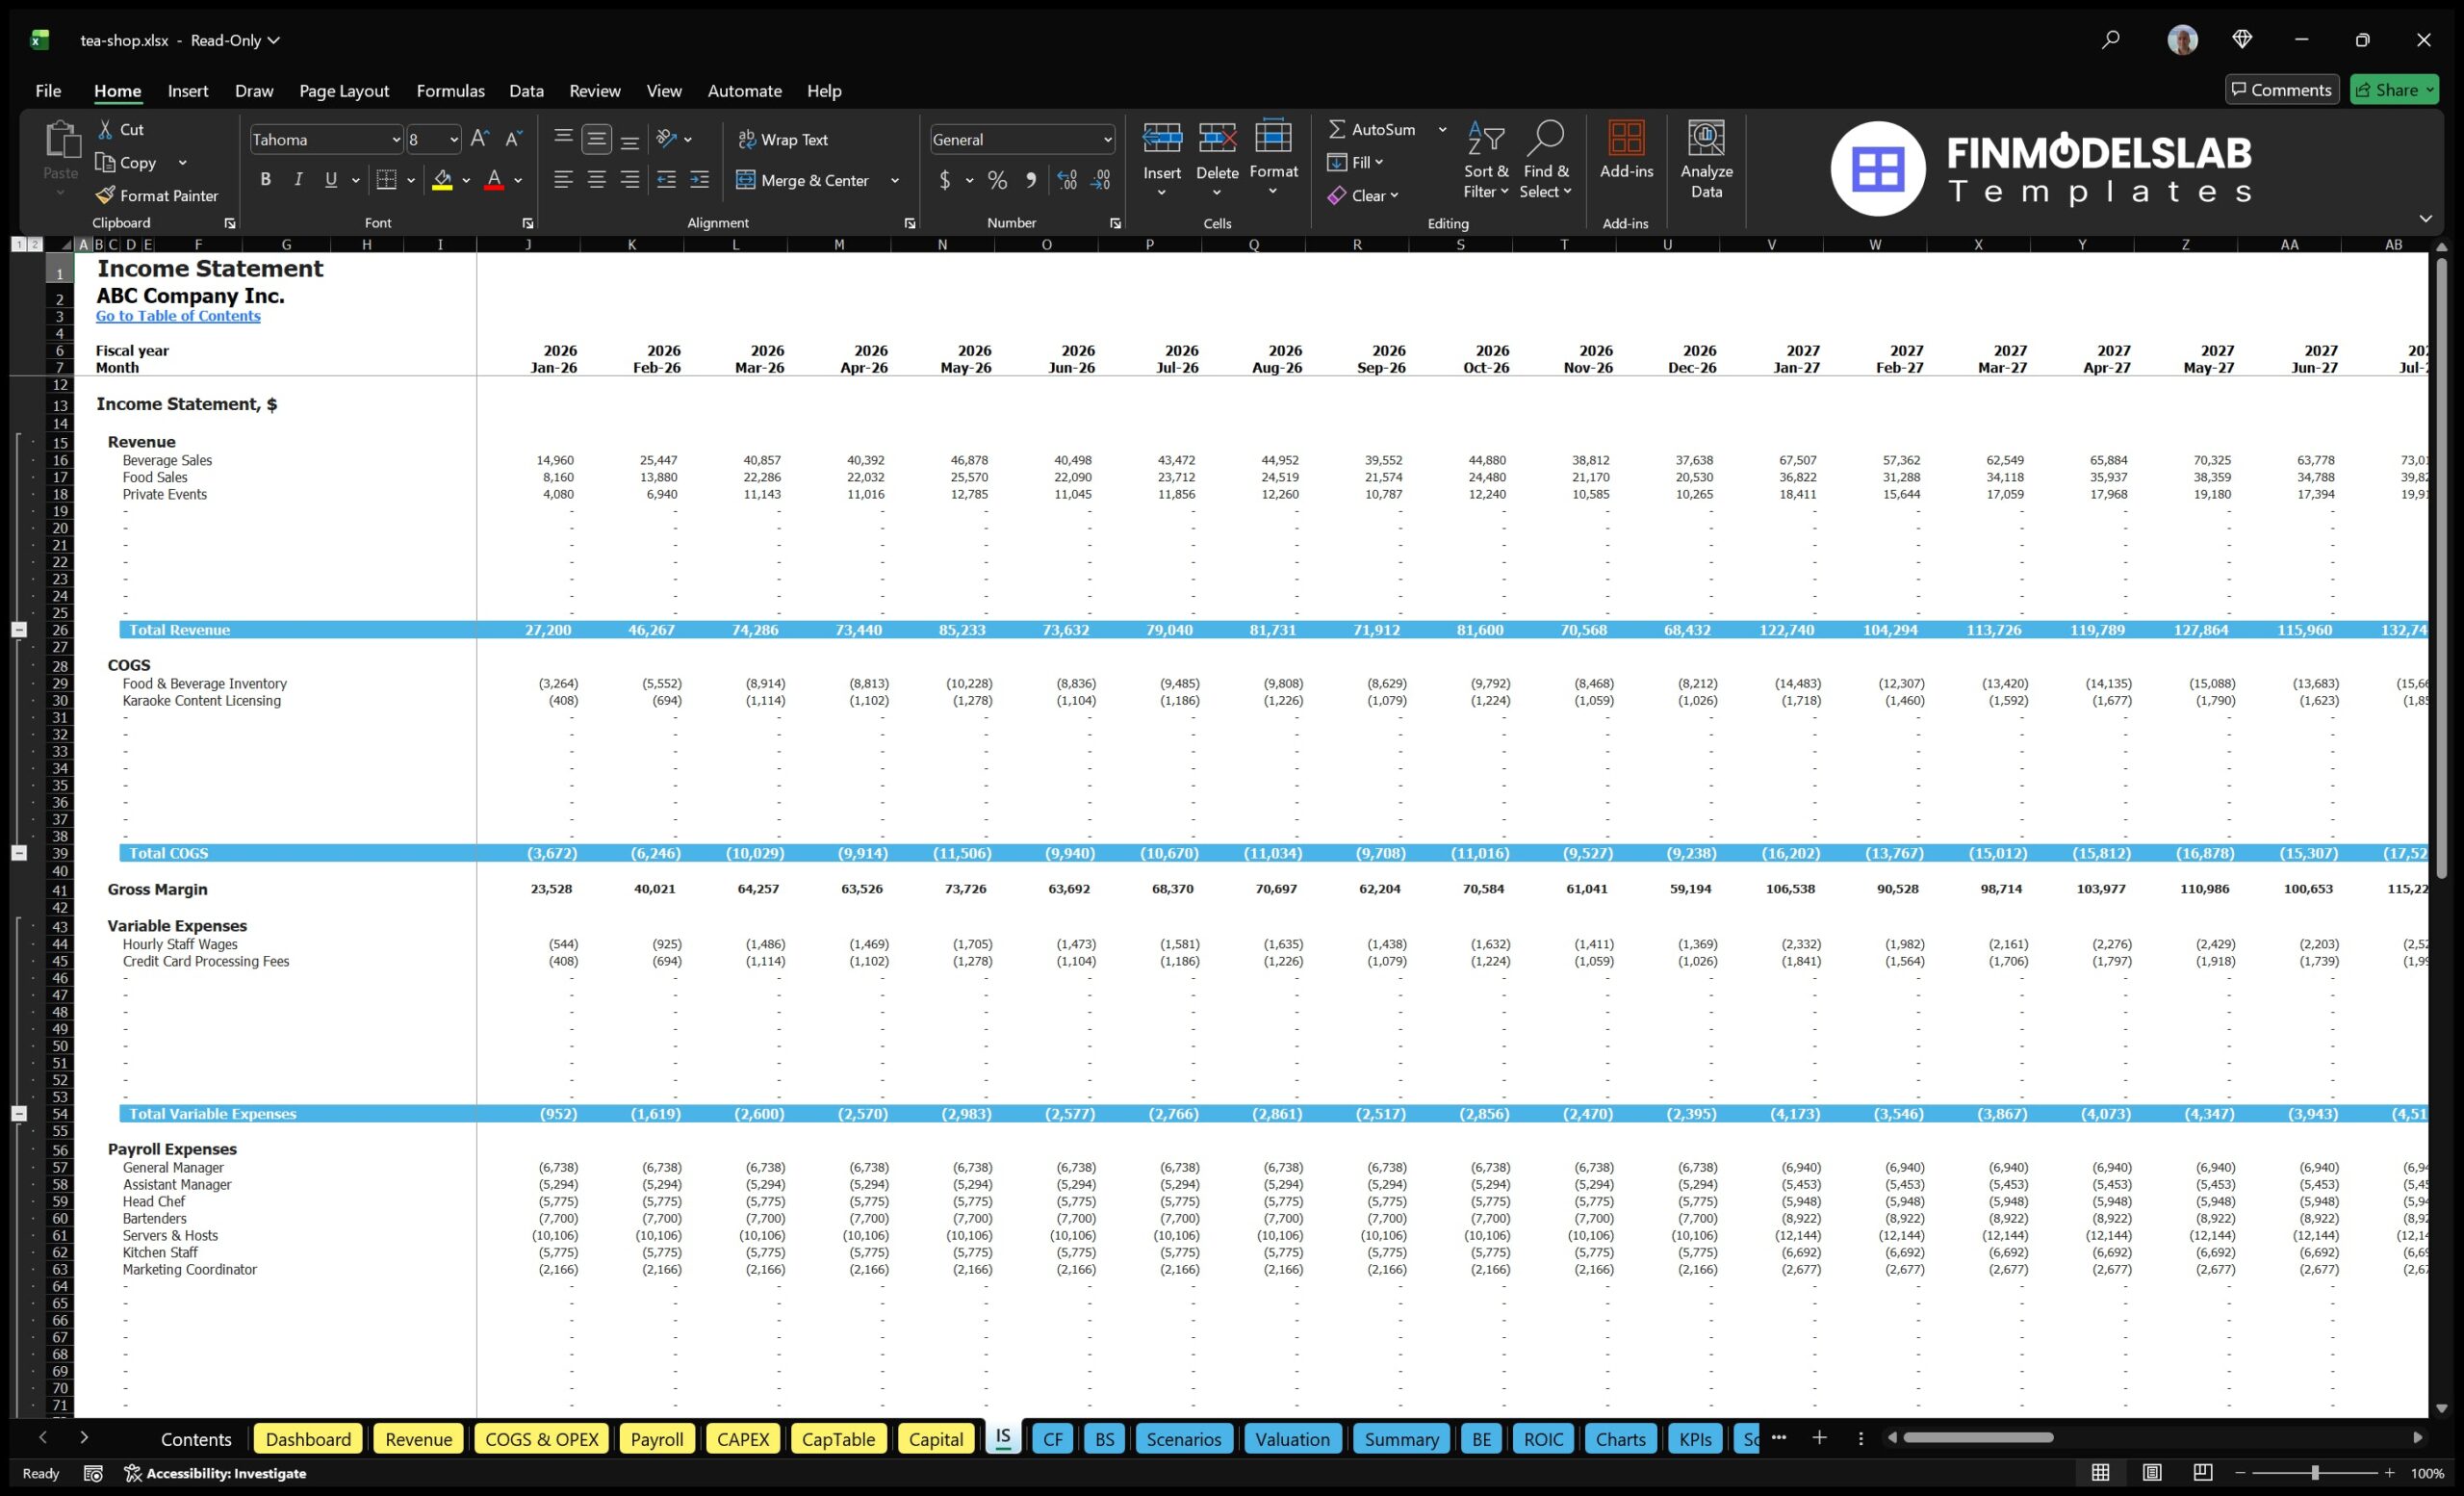
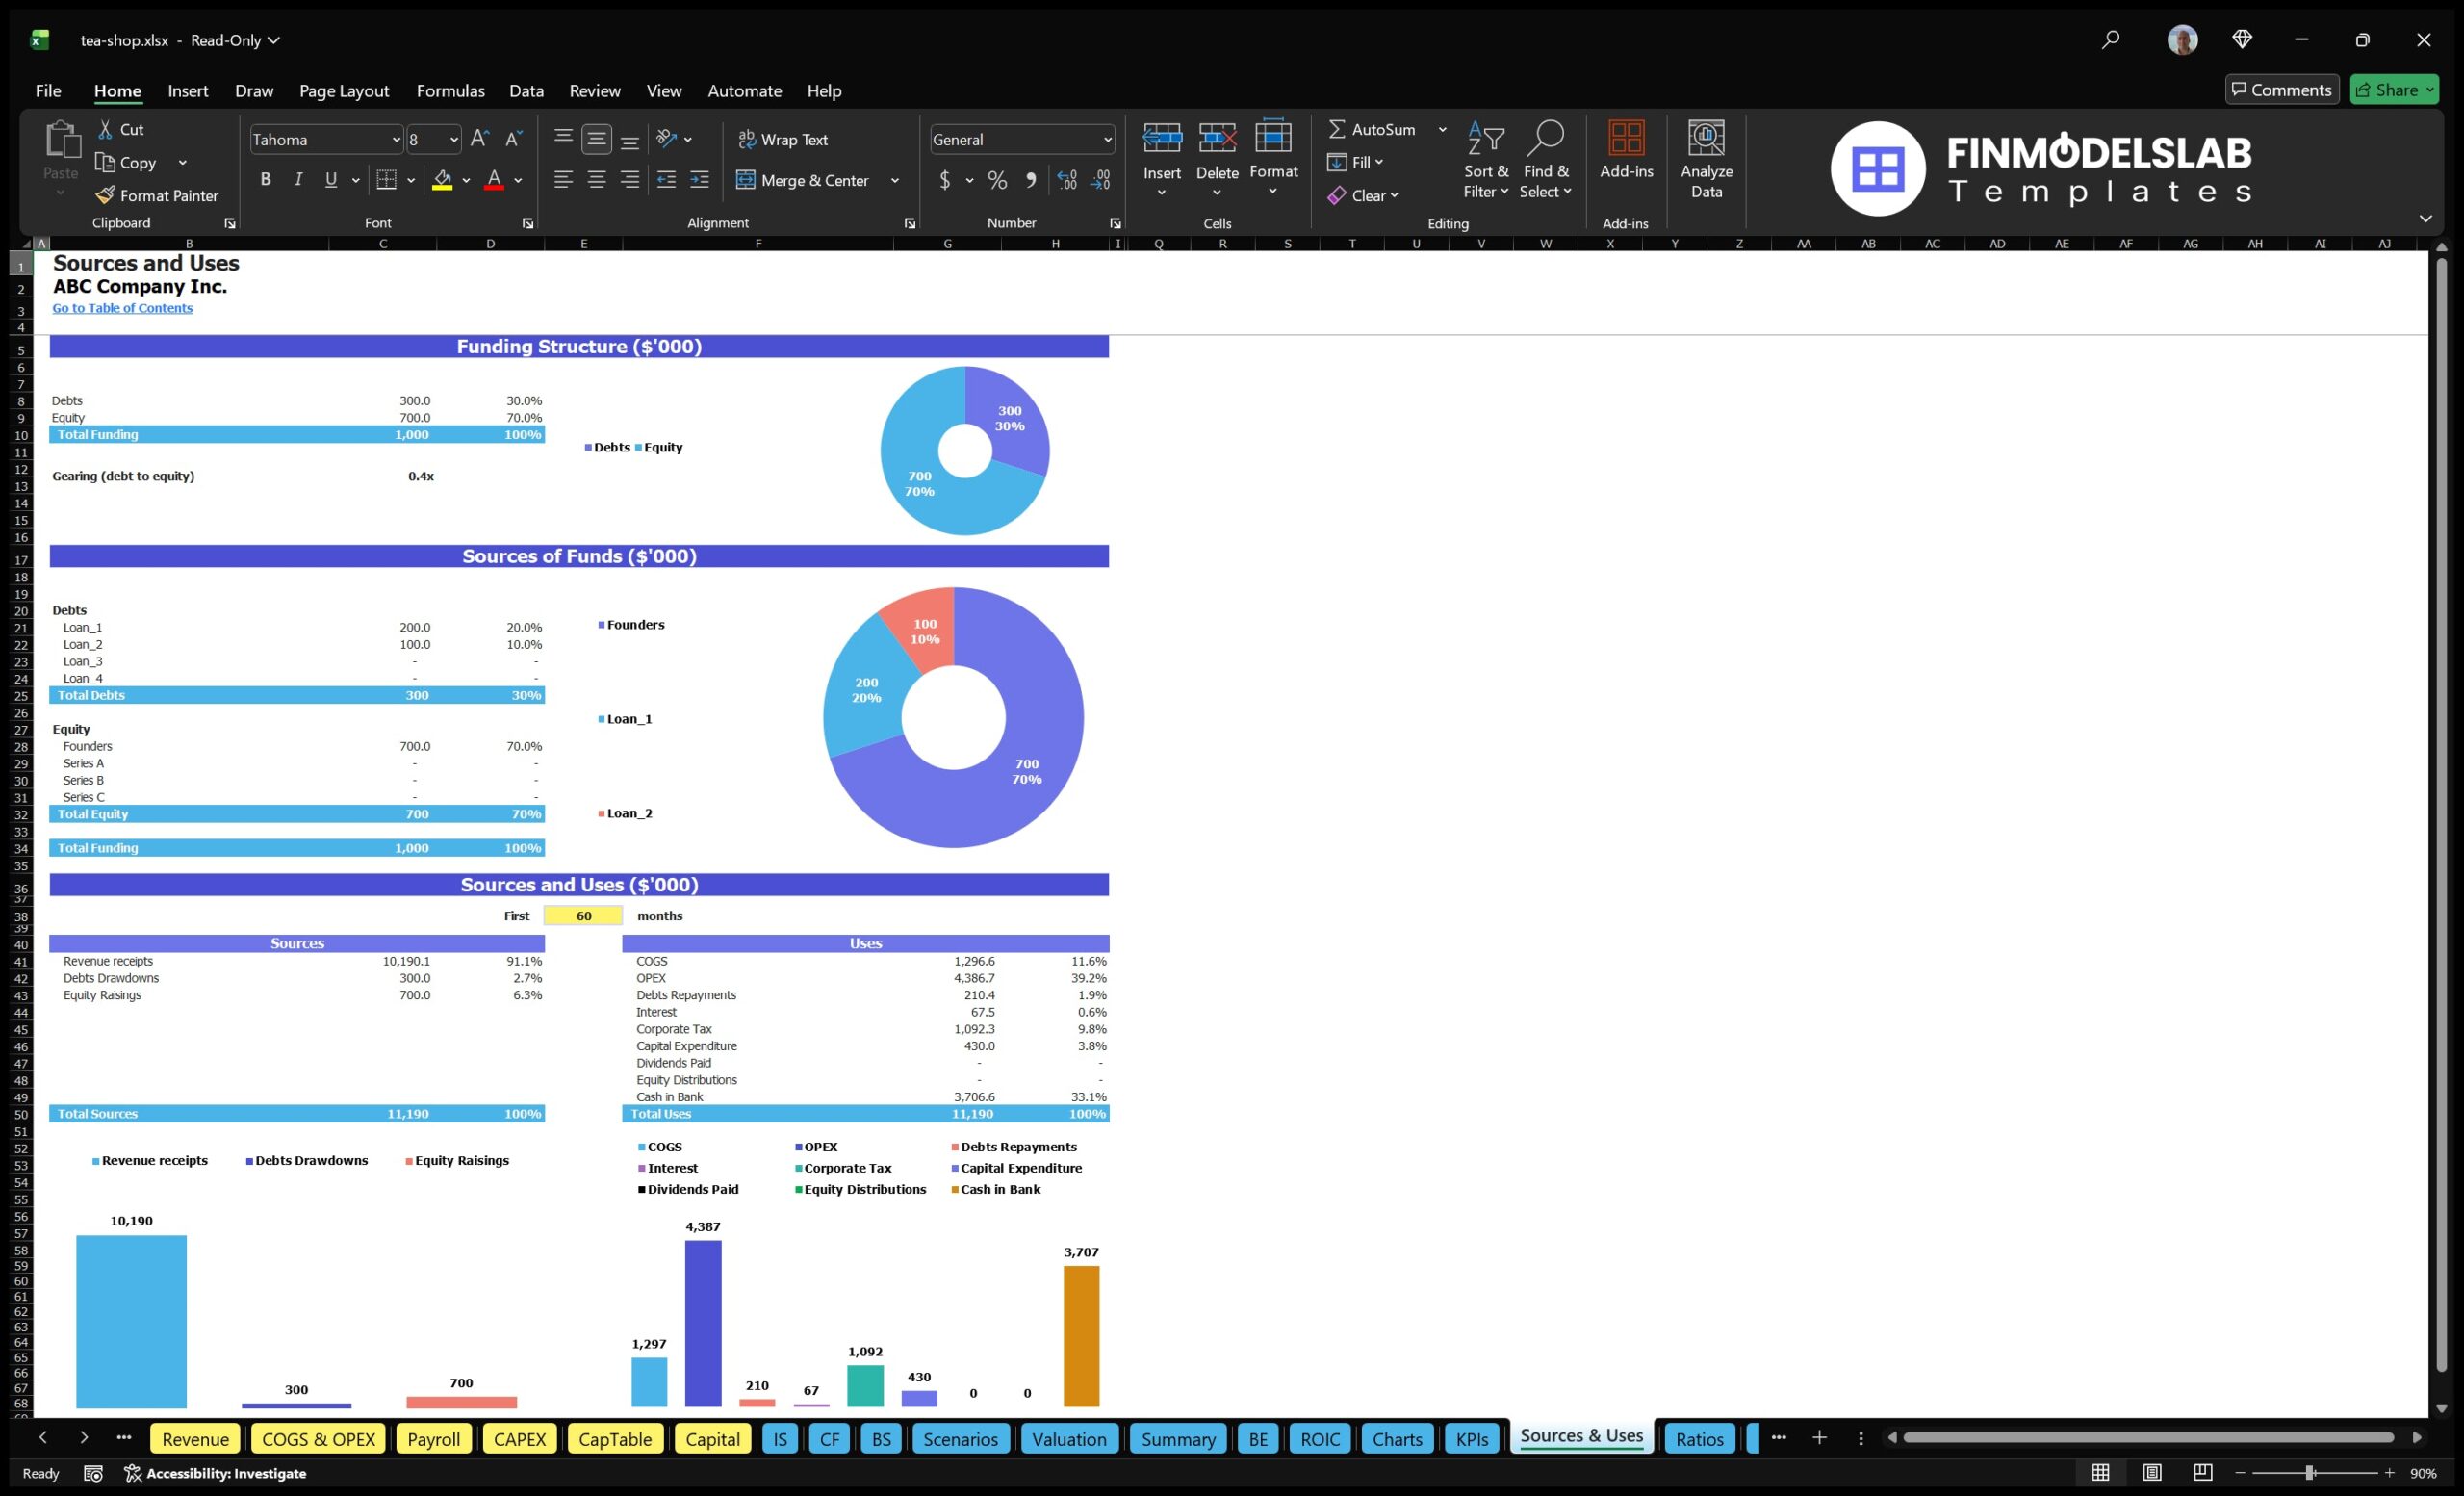
The bank-ready reports component organizes financial outputs in a format that is easier for lenders, investors, advisors, and stakeholders to review. A tea shop seeking funding often needs more than a simple sales estimate. Lenders may want to see projected profit and loss, cash flow, balance sheet, debt service capacity, startup cost requirements, working capital needs, and evidence that the business can manage its obligations. This component helps convert the model’s assumptions into structured financial statements and summaries that support a loan application, investor package, or formal business plan. Inputs may include revenue assumptions, cost of goods sold, payroll, operating expenses, debt financing, equity investment, capital expenditures, and tax assumptions. Outputs may include annual and monthly financial projections, profitability summaries, cash flow statements, and financing-related metrics. This component is valuable because it helps users present their tea shop plan professionally and consistently. It also helps identify gaps before approaching a lender, such as insufficient working capital, unrealistic expense assumptions, or a payback period that needs to be explained more clearly.
Revenue Breakdown
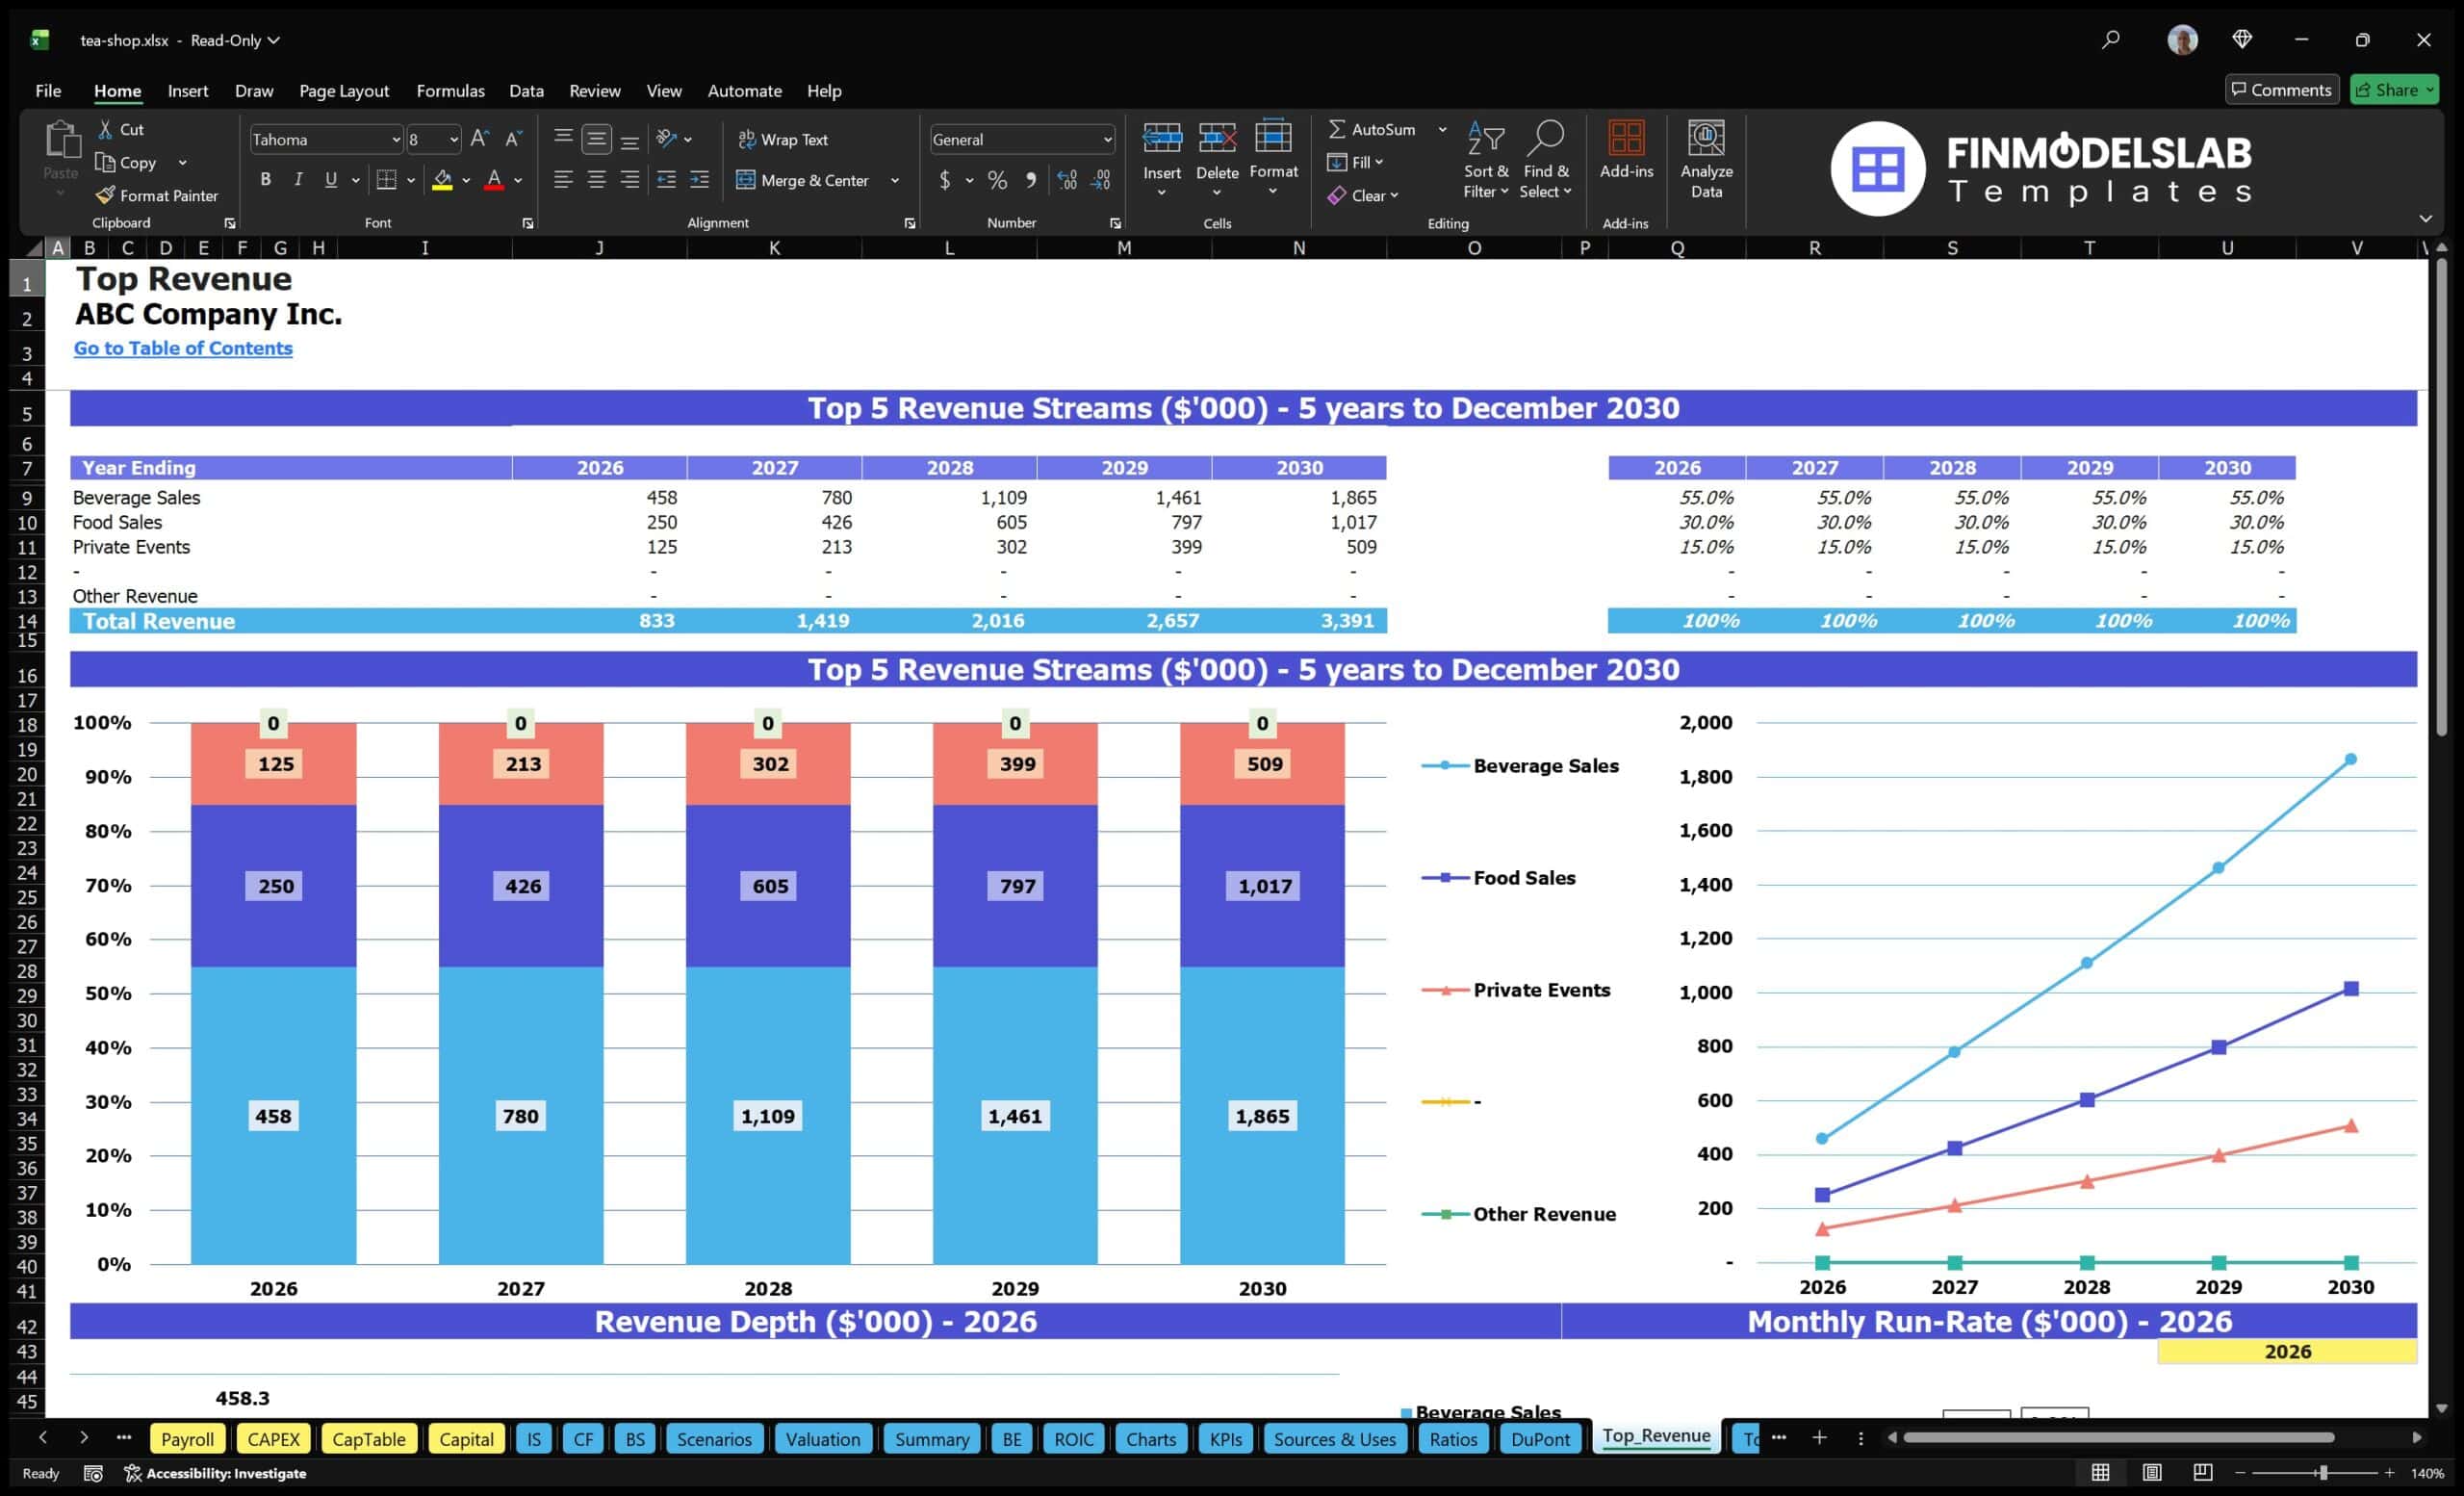
The revenue breakdown component provides a detailed view of how the tea shop earns money across different streams. A tea shop may generate sales from hot and iced tea beverages, specialty drinks, food items, pastries, retail packaged tea, private events, tasting sessions, catering, or merchandise. This section helps users separate revenue sources rather than combining everything into one total sales number. Inputs may include the percentage contribution of each revenue stream, pricing, unit volume, customer behavior, event frequency, and expected growth over time. Outputs may show the contribution of each stream to total revenue, how the mix changes by year, and which sales categories are most important to profitability. This is useful because not all tea shop revenue has the same margin or operating impact. Beverage sales may have attractive gross margins, food sales may increase ticket size but require additional inventory and labor, and private events may create larger transactions with different staffing needs. A detailed revenue breakdown helps users refine menu strategy, focus marketing efforts, identify high-value customer segments, and build a more believable financial forecast.
KPI Dashboard
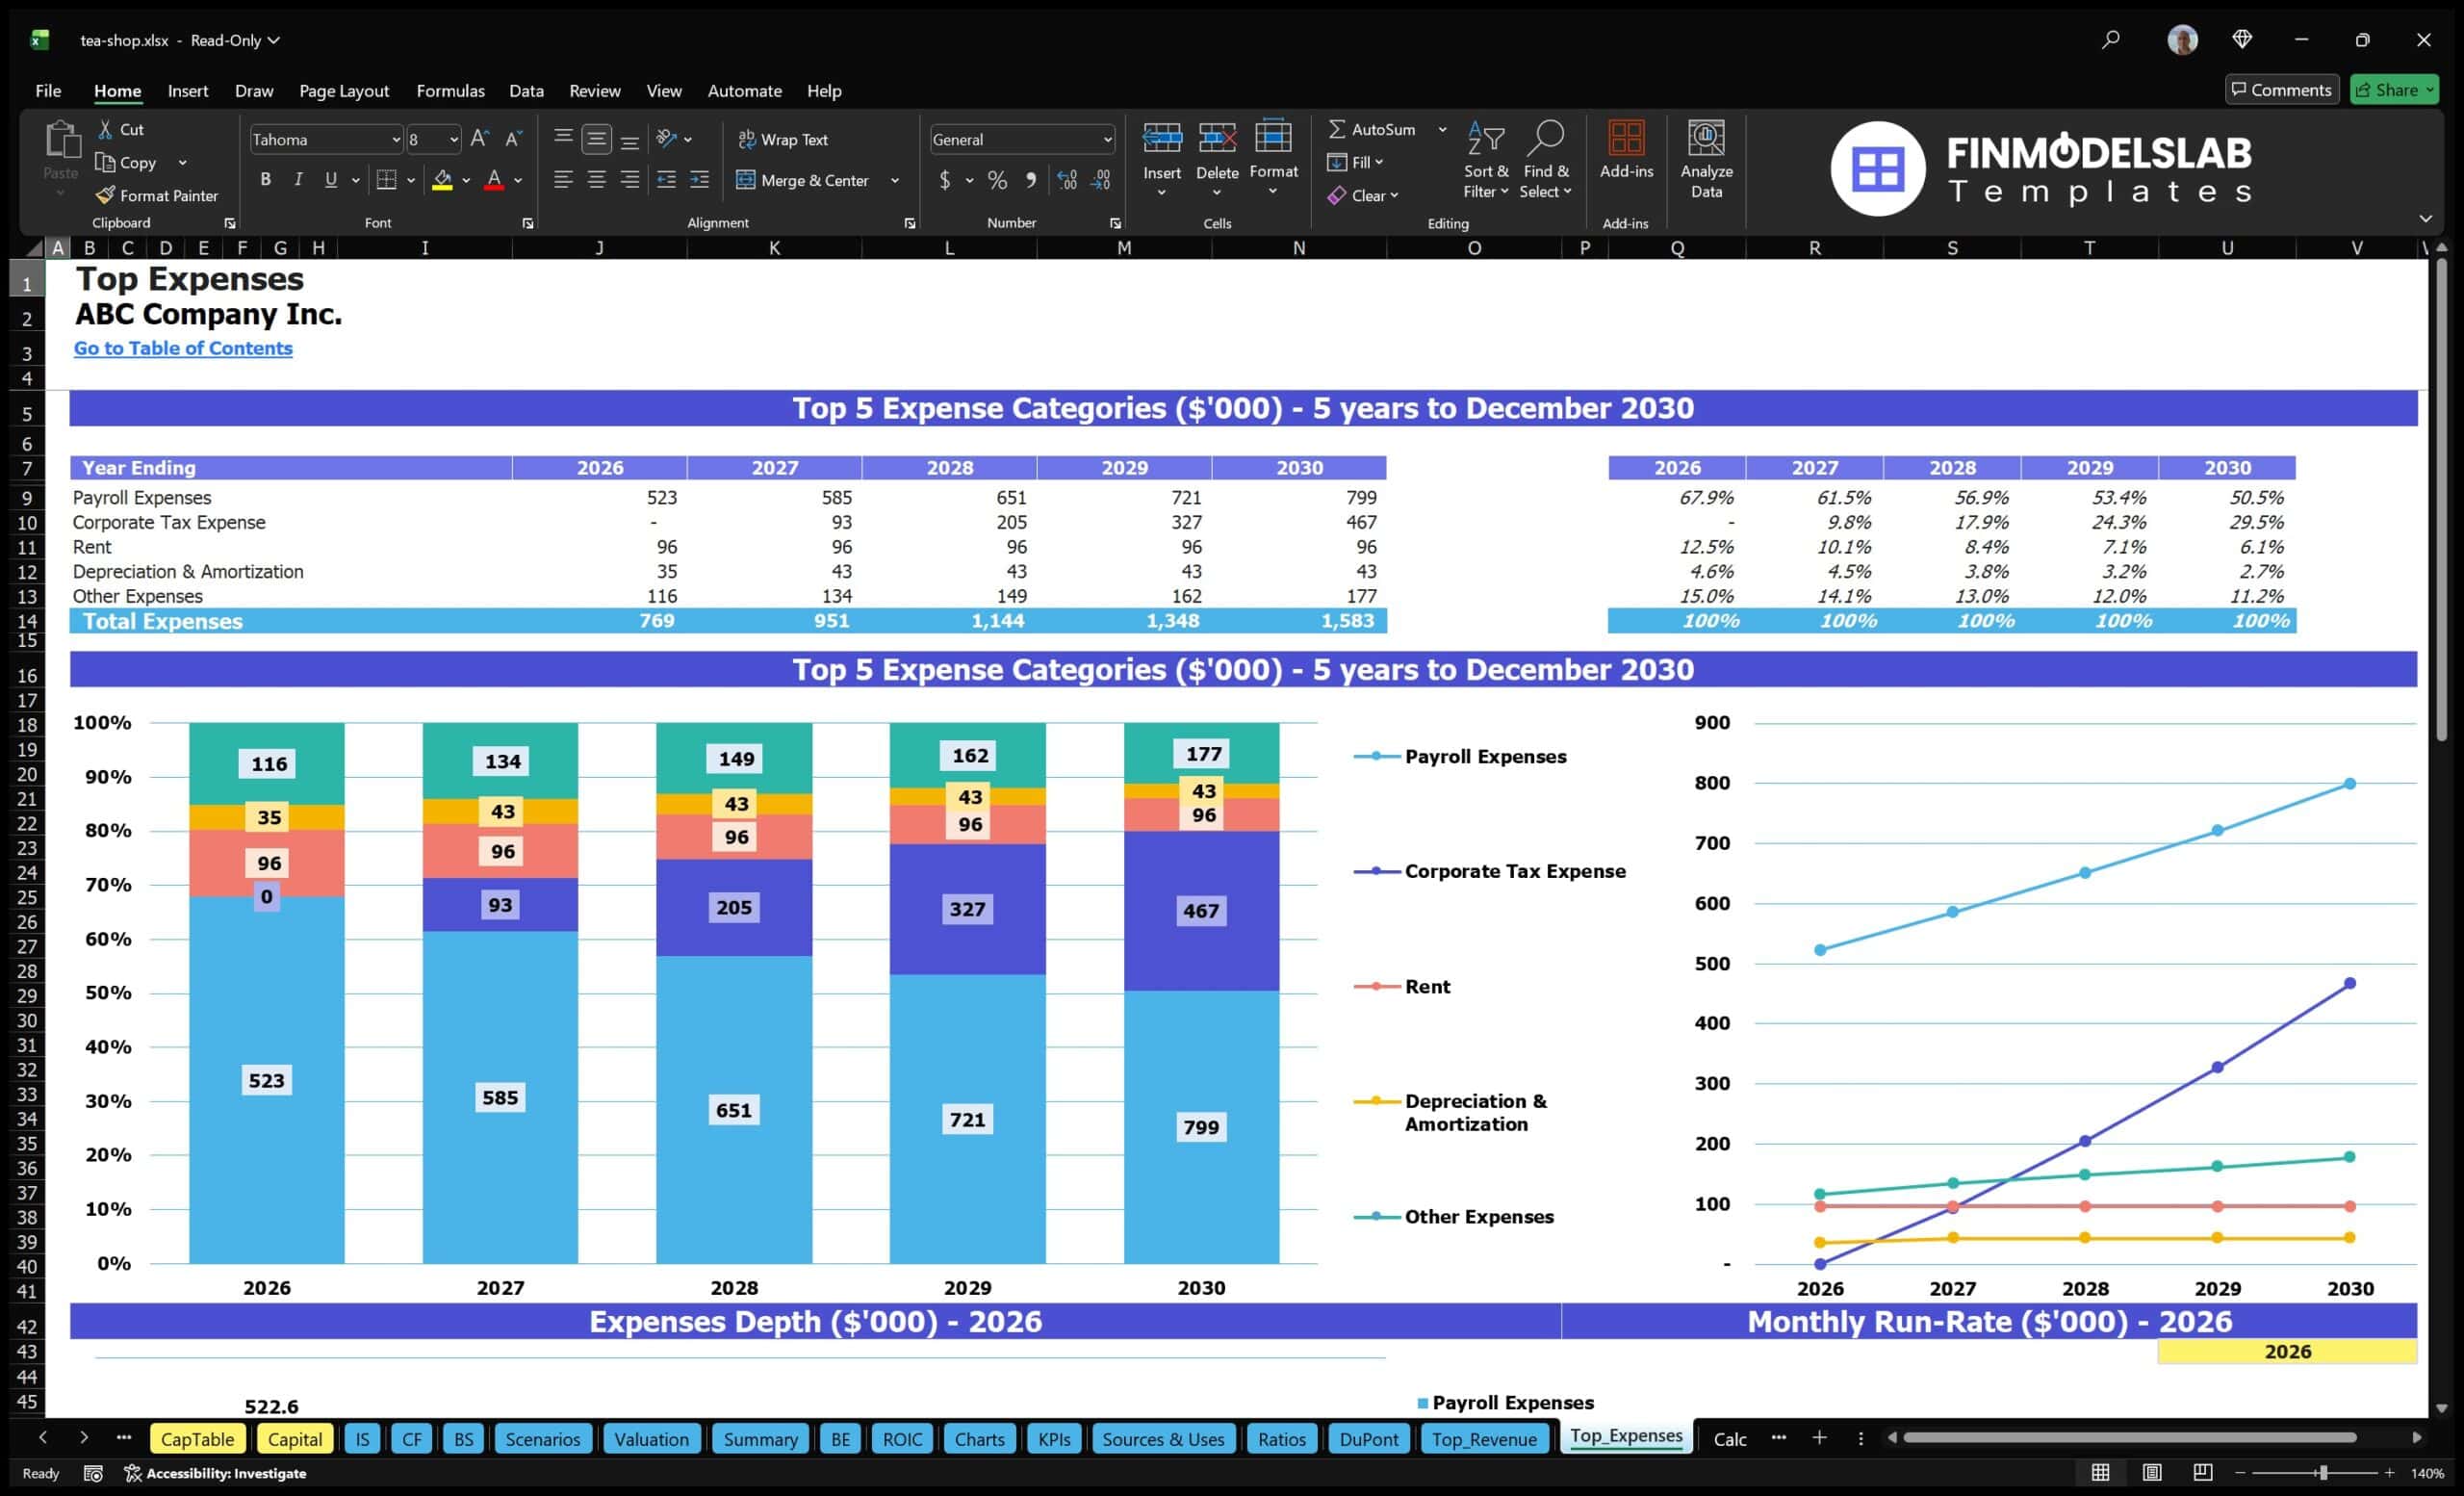
The KPI dashboard component tracks the performance metrics that matter most for managing a tea shop. While financial statements show the overall results, key performance indicators help explain why those results are happening. Inputs may include sales, customer counts, average order value, gross margin, labor costs, rent, operating expenses, cash balance, inventory-related costs, and revenue stream mix. Outputs may include metrics such as revenue per customer, gross profit margin, labor as a percentage of revenue, cost of goods sold percentage, EBITDA margin, cash runway, break-even progress, and return measures. This component is useful because it gives owners and managers a practical way to monitor whether the business is operating according to plan. If labor costs rise faster than revenue or customer traffic falls below forecast, the KPI dashboard can highlight the issue early. It can also support performance benchmarking by comparing key metrics against expected targets or industry standards. For funding presentations and stakeholder updates, the KPI dashboard helps summarize business health in a concise, measurable way.
Startup Cost and CAPEX Planning
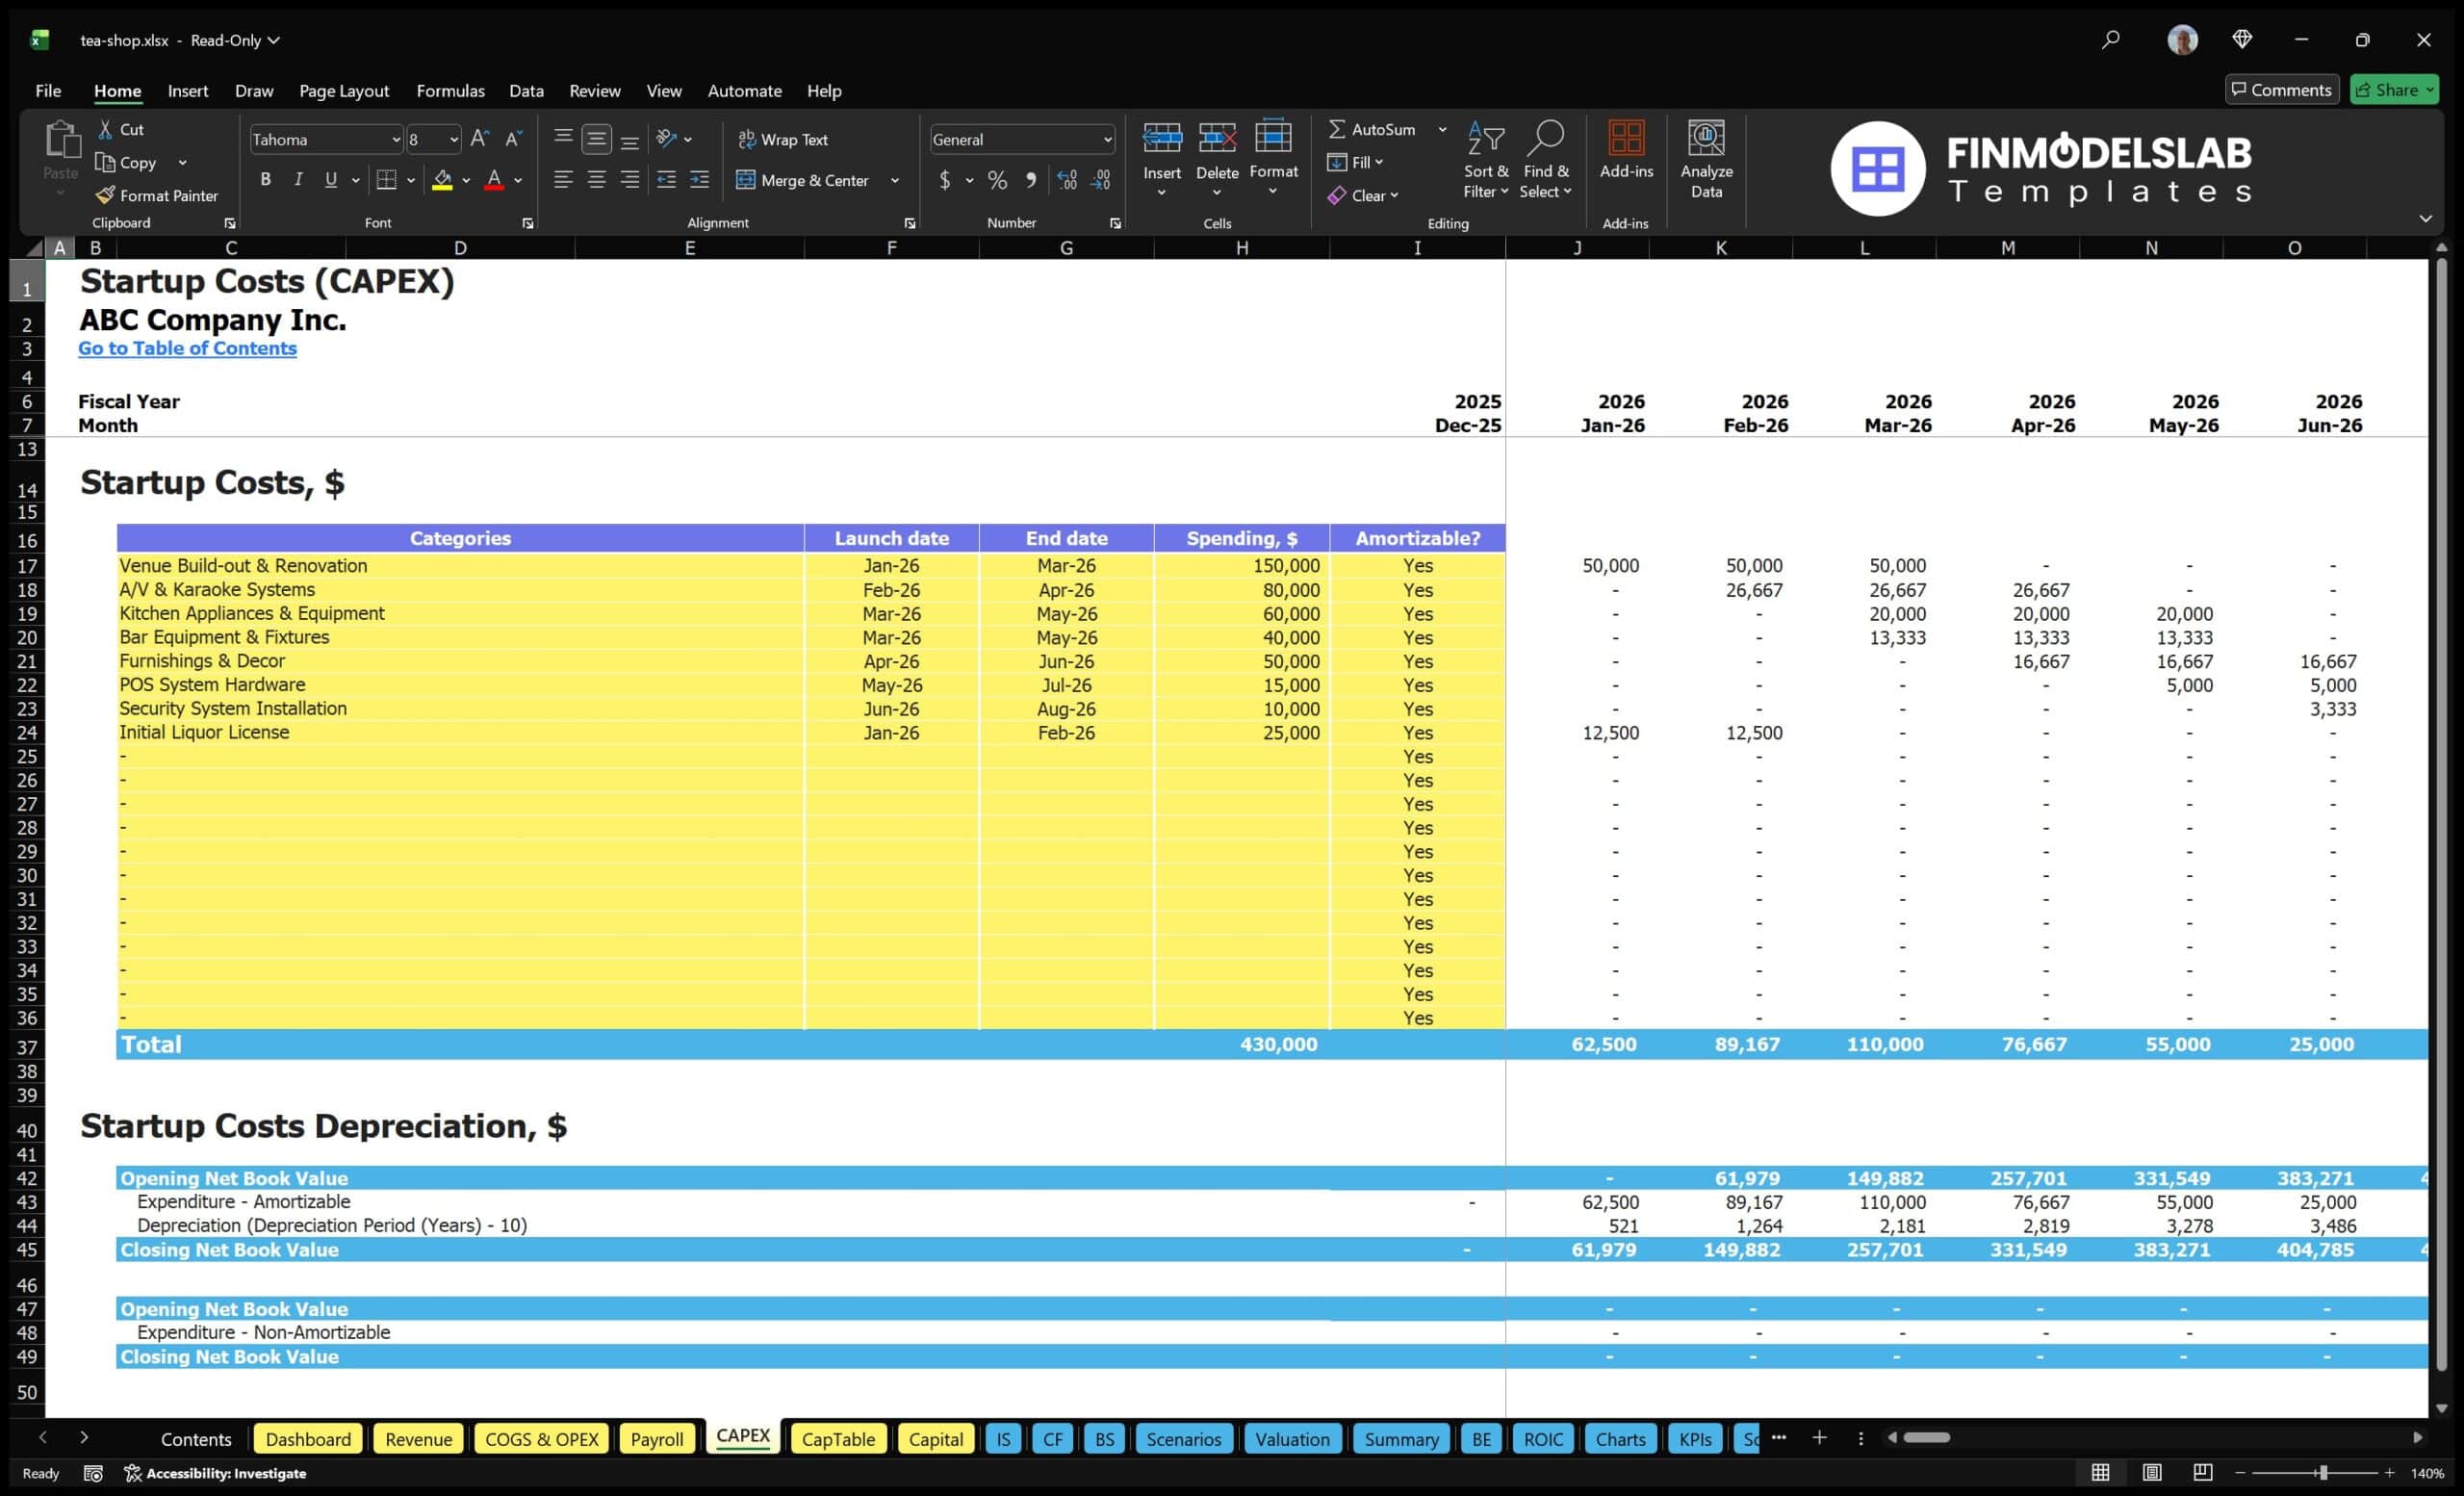
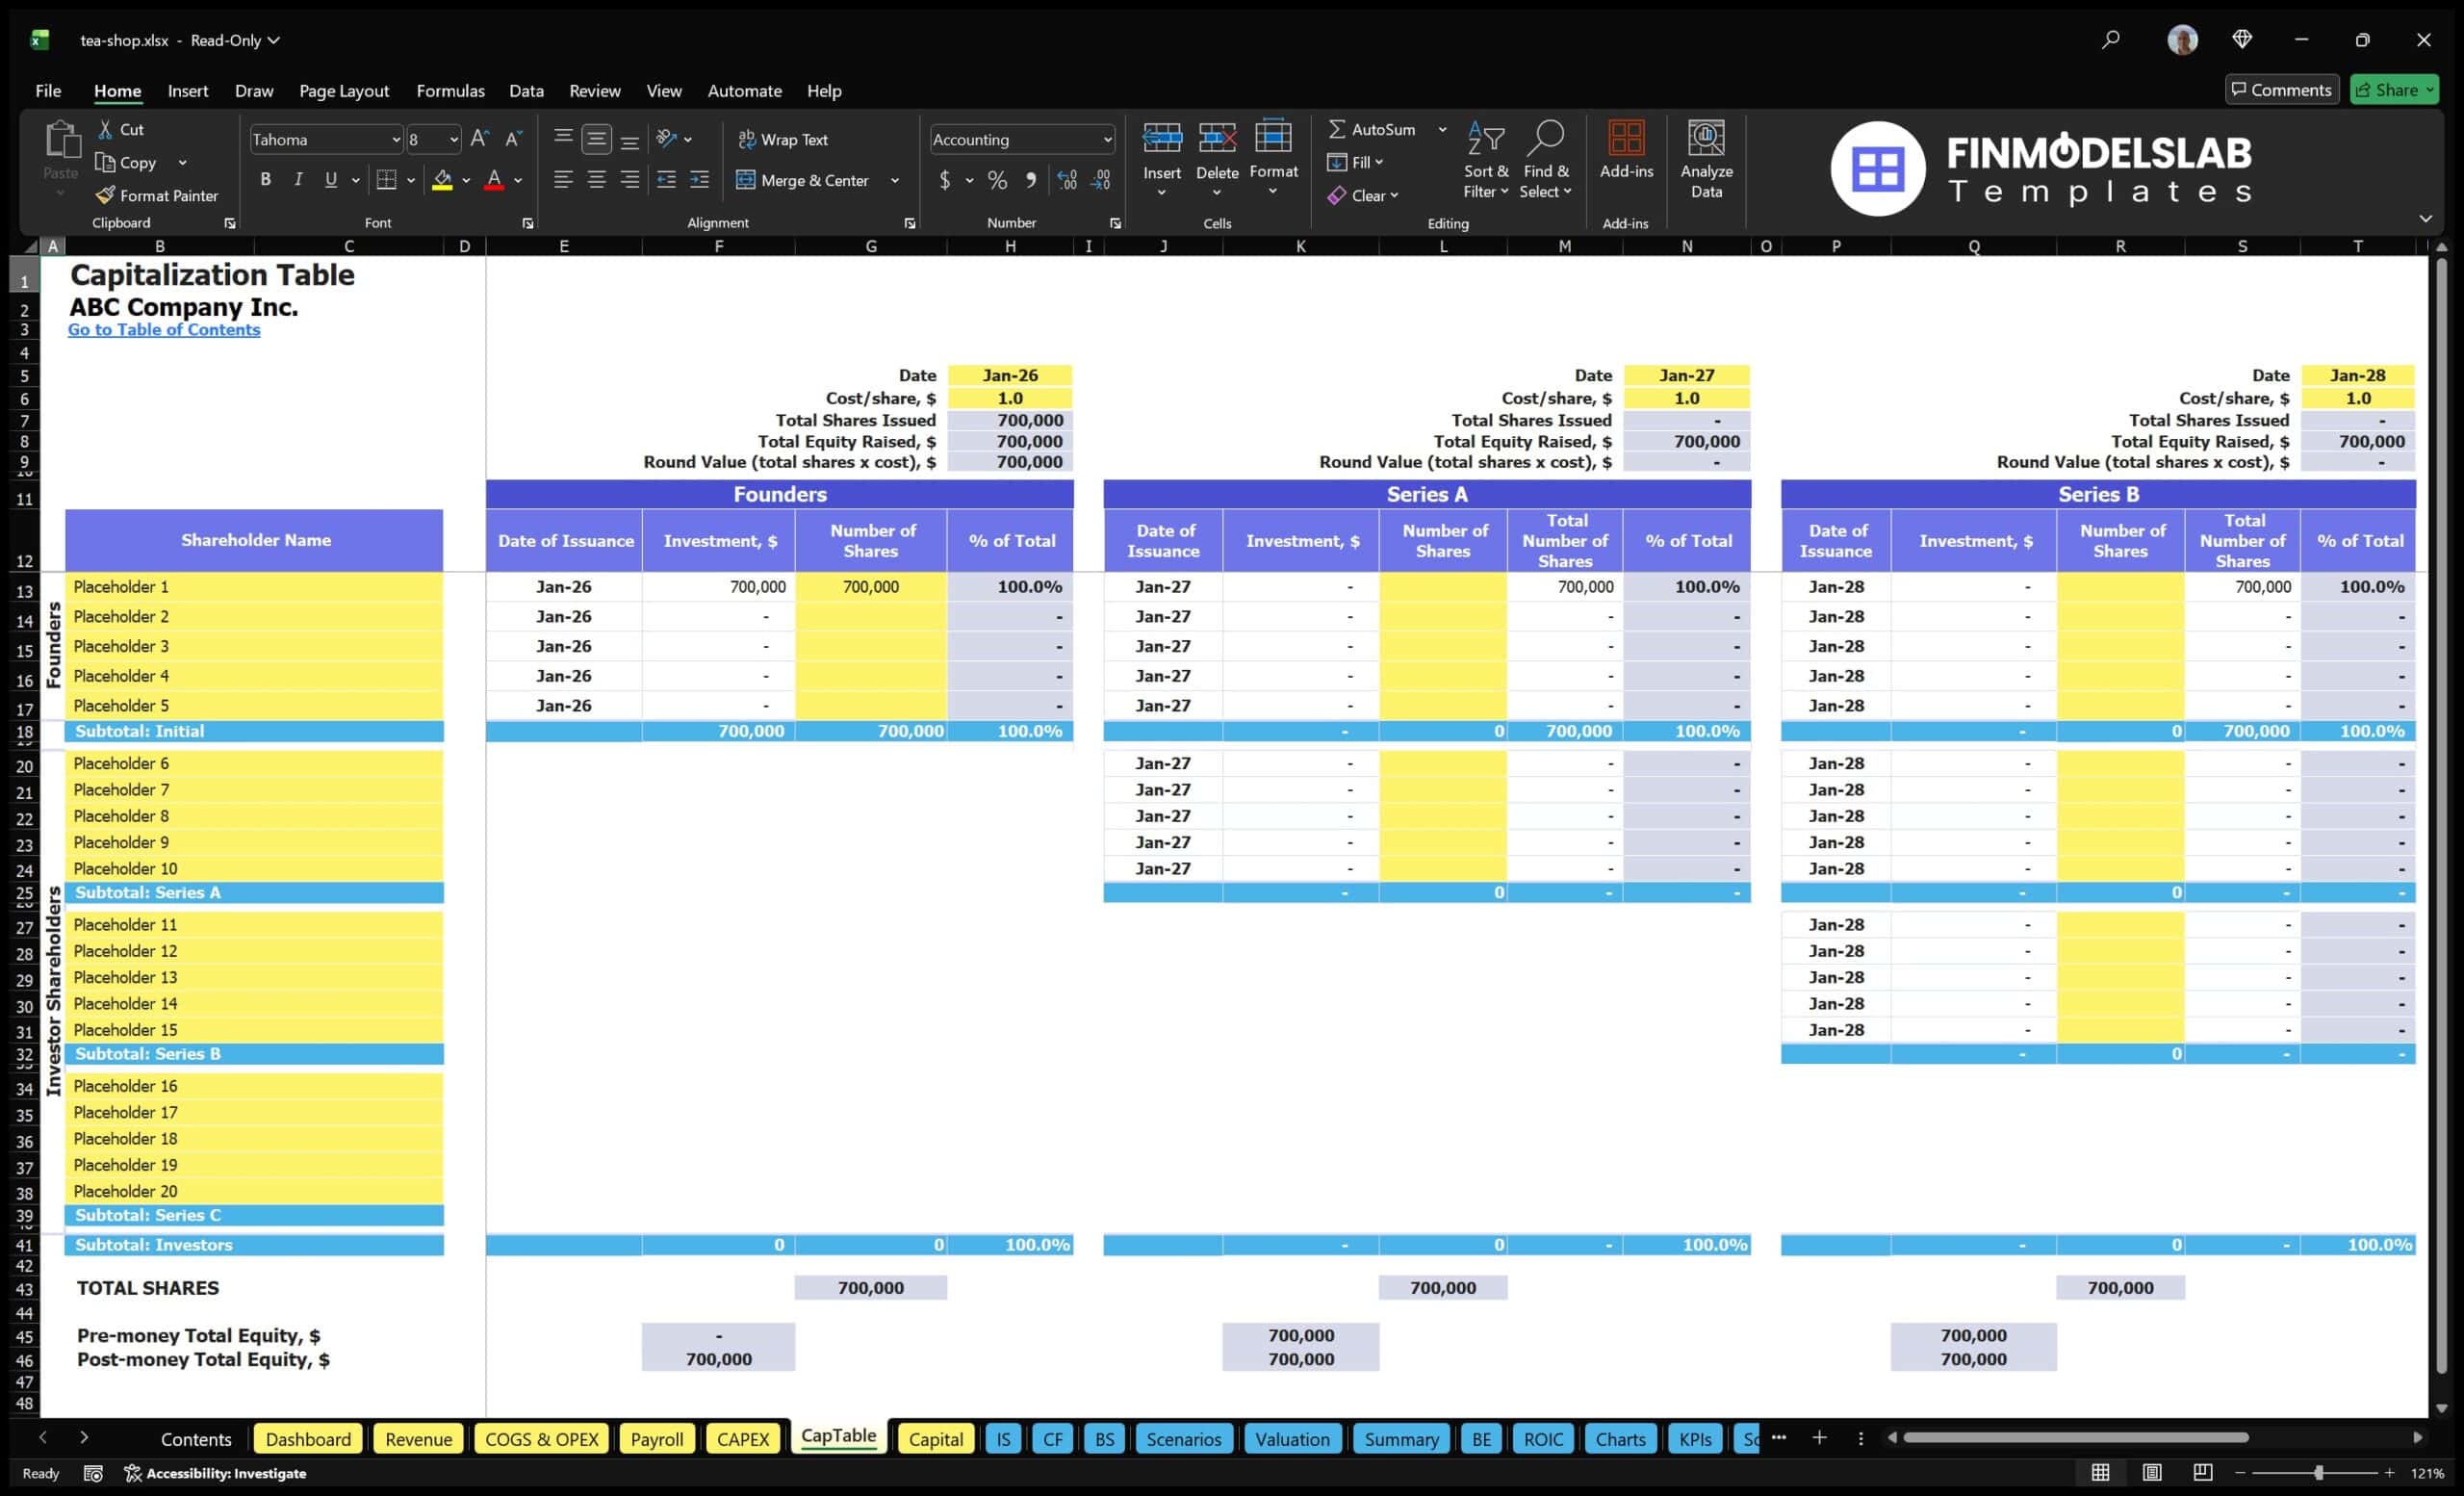
The startup cost and CAPEX planning component helps users estimate the initial investment required to launch or prepare the tea shop for operations. A tea shop may require a significant upfront budget for lease deposits, venue build-out, renovation, seating, counters, tea brewing equipment, refrigeration, kitchen appliances, point-of-sale systems, signage, furniture, opening inventory, licenses, permits, legal setup, branding, and pre-launch marketing. This component separates one-time capital expenditures from ongoing monthly costs so users can understand how much money is needed before the shop begins generating revenue. Inputs may include itemized cost categories, estimated purchase amounts, timing of payments, useful life assumptions, and funding sources. Outputs may include total startup capital required, pre-opening cash needs, capital expenditure schedules, and the impact of startup investment on cash flow and the balance sheet. This section is useful for budgeting, fundraising, and lender discussions because it helps users avoid underestimating launch costs. It also supports practical decision-making by showing whether the planned build-out, equipment package, and opening budget are aligned with the expected revenue potential of the tea shop.
Break-Even Analysis
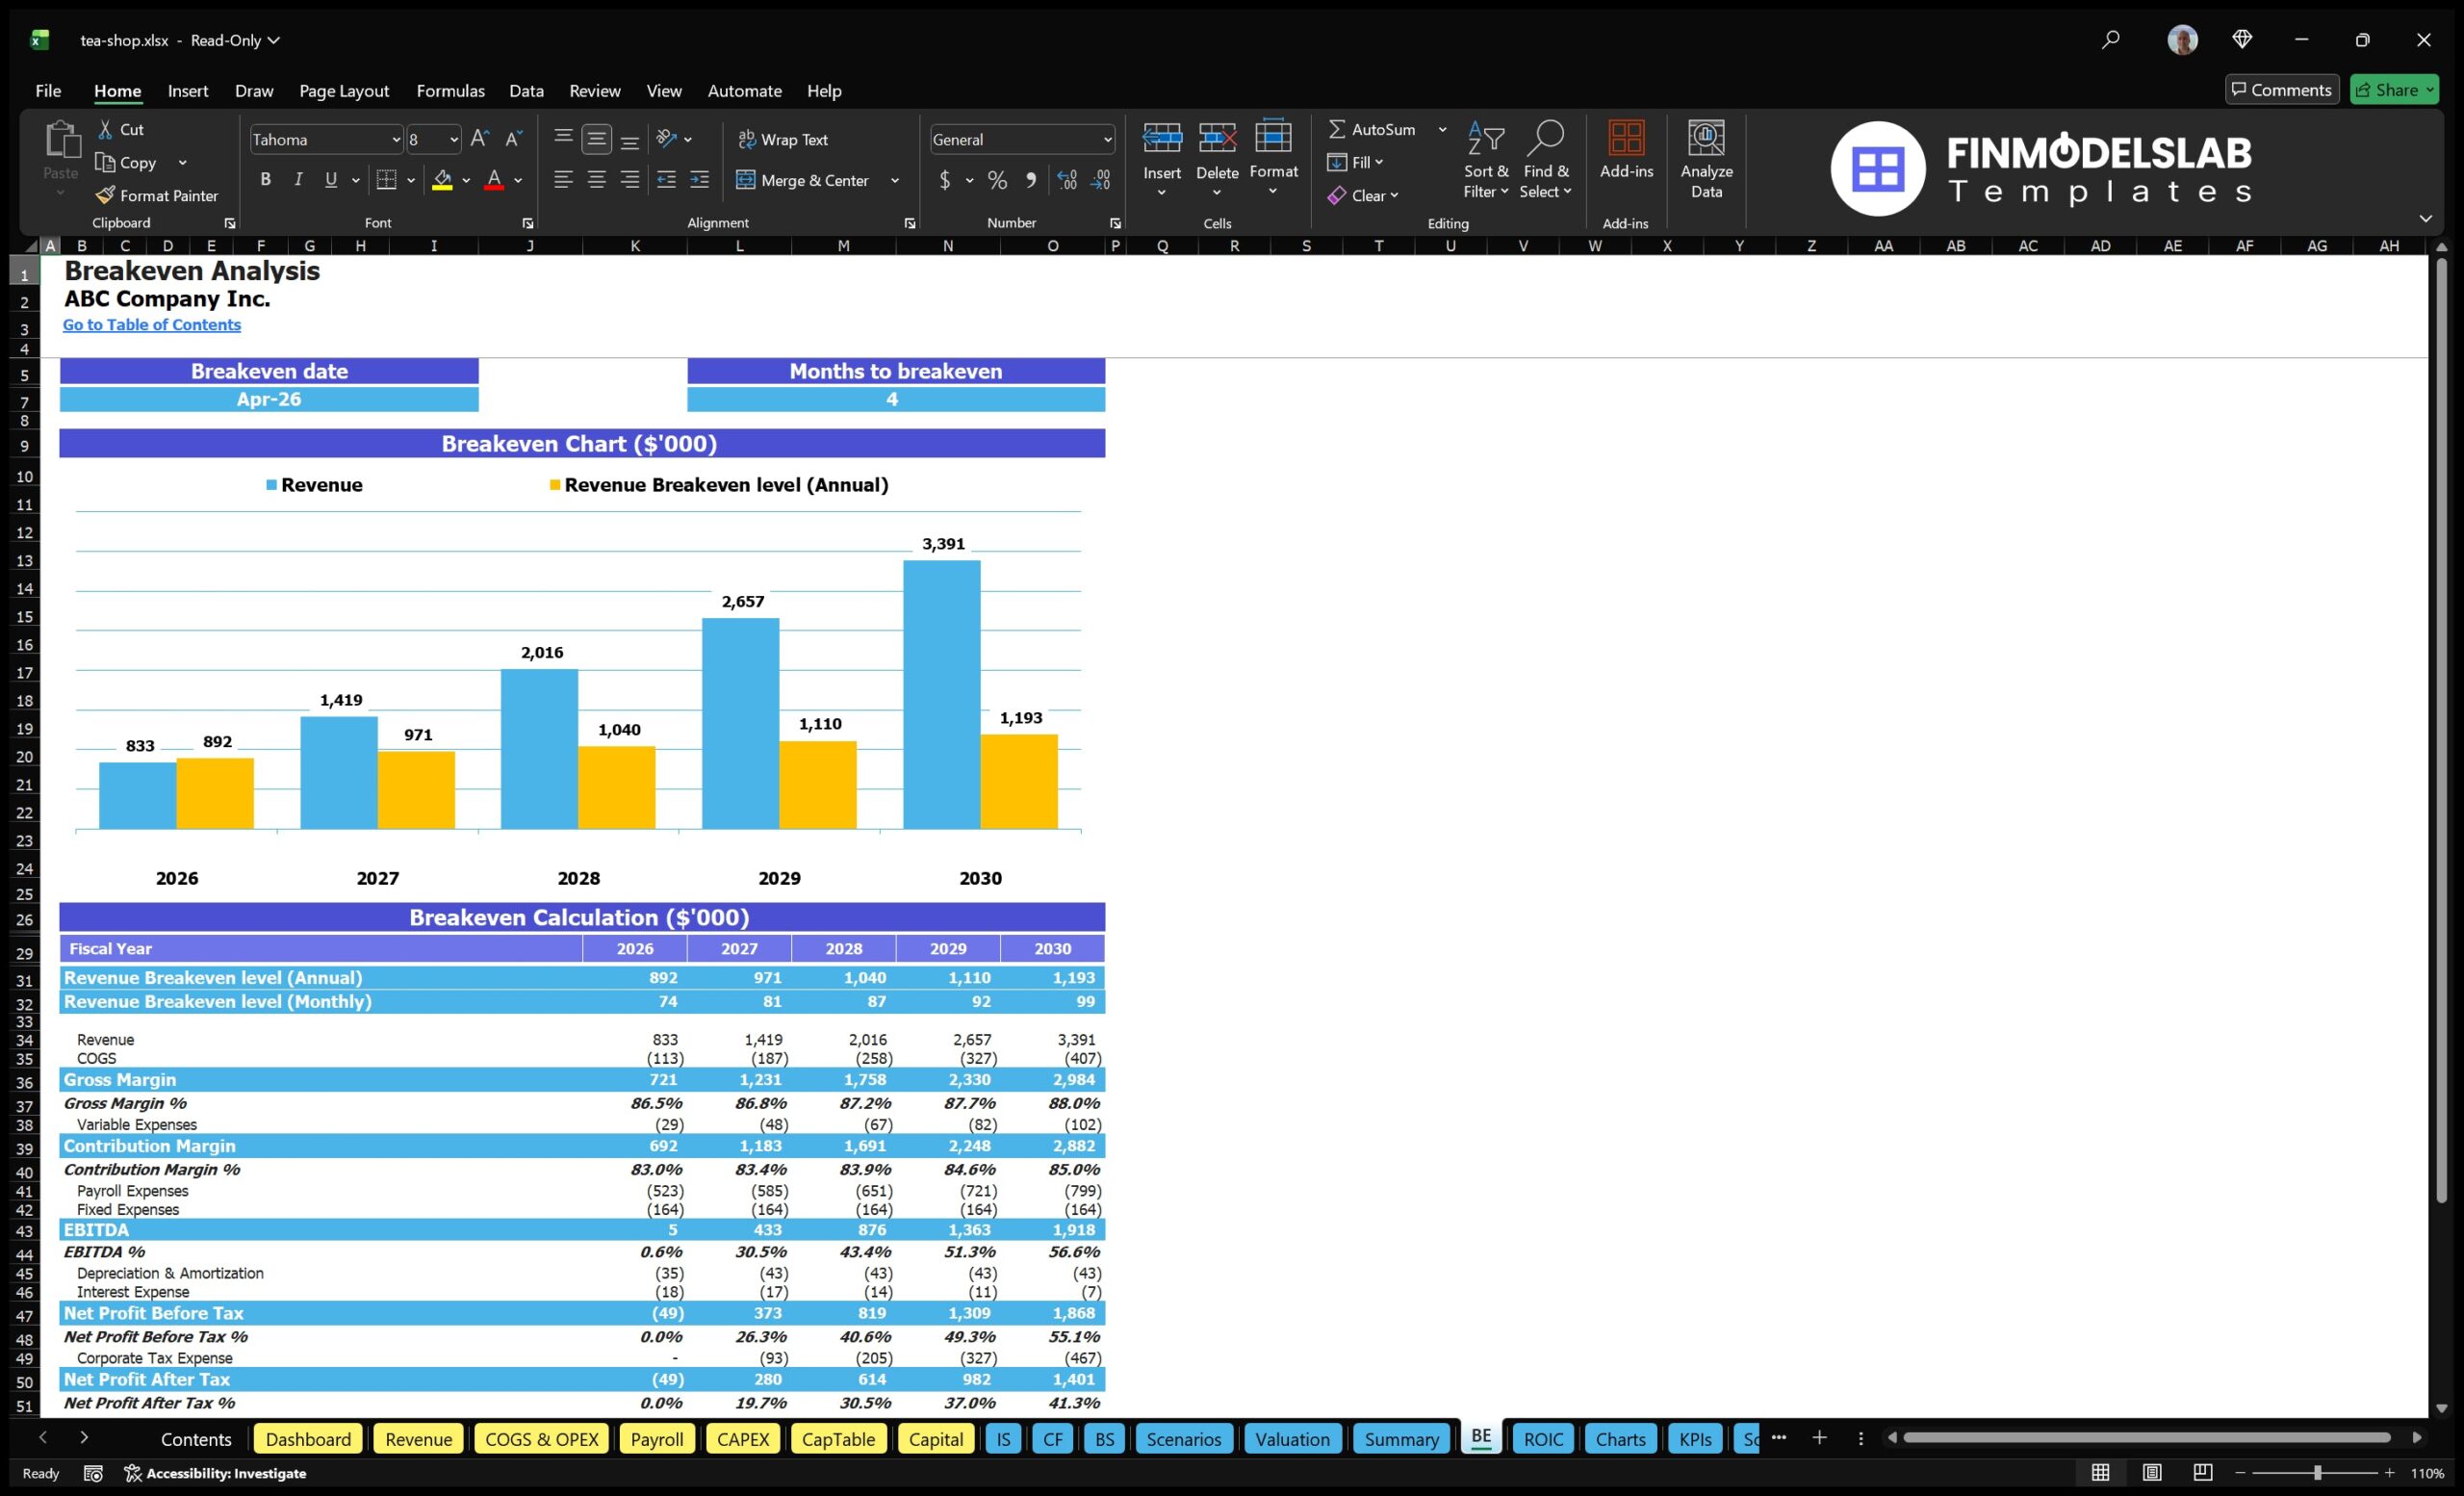
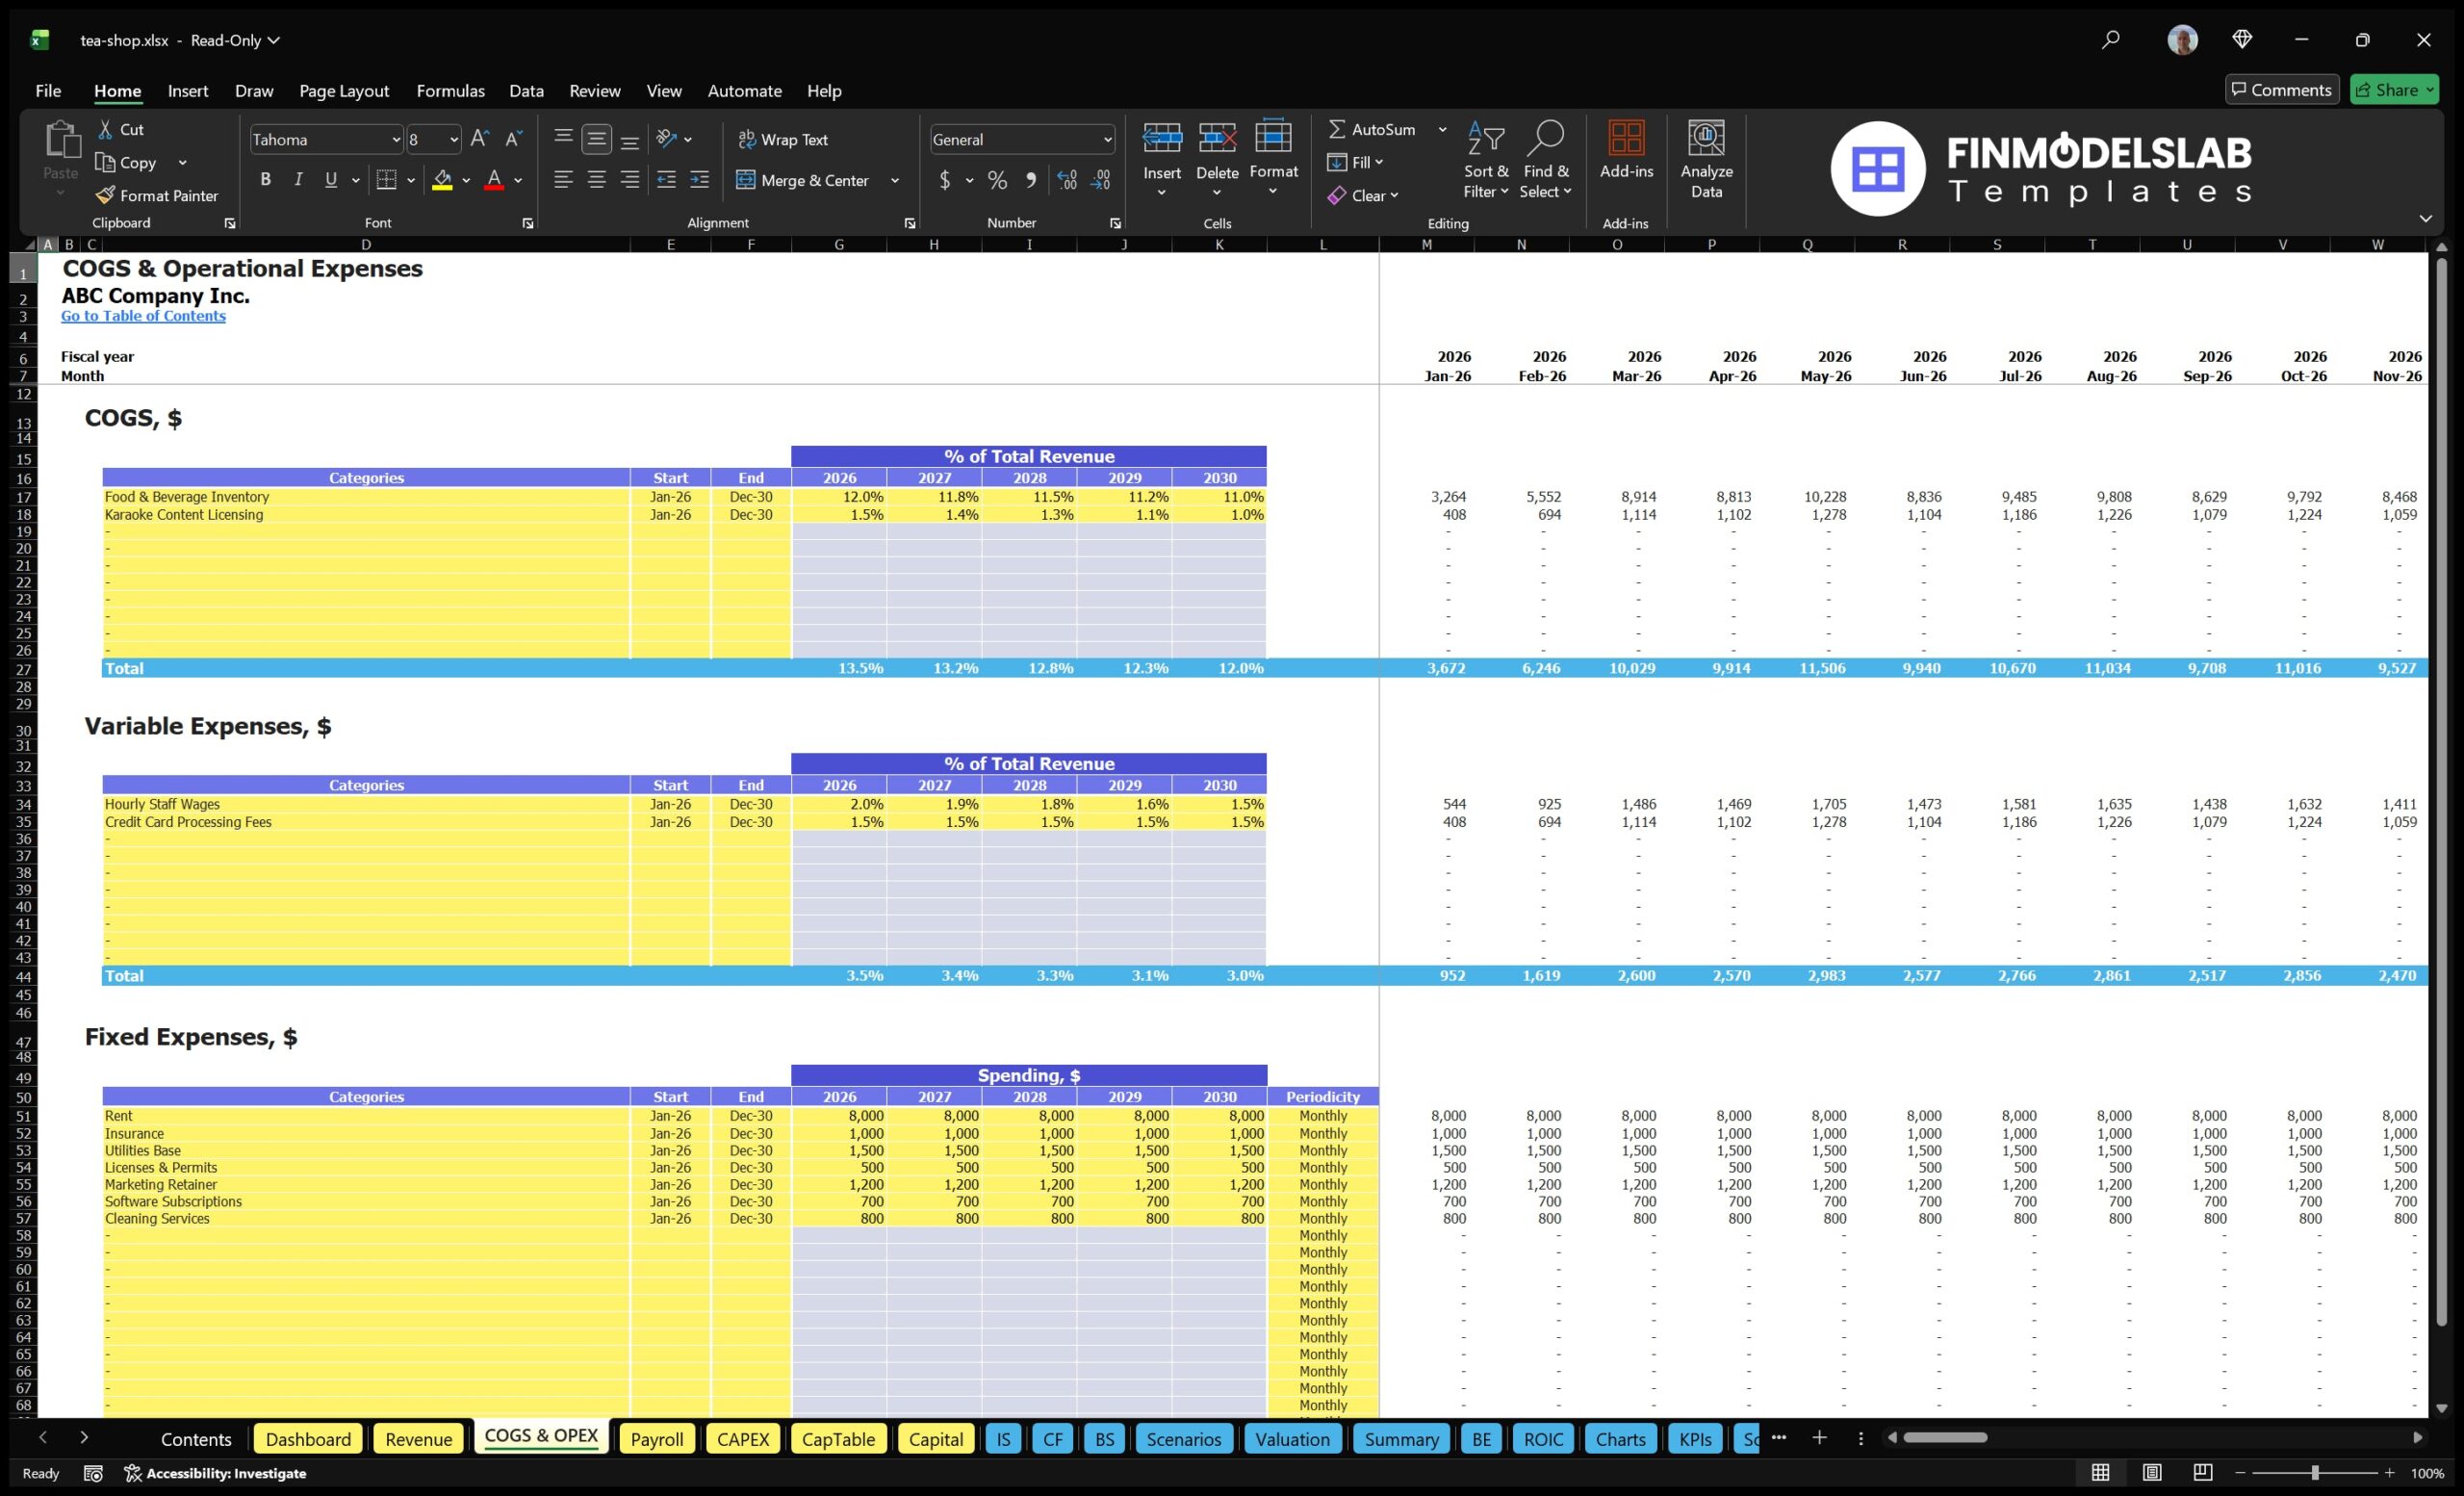
The break-even analysis component helps users understand when the tea shop may begin covering its costs and moving toward profitability. This section connects revenue assumptions, gross margin, fixed operating expenses, payroll, rent, utilities, marketing, and other recurring costs to determine the level of sales needed to break even. Inputs may include average order value, customer traffic, cost of goods sold, labor costs, monthly overhead, and growth assumptions. Outputs may include break-even revenue, break-even customer volume, estimated break-even month, and the relationship between fixed costs and required sales performance. This is especially important for a tea shop because early months often involve ramp-up risk, marketing spend, staff training, inventory setup, and unpredictable customer demand. A clear break-even analysis helps users evaluate whether their targets are realistic and whether they have enough working capital to survive until the business stabilizes. It also helps owners make decisions about pricing, menu mix, staffing, promotions, lease commitments, and operating hours. For investors and lenders, the break-even section provides a direct view of how quickly the business may become self-sustaining and what assumptions must be achieved to reach that point.
File types:
Excel – Single-User: .xlsx
Excel – Multi-User: .xlsx
Similar ProductsOther customers were also interested in...

 HenrySheykin
Coffee Shop Financial Model Excel Template
The Coffee Shop Financial Model helps entrepreneurs, founders, business owners, consultants, and ana... Read more
Gourmet Food Store Financial Model Excel Template
The Gourmet Food Store Financial Model helps entrepreneurs, founders, business owners, consultants, ... Read more
Juice Bar Financial Model Excel Template
The Juice Bar Financial Model helps entrepreneurs, founders, consultants, analysts, and business own... Read more
Coffee Truck Financial Model Excel Template
The Coffee Truck Financial Model Template helps entrepreneurs, founders, consultants, and business p... Read more
Coffeehouse Financial Model Excel Template
The Coffee Shop Financial Model helps entrepreneurs, founders, business owners, consultants, and ana... Read more
Tea Cafe Financial Model Excel Template
The Tea Room Financial Model helps entrepreneurs, operators, consultants, and business planners turn... Read more
Confectionery Shop Financial Model Excel Template
The Confectionery Shop Financial Model helps turn a candy shop, sweet shop, dessert retail concept, ... Read more
Cat Cafe Financial Model Excel Template
The Cat Cafe Financial Model helps entrepreneurs, founders, business owners, consultants, and analys... Read more
Karaoke Bar Business Plan Financial Model Excel Te...
The Karaoke Bar Financial Model helps entrepreneurs, business owners, consultants, founders, and ana... Read more
All Day Bar & Restaurant Financial Model Excel...
The All-Day Restaurant Financial Model helps users turn a food and beverage concept into a structure... Read more
You must log in to submit a review.