
0 ITEMS

Online Bank Financial Model Excel Template
The Online Bank Financial Model Financial Model Template helps founders, fintech entrepreneurs, consultants, analysts, and business planners build a structured forecast for launching or scaling a digital bank, neobank, or internet banking platform. Instead of starting with a blank spreadsheet, users get a ready-to-use planning framework designed around the financial logic of an online bank, including customer growth, deposits, lending activity, interest income, non-interest revenue, technology costs, payroll, regulatory-related expenses, cash flow, and profitability. The template is fully editable, so assumptions can be adapted to a specific market, launch strategy, product mix, pricing plan, and funding approach. This template is useful for preparing business plans, investor materials, funding documents, internal budgets, and strategic planning presentations. It helps users connect revenue assumptions with the cost structure required to operate a digital banking business, including the relationship between loan balances, deposit growth, interest spreads, fee income, customer acquisition costs, cloud infrastructure, software licenses, staffing, compliance support, and other operating expenses. By organizing these assumptions in one model, the template gives decision-makers a clearer view of how the business may perform over time and what must happen for the bank to become financially sustainable. The model supports practical financial planning by helping users estimate startup costs, ongoing operating expenses, payroll requirements, cash flow needs, and profitability across a multi-year forecast. It can be used to test different growth expectations, review low, base, and high scenarios, assess whether assumptions are realistic, and understand how changes in customer volume, lending growth, interest margin, or expenses affect the bottom line. This is especially important for an online bank, where early investment in technology, licensing, infrastructure, customer acquisition, and team building can create significant upfront cash needs before profitability is reached. With built-in outputs such as financial statements, charts, dashboards, key performance indicators, profitability analysis, and break-even insights, the Online Bank Financial Model Financial Model Template helps users make more informed decisions before committing capital or presenting the opportunity to stakeholders. It is designed for people who need a professional, customizable, and investor-ready financial model that can support planning conversations, funding discussions, operational budgeting, and long-term business strategy.
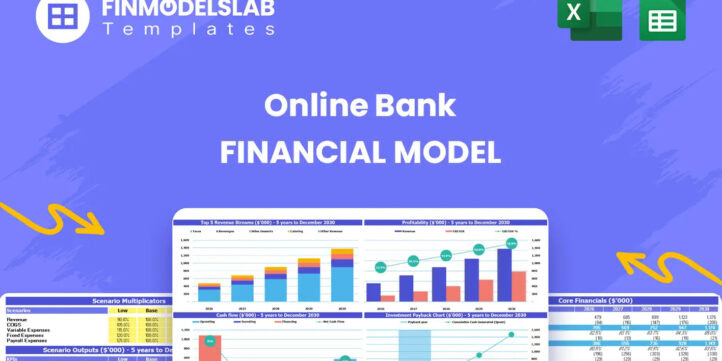


Financial Model Overview
The Online Bank Financial Model Financial Model Template gives entrepreneurs, fintech founders, consultants, analysts, and business owners a structured way to forecast the financial performance of a digital bank, neobank, or internet banking platform. Online banking businesses have a different financial profile from many other startups because growth depends on customer acquisition, deposit balances, loan origination, net interest margin, fee-based income, regulatory readiness, technology infrastructure, capital planning, and trust-building over time. This template brings those moving parts into one editable financial model so users can plan revenue, startup investment, operating expenses, payroll, cash flow, profitability, and funding needs without building the framework from scratch. It is designed to support business planning, investor presentations, loan applications, internal budgeting, scenario testing, and strategic decision-making. The model can be customized for a new online bank concept, a fintech banking product, an expansion plan, or a digital finance platform that needs a professional view of future financial performance.
All-in-One Dashboard
The all-in-one dashboard gives users a central view of the most important inputs and outputs in the Online Bank Financial Model. This component is designed to reduce the time spent moving between tabs by summarizing the core assumptions, forecast results, and financial indicators that matter most when planning an online bank. Users can review high-level revenue projections, expense trends, profitability timing, cash flow movement, investment needs, and key banking metrics from one organized area. The dashboard may draw from assumptions such as customer growth, loan balances, deposit balances, interest rates, cost of funds, fee revenue, payroll, technology costs, and marketing spend, then translate those assumptions into useful outputs for management review. For a digital bank, this is especially helpful because decision-makers need to understand both operating performance and balance sheet growth at the same time. The dashboard makes it easier to see whether the business plan is financially coherent, whether the projected cost structure supports the expected revenue, and whether liquidity remains sufficient during the early growth period. It is useful for founders preparing investor discussions, consultants presenting financial plans, and management teams that need a quick but meaningful view of the model’s overall performance.
Low, Base, and High Scenario Analysis
The low, base, and high scenario analysis component allows users to compare multiple versions of the online bank forecast using different growth and performance assumptions. Instead of relying on a single forecast, users can test conservative, expected, and optimistic cases to understand how the business may perform under different market conditions. Inputs may include customer acquisition speed, deposit growth, loan portfolio expansion, interest rate spread, non-interest income, customer acquisition cost, payroll ramp-up, technology spending, and capital requirements. The low case can help identify downside risk and funding pressure, while the base case can represent the most realistic operating plan. The high case can show the impact of stronger customer adoption, higher revenue per user, improved net interest margin, or faster scaling. For planning an online bank, this component is valuable because small changes in assumptions can have a large impact on profitability, cash flow, capital needs, and return metrics. It helps users prepare for investor questions, stress-test their business model, and make better strategic decisions before committing to major spending. Scenario analysis also supports internal planning by helping teams identify which assumptions are most sensitive and which levers can be adjusted if performance comes in below expectations.
Professional Charts
The professional charts component converts key financial results into clear visual outputs that can be used for presentations, board discussions, investor updates, and business planning documents. A financial model for an online bank can contain many interconnected assumptions, including revenue streams, cost categories, asset growth, liability growth, cash flow, profitability, headcount, and return metrics. Charts make those results easier to interpret by showing trends over time, comparisons between scenarios, and relationships between major financial drivers. This component may visualize revenue growth, EBITDA progression, cash balance trends, loan portfolio expansion, deposit balances, expense composition, break-even timing, customer growth, or key performance indicators. For founders and analysts, these visuals help communicate the financial story behind the numbers without requiring stakeholders to inspect every formula or worksheet. Professional charts are also useful for identifying issues inside the plan, such as expenses growing faster than revenue, cash balances declining during a specific period, or profitability depending too heavily on a single revenue stream. By presenting complex online banking economics in a more accessible format, this component supports faster decision-making and helps users create more polished, investor-ready materials.
ROE Components and DuPont Analysis
The ROE components and DuPont analysis section helps users understand what drives return on equity in the Online Bank Financial Model. Return on equity is a critical metric for banks because it connects profitability with the capital required to support the business. This component breaks ROE into underlying drivers, which may include profit margin, asset efficiency, leverage, net interest income, operating efficiency, and equity base. For an online bank, DuPont-style analysis is useful because strong revenue growth alone does not guarantee attractive returns if operating costs, credit risk, funding costs, or capital requirements are too high. Users can analyze how changes in net income, asset growth, balance sheet structure, and equity investment affect shareholder returns over time. The section helps founders and investors evaluate whether the projected business can generate returns that justify the capital required to launch and scale. It also supports strategic planning by showing whether ROE improvement is expected to come from better margins, more efficient asset deployment, stronger fee income, lower expenses, or increased operating leverage. This makes the model more valuable for funding discussions, board-level planning, and performance benchmarking against other fintech or banking businesses.
Revenue Inputs
The revenue inputs section gives users a structured place to define the assumptions that drive income for the online bank. Because an online bank may earn revenue from multiple sources, this component can include assumptions for net interest income, personal loans, auto loans, mortgage lending, investment securities, account fees, interchange income, wealth management services, subscription features, and other non-interest revenue lines. Users can customize loan balances, interest rates, deposit costs, customer growth, product adoption rates, average balances, fee percentages, transaction volume, and service mix to reflect their specific business plan. This section is important because revenue projections are only as useful as the assumptions behind them. By documenting revenue drivers clearly, the template helps users understand how customer acquisition, product usage, lending activity, and interest spreads combine to create the top line. For an online bank, revenue modeling must also account for timing, since deposits, loans, and customer relationships may grow gradually after launch. This component helps founders and analysts test whether projected growth is realistic, whether revenue streams are diversified enough, and whether the business can generate sufficient income to cover payroll, technology, compliance, marketing, and other operating costs.
Bank-Ready Reports
The bank-ready reports component organizes the forecast into professional financial outputs that can be reviewed by investors, lenders, advisors, partners, and internal stakeholders. These reports may include projected income statements, cash flow statements, balance sheets, annual summaries, monthly forecasts, profitability views, and key performance summaries. For an online bank, lender-friendly and investor-ready reporting is especially important because stakeholders need to see how operating performance connects to balance sheet growth, funding needs, cash flow, and long-term profitability. The reports can help users explain how revenue is generated, how expenses scale, how startup investment is used, and when the business is expected to become profitable. They also provide a structured way to present assumptions around deposits, loans, interest income, funding costs, payroll, technology infrastructure, and customer acquisition. This component is useful for business plan attachments, investor pitch support, internal planning meetings, and financing discussions. By producing clean and organized outputs, the model helps users avoid presenting disconnected calculations or informal estimates. Instead, the Online Bank Financial Model provides a more credible financial package that supports decision-making and helps stakeholders assess the business with greater confidence.
Revenue Breakdown
The revenue breakdown component gives users a detailed view of how different revenue streams contribute to total income over the forecast period. Rather than showing only one combined revenue line, this section separates the major sources of online banking revenue so users can evaluate the strength, mix, and scalability of each stream. It may include interest income from loans, income from investments, account fees, interchange revenue, wealth management revenue, premium account services, transaction-related fees, and other non-interest income. This breakdown helps users understand which products or services drive the largest share of revenue and how that mix changes as the business grows. For example, a digital bank may begin with account and interchange revenue but later rely more heavily on lending products as customer balances and credit offerings expand. The component can use inputs such as adoption rates, average balances, transaction volume, loan portfolio growth, interest yields, and fee assumptions to generate a more granular revenue forecast. This is valuable for planning because it highlights concentration risk, identifies high-margin opportunities, and helps management decide where to focus marketing, product development, and capital allocation. It also gives investors a clearer view of how the bank expects to monetize its customer base.
KPI Dashboard
The KPI dashboard component tracks the performance metrics that matter most for managing and evaluating an online bank. While financial statements show the overall results, key performance indicators help users understand the operational and financial drivers behind those results. This section may include metrics such as net interest margin, return on equity, customer growth, deposit growth, loan-to-deposit ratio, revenue per customer, customer acquisition cost, cash burn, EBITDA margin, operating expense ratio, payback period, and profitability timing. For a digital bank, KPIs are essential because success depends not only on revenue but also on efficient customer acquisition, strong balance sheet growth, disciplined cost control, and sustainable margins. The dashboard helps users monitor whether the business is moving toward its financial goals and whether assumptions remain realistic as the plan evolves. It can also support benchmarking by comparing projected performance against market expectations or internal targets. This component is useful for investor updates, management reporting, monthly reviews, and strategic planning because it turns detailed model outputs into decision-ready indicators. By keeping the most important performance measures visible, the KPI dashboard helps users spot risks early, communicate progress clearly, and make more informed choices about growth, staffing, spending, and funding.
Startup Cost and Operating Expense Planning
The startup cost and operating expense planning component helps users estimate both the initial investment required to launch the online bank and the recurring costs needed to operate it. Startup costs may include software development, core banking system licensing, cloud infrastructure setup, regulatory preparation, legal support, compliance setup, security systems, brand development, initial marketing, office setup, and working capital reserves. Operating expenses may include payroll, benefits, cloud hosting, software subscriptions, data services, compliance support, legal retainers, fraud prevention, customer support, insurance, marketing, and customer acquisition costs. This section is useful because online banks often require significant upfront investment before meaningful revenue is generated, especially when technology, licensing, security, and regulatory readiness must be established early. Users can adjust cost categories, timing, fixed expenses, variable expenses, and scaling assumptions to match their launch strategy. The outputs help estimate how much capital is needed, how long the business can operate before reaching profitability, and which costs have the greatest impact on monthly burn. For founders preparing funding documents, this component provides a defensible cost structure that can support investor conversations. For operators, it helps create a more realistic budget and reduces the risk of underestimating the expenses required to build a secure, scalable digital banking platform.
Break-Even and Funding Requirements Analysis
The break-even and funding requirements analysis component helps users evaluate when the online bank may become profitable and how much capital may be required to reach that point. This section connects projected revenue, gross margin, operating expenses, payroll, startup costs, cash flow, and investment timing to show whether the business can sustain itself under the selected assumptions. Inputs may include customer growth, net interest margin, fee income, technology expenses, customer acquisition costs, headcount plans, capital expenditures, and working capital needs. Outputs may include the break-even month, EBITDA positive timing, cumulative cash requirement, minimum cash balance, payback period, and potential funding gap. This is especially important for an online bank because the business may need to invest heavily in platform development, compliance, staffing, infrastructure, and customer acquisition before revenue reaches scale.
File types:
Excel – Single-User: .xlsx
Excel – Multi-User: .xlsx
Similar ProductsOther customers were also interested in...


 HenrySheykin
Legal Services Financial Model Excel Template
The Legal Services Financial Model Financial Model Template helps entrepreneurs, law firm founders, ... Read more

Retail Bank Financial Model Excel Template
The Retail Bank Financial Model Financial Model Template helps users build a structured five-year fo... Read more
Mortgage Bank Financial Model Excel Template
The Mortgage Bank Financial Model helps users turn a mortgage banking concept, expansion plan, or fu... Read more
Offshore Bank Financial Model Excel Template
The Financial Model Template helps founders, banking entrepreneurs, consultants, analysts, and busin... Read more
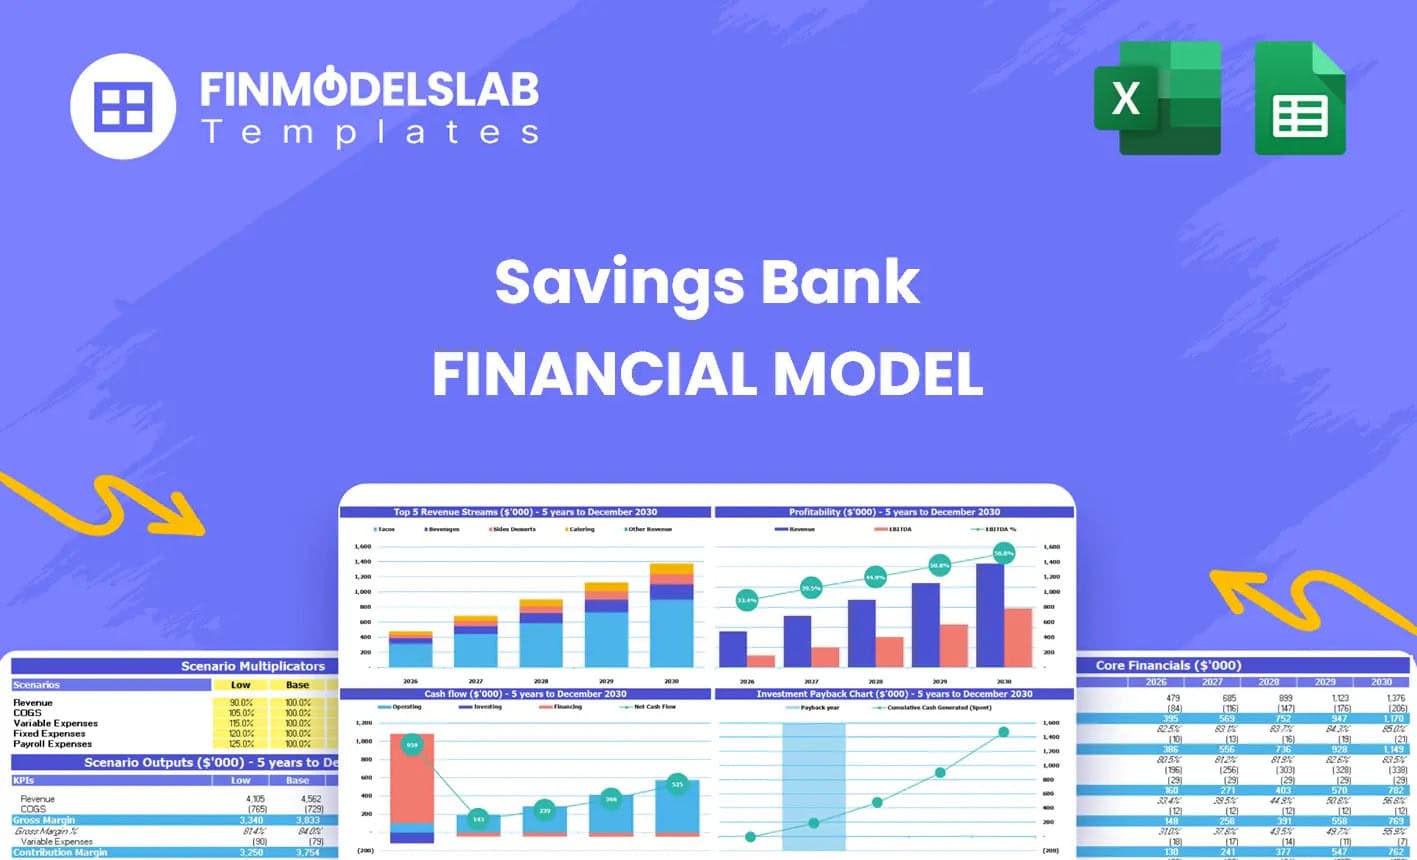
Savings Bank Financial Model Excel Template
The Savings Bank Financial Model helps entrepreneurs, bank founders, consultants, analysts, and busi... Read more

 Pushkar
Banking Model with 3 Statements – Dividend D...
Banking Model with 3 Statements - Dividend Discount (DDM) and Net Asset Value (NAV) based Valuation ... Read more

 Giorgos
Online Payments Platform – 5 Year Financial Mode...
Financial Model providing an advanced 5-year financial plan for a startup Online Payments Platform p... Read more
 Eastwich Advisors
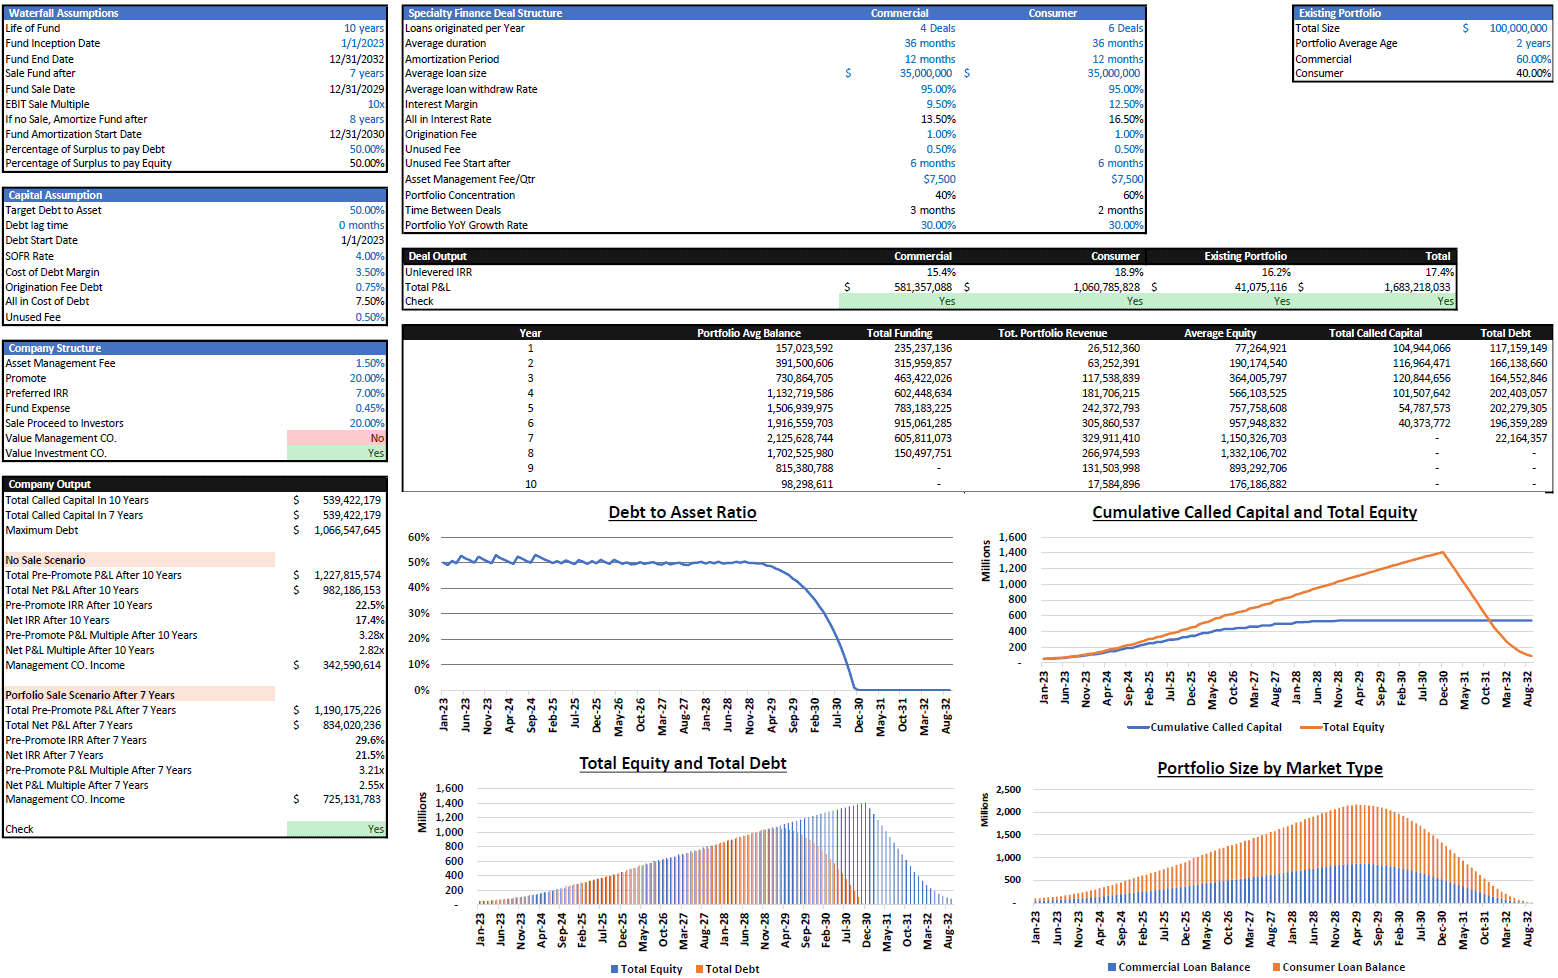
Debt Fund Excel Model
Explore the Debt Fund Excel Model, a comprehensive tool for evaluating new credit fund opportunities... Read more

Buy Now Pay Later (BNPL) Platform – 5 Year F...
Financial Model presenting an advanced 5-year financial plan for a startup BNPL Platform which provi... Read more

Commercial Bank Financial Model – Dynamic 10...
Financial model presenting an operating and valuation scenario for a Commercial Bank. The model c... Read more
You must log in to submit a review.