
0 ITEMS

Medical Tourism Financial Model Excel Template
The Medical Tourism Financial Model Template helps users turn a cross-border healthcare business idea into a structured, editable financial forecast. It is designed for medical tourism platforms, international patient facilitators, healthcare travel agencies, clinic networks, and founders building a marketplace that connects patients with hospitals, specialists, and treatment providers. Instead of trying to assemble a forecast from scattered spreadsheets, users can work from a ready-made model that organizes revenue assumptions, startup costs, operating expenses, payroll, cash flow, profitability, and investor return metrics in one place. This template is useful for entrepreneurs, business owners, consultants, analysts, and anyone preparing a business plan, funding presentation, lender package, or internal financial review. It supports financial planning for a model where revenue may come from procedure commissions, provider subscriptions, promoted listings, advertising fees, concierge services, or other patient support services. Users can adjust patient volumes, average treatment values, commission rates, provider adoption, marketing spend, staffing levels, technology costs, and other key inputs to reflect their own market, pricing strategy, and growth plan. The Medical Tourism Financial Model is built to help users understand whether their business can reach sustainable profitability and maintain healthy cash flow as it scales. It allows buyers to test revenue assumptions, estimate startup investment, forecast operating expenses, plan payroll, review profit and loss performance, evaluate cash flow timing, and identify the break-even point. This is especially important in medical tourism, where customer acquisition, provider partnerships, trust-building, compliance, and service quality can all affect financial performance. With investor-ready formatting, dynamic outputs, professional charts, scenario views, bank-ready reports, and performance dashboards, the template helps users make clearer decisions before launch or expansion. It can support conversations with investors, banks, partners, and internal teams by showing how the business model may perform under different assumptions. Fully customizable and compatible with Microsoft Excel and Google Sheets, the template saves time while giving users a practical framework for planning, budgeting, forecasting, and improving decision-making.
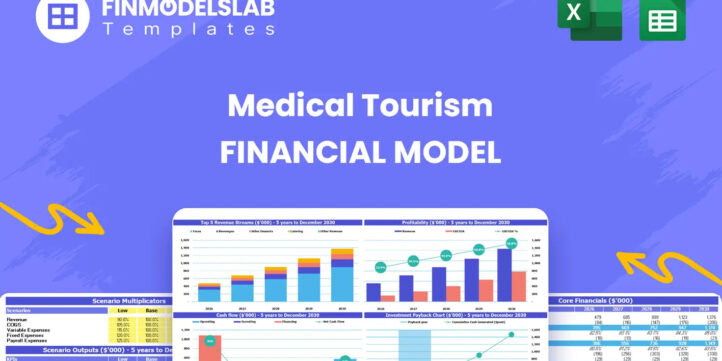


Financial Model Overview
The Medical Tourism Financial Model Template gives founders, operators, consultants, and analysts a structured way to evaluate the economics of a medical tourism business before launch, expansion, or fundraising. Medical tourism involves more than simply connecting patients with healthcare providers. A realistic forecast needs to account for international patient demand, high-value treatment transactions, provider partnerships, commission structures, subscription fees, marketing costs, concierge support, technology investment, staffing, and cash flow timing. This template brings those assumptions together in one editable financial model so users can estimate revenue, startup investment, operating costs, profitability, investor returns, and funding needs without building the spreadsheet from scratch. It is designed to support business plans, investor presentations, lender discussions, internal budgeting, and strategic decision-making for medical travel platforms, healthcare facilitator businesses, clinic networks, and international patient service providers.
All-in-One Dashboard
The all-in-one dashboard gives users a centralized view of the most important inputs and outputs in the Medical Tourism Financial Model. Instead of switching between separate sheets to understand the business, users can review the core assumptions, financial results, and performance indicators in one organized area. This section may include key inputs such as patient volume, average treatment value, commission percentage, provider subscription pricing, advertising revenue, payroll assumptions, operating expense levels, and startup investment. It then connects those inputs to outputs such as revenue, gross profit, EBITDA, cash balance, payback period, return metrics, and other high-level results. For planning and funding purposes, the dashboard is valuable because it helps users quickly understand how the business behaves financially and which assumptions have the greatest impact on performance. It also makes the model easier to use for non-financial founders, since the most relevant information is presented in a clear, decision-focused format.
Low Base High Scenario Analysis
The low, base, and high scenario analysis section helps users test how the medical tourism business may perform under different market conditions. A base case can represent the expected plan, while a low case can reflect slower patient acquisition, lower provider adoption, weaker commission rates, or higher marketing costs. A high case can show what happens if patient demand grows faster, average procedure values increase, provider subscriptions scale more quickly, or advertising and promoted listing revenue becomes stronger. This component is especially useful in medical tourism because the business can be affected by travel trends, patient trust, destination reputation, procedure pricing, provider quality, marketing performance, and international regulations. By comparing multiple scenarios, users can see how revenue, expenses, cash flow, profitability, and funding requirements change when assumptions move up or down. This supports better decision-making because founders and investors can evaluate downside risk, upside opportunity, and the financial resilience of the business model before committing capital.
Professional Charts
The professional charts section converts the model’s financial outputs into visual reports that are easier to interpret and present. Charts may show revenue growth, EBITDA progression, cash balance, expense trends, revenue stream mix, patient volume growth, provider subscription growth, or key performance indicators over time. For a medical tourism business, visualizing the forecast is important because stakeholders often need to understand how the platform or service scales, how quickly revenue grows, and whether the cost structure remains manageable as patient traffic increases. This component helps users communicate the financial story clearly in meetings with investors, banks, strategic partners, healthcare providers, and internal teams. It also makes it easier to spot trends that may not be obvious in rows of numbers, such as rising marketing costs, improving margins, or a period when cash may become tight. The charts are useful for pitch decks, business plans, financial reviews, and management updates because they present complex forecast data in a clean and professional format.
ROE Components and DuPont Analysis
The ROE components and DuPont analysis section helps users understand the drivers behind return on equity rather than looking at a single return figure in isolation. DuPont analysis typically breaks ROE into underlying elements such as profitability, asset efficiency, and leverage, allowing users to see whether returns are being driven by strong margins, efficient use of capital, or financing structure. In a medical tourism financial model, this can be useful for evaluating how commission margins, provider subscription economics, technology investment, working capital, and funding choices affect shareholder returns. The section may use outputs from the profit and loss statement, balance sheet, and cash flow forecast to calculate return metrics and explain the quality of those returns. This matters for investors because a high return can be more credible when users can demonstrate which operating factors are producing it. It also helps founders identify where improvement is needed, such as increasing gross margin, improving sales efficiency, controlling fixed costs, or using capital more effectively.
Revenue Inputs
The revenue inputs section is where users define the commercial engine of the Medical Tourism Financial Model. This component may include assumptions for patient inquiries, conversion rates, completed procedures, gross merchandise value, average order value for medical treatments, commission rates, monthly provider subscription fees, advertising fees, promoted listing revenue, concierge service fees, or other income streams. For a medical tourism platform or facilitator, revenue may depend on a combination of high-value procedure transactions and recurring provider relationships, so the model needs flexible inputs that reflect how the business actually earns money. Users can update the assumptions to match their target market, destination countries, treatment categories, hospital partnerships, pricing strategy, and growth expectations. The outputs from this section feed directly into the revenue forecast and profitability calculations, making it one of the most important planning areas in the template. Clear revenue inputs also make the forecast easier to defend in a business plan or funding discussion because stakeholders can see exactly how revenue is expected to be generated.
Bank-Ready Reports
The bank-ready reports section provides structured financial outputs that can be shared with lenders, investors, partners, and advisors. These reports may include projected profit and loss statements, cash flow forecasts, balance sheet summaries, annual financial summaries, monthly projections, and key performance metrics. For a medical tourism business seeking funding, professional reporting is essential because banks and investors need to understand revenue potential, expense structure, cash flow reliability, repayment capacity, and overall financial viability. This component helps users move beyond informal estimates by presenting the forecast in a format that is more suitable for external review. The reports can support loan applications, equity fundraising, internal approvals, partnership discussions, and strategic planning meetings. Because the reports are connected to the model’s assumptions, users can update their inputs and automatically refresh the outputs, saving time and reducing the risk of inconsistent figures across documents. This makes the template especially useful for founders who need credible financial statements without hiring a consultant to build a custom model from the ground up.
Revenue Breakdown
The revenue breakdown section gives users a detailed view of how total revenue is generated across different streams. In a medical tourism business, income may come from procedure commissions, provider subscription packages, hospital or clinic onboarding fees, promoted listings, advertising placements, concierge support, travel coordination fees, premium patient services, or other partnership revenue. This component helps users see which streams contribute the most to sales, how revenue mix changes over time, and whether the business is overly dependent on one source of income. Inputs may include the number of provider partners, subscription tiers, average medical procedure values, patient transaction volume, commission percentages, advertising uptake, and pricing for optional services. Outputs may show monthly and annual revenue by category, percentage contribution by stream, and growth trends across the forecast period. This is useful for planning because it helps users identify the strongest commercial opportunities, evaluate pricing strategy, and understand how recurring revenue and transaction-based revenue work together to support long-term profitability.
KPI Dashboard
The KPI dashboard section tracks the operating and financial metrics that matter most for managing a medical tourism business. Relevant key performance indicators may include patient inquiries, conversion rates, completed procedures, average order value, commission revenue, provider count, subscription revenue, customer acquisition cost, revenue per patient, EBITDA margin, cash balance, payback period, and other performance benchmarks. This component turns the model into a management tool rather than just a static forecast. Users can monitor whether growth is coming from more patients, higher treatment values, stronger provider participation, improved marketing efficiency, or better monetization of platform services. The KPI dashboard is valuable for decision-making because it helps users connect operational actions to financial outcomes. For example, if marketing spend rises but patient conversion does not improve, the model can show the effect on margins and cash flow. If provider subscriptions increase, the dashboard can show how recurring income improves stability. This section is also useful for investor updates because it presents performance in a concise, measurable, and benchmark-oriented way.
Break-Even Analysis
The break-even analysis section helps users identify when the medical tourism business can cover its operating expenses and begin generating profit. This component may use assumptions such as monthly fixed costs, payroll, marketing spend, technology expenses, variable service costs, commission margins, subscription revenue, patient volume, and average transaction values to calculate the level of activity required to break even. For a medical tourism company, this is especially important because early-stage spending on platform development, provider acquisition, brand credibility, paid marketing, and patient support can be significant before revenue reaches scale. The break-even section helps users understand how many completed procedures, provider subscriptions, or revenue-generating partnerships may be required to support the business. It is useful for budgeting because it shows whether the planned cost structure is realistic. It is also useful for funding because investors and lenders often want to know how quickly the business can reach sustainability and what assumptions must be achieved for profitability to occur. By adjusting inputs, users can test how lower marketing costs, higher commission rates, or stronger recurring revenue affect the break-even timeline.
Startup Costs and Funding Requirements
The startup costs and funding requirements section organizes the initial investment needed to launch and operate the medical tourism business through its early stages. This may include platform development, website and marketplace technology, CRM systems, payment infrastructure, legal setup, licensing, compliance advisory, provider onboarding, office setup, initial marketing campaigns, branding, staffing before revenue, working capital, insurance, and other pre-opening or launch expenses. The section helps users separate one-time startup costs from recurring operating expenses, which is essential for understanding how much capital is needed before the business can become self-sustaining. Outputs may include total startup investment, funding gap, use of funds, timing of cash needs, and the amount of capital required to maintain a safe cash balance during the forecast period. This is useful for founders preparing investor decks, loan applications, or internal launch budgets because it gives a clear target for fundraising and spending control. It also helps users avoid undercapitalization by showing whether the business has enough cash to support technology development, patient acquisition, provider relationships, payroll, and operations until revenue becomes consistent.
File types:
Excel – Single-User: .xlsx
Excel – Multi-User: .xlsx
Similar ProductsOther customers were also interested in...

 HenrySheykin
Medical Practice Financial Model Excel Template
The Medical Practice Financial Model helps users turn a clinic concept, expansion plan, or healthcar... Read more
Ophthalmology Financial Model Excel Template
The Ophthalmology Clinic Financial Model is a ready-to-use financial model template designed to help... Read more
Dental Practice Financial Model Excel Template
The Dental Clinic Financial Model helps users turn a dental practice concept, launch plan, or expans... Read more
Urgent Care Center Financial Model Excel Template
The Urgent Care Center Financial Model helps users turn a walk-in clinic concept into a structured f... Read more
Physiotherapy Financial Model Excel Template
The Physiotherapy Clinic Financial Model helps founders, clinic owners, consultants, analysts, and b... Read more
Clinic Financial Model Excel Template
The Healthcare Clinic Financial Model helps founders, clinic owners, consultants, analysts, and busi... Read more
Veterinary Financial Model Excel Template
The Veterinary Clinic Financial Model Financial Model Template helps entrepreneurs, clinic owners, c... Read more
Outpatient Clinic Financial Model Excel Template
The Outpatient Clinic Financial Model helps users turn a clinic business concept into a structured, ... Read more
Dialysis Center Financial Model Excel Template
The Hemodialysis Center Financial Model helps users evaluate the financial feasibility of launching,... Read more

Nutritionist Financial Model Excel Template
The Nutritionist Financial Model Financial Model Template helps turn a nutrition practice, dietitian... Read more
You must log in to submit a review.