
0 ITEMS

Seo Agency Financial Model Excel Template
The SEO Agency Financial Model Financial Model Template helps founders, consultants, agency owners, analysts, and business planners turn an SEO agency concept into a structured five-year financial forecast. Instead of building spreadsheets from scratch, users can enter their own assumptions for service pricing, customer acquisition, client retention, payroll, startup costs, operating expenses, and marketing spend, then review automated outputs for revenue, profitability, cash flow, funding needs, and long-term financial performance. It is designed to support both new SEO agencies preparing to launch and existing digital marketing businesses planning growth, hiring, new service packages, or investor discussions. This template is especially useful for understanding the economics of a service-based agency model. SEO agencies often depend on monthly retainers, content and link-building packages, local SEO plans, analytics services, and recurring client relationships. The model helps connect these revenue assumptions with the cost structure required to deliver the work, including staffing, contractor support, software, sales and marketing expenses, and general overhead. By organizing these drivers in one editable planning tool, users can evaluate whether their agency can scale profitably, how long it may take to reach break-even, and which assumptions have the greatest impact on financial results. Built for business planning, funding preparation, and internal decision-making, the SEO Agency Financial Model gives users a clearer view of monthly and annual performance. It can help estimate startup costs, calculate operating expenses, forecast cash flow, review profit and loss results, and prepare lender or investor-ready financial outputs. The model also supports scenario testing, allowing users to compare conservative, base, and growth cases before committing to hiring plans, advertising budgets, pricing changes, or expansion strategies. This makes it a practical tool for anyone preparing a business plan, loan application, pitch deck, internal budget, or strategic roadmap. Because the template is editable and compatible with Excel and Google Sheets, users can adapt it to different agency sizes, markets, currencies, and service mixes. Whether you are starting a boutique SEO consultancy, expanding a digital marketing firm, or advising a client on agency profitability, this financial model template provides a ready-to-use framework for organizing assumptions, reviewing financial statements, communicating projections, and making better decisions with a more complete view of the business.
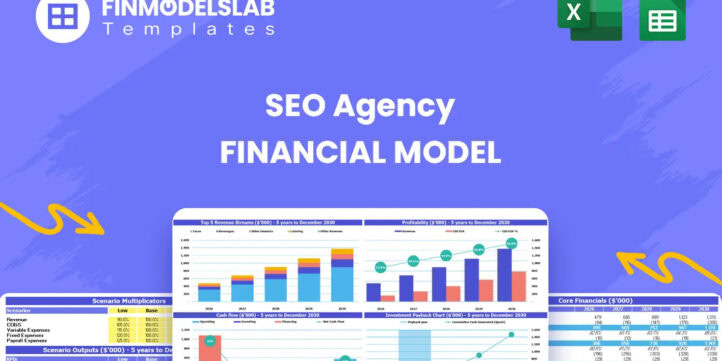


Financial Model Overview
The SEO Agency Financial Model Financial Model Template is a ready-to-use planning tool built for entrepreneurs, agency founders, consultants, analysts, and business owners who need to forecast the financial performance of an SEO services business. It helps translate agency assumptions into a connected five-year forecast covering revenue, expenses, startup investment, cash flow, profitability, break-even timing, investor metrics, and financial statements. For an SEO agency, accurate planning requires more than a simple sales estimate. The model must connect monthly retainers, customer acquisition costs, marketing spend, staffing capacity, software tools, contractor costs, and operating overhead into one structured view. This template gives users an editable framework for entering those assumptions, reviewing the results, and preparing a professional financial plan for launch, funding, internal budgeting, or expansion. Instead of spending time building formulas and layouts from the ground up, users can focus on testing pricing, client growth, service mix, cash requirements, and profitability targets. The result is a practical financial planning tool that supports both strategic decisions and stakeholder presentations.
All-in-One Dashboard
The all-in-one dashboard gives users a central view of the SEO agency’s core assumptions and core outputs in one place. This section is designed to make the model easier to use by summarizing the most important inputs, such as revenue drivers, customer acquisition assumptions, pricing, cost structure, startup investment, and selected operating metrics, while also showing key outputs like revenue, EBITDA, cash balance, profitability, payback, and return indicators. For an SEO agency, this is useful because decision-makers need to see how client growth, average monthly retainers, marketing spend, and operating costs combine to shape financial performance. The dashboard helps users quickly review whether the plan is moving toward sustainable profitability, whether the agency has enough cash to support early growth, and whether the business case is strong enough for a lender, investor, or internal approval process. It also provides a practical starting point for non-financial users because it reduces the need to search through multiple tabs to understand the model. By consolidating key metrics into a clear summary, the dashboard supports faster analysis, easier updates, and more confident decision-making.
Low, Base, and High Scenario Analysis
The Low, Base, and High scenario analysis section allows users to compare different versions of the SEO agency forecast under conservative, expected, and optimistic assumptions. This component is especially valuable because agency performance can vary significantly based on client acquisition speed, churn, pricing, conversion rates, marketing efficiency, staff utilization, and service delivery costs. Users can test how changes in these assumptions affect revenue, margin, cash flow, and profitability over the forecast period. A low case may help identify the minimum client base or funding cushion needed to survive slower growth, while a base case can represent the most realistic operating plan, and a high case can show the financial upside if sales and retention outperform expectations. For business planning, this section helps users avoid relying on a single fixed forecast and instead prepares them for multiple possible outcomes. For funding discussions, it shows investors and lenders that management has considered risk, downside protection, and growth potential. It also supports better strategic planning by helping users identify the variables that matter most, such as customer acquisition cost, average retainer size, payroll timing, or marketing budget efficiency.
Professional Charts
The professional charts section transforms the financial forecast into clear visual outputs that are easier to understand, present, and discuss. These charts may display revenue growth, cash balance, EBITDA, profit margins, break-even progress, expense categories, customer trends, or other key financial indicators across the forecast period. For an SEO agency, charts are particularly useful because the business model often involves a delayed path to profitability, with early investment in marketing, hiring, systems, and client acquisition before recurring revenue fully scales. Visual reports help show this journey more clearly than spreadsheet rows alone. Users can include these charts in business plans, investor presentations, internal reviews, loan applications, or strategic planning sessions to communicate the agency’s expected financial trajectory. They also make it easier to spot trends, such as rising revenue, improving margins, cash pressure points, or the impact of hiring decisions on profitability. By providing presentation-ready visuals, the template helps users convert detailed financial projections into a concise story that stakeholders can evaluate quickly. This improves the quality of discussions and makes the financial model more practical for both analysis and communication.
ROE Components and DuPont Analysis
The ROE components and DuPont analysis section helps users understand what is driving the agency’s return on equity and overall financial efficiency. Rather than looking only at a final return figure, this component breaks performance into underlying drivers such as profitability, asset efficiency, and financial leverage. For an SEO agency, this is useful because growth can be funded through owner investment, retained earnings, debt, or outside capital, and each choice can influence returns differently. The section can help users evaluate how net income, revenue efficiency, operating margins, capital structure, and equity investment affect the return generated by the business. Inputs may include projected income statement results, balance sheet values, equity funding, debt balances, and retained earnings. Outputs help users see whether returns are improving because the agency is earning higher margins, using its asset base more efficiently, or relying on a particular financing structure. This is helpful for founders who want to understand the quality of growth, not just the amount of revenue generated. It can also be useful for investors or lenders who want a more detailed view of financial performance. By including DuPont-style logic, the model gives users a more analytical way to evaluate long-term value creation and financial sustainability.
Revenue Inputs
The revenue inputs section is where users define the commercial assumptions that drive the SEO agency forecast. This component may include the number of new clients acquired, customer acquisition cost, marketing spend, client retention, churn, service package pricing, monthly retainers, upsell assumptions, and the mix of services offered. Typical SEO agency revenue streams can include core SEO retainers, content and link-building services, local SEO packages, advanced analytics, reporting, technical audits, or other recurring and project-based services. By entering these assumptions, users can build a revenue forecast that reflects how the agency actually earns money. This section is important because small changes in monthly retainer size, acquisition efficiency, or client retention can significantly affect revenue and profitability over five years. The model connects these inputs to projected sales, active customer counts, recurring monthly revenue, and annual revenue growth. It also helps users evaluate whether marketing spend is generating enough client volume to justify the cost. For founders and agency owners, the revenue inputs section supports pricing strategy, sales planning, service mix decisions, and growth targets. For consultants and analysts, it creates a clear framework for documenting assumptions and explaining how the revenue forecast was built.
Bank-Ready Reports
The bank-ready reports section provides lender-friendly financial outputs that help users present the SEO agency forecast in a professional and structured format. This component is designed to summarize the financial statements and metrics that banks, lenders, investors, and other stakeholders commonly request when reviewing a business plan or funding application. It may include projected profit and loss statements, cash flow statements, balance sheets, debt assumptions, funding requirements, repayment capacity, profitability measures, and key ratios. For an SEO agency, these outputs are valuable because early-stage service businesses often need to explain how upfront marketing, hiring, software, and setup costs will convert into recurring client revenue and positive cash flow. The reports help show whether the agency can cover operating expenses, maintain liquidity, service debt, and reach profitability within a reasonable period. They also make the model easier to share with stakeholders who need a clean summary rather than a detailed assumptions workbook. By providing professionally formatted financial outputs, this section supports loan applications, investor conversations, partner reviews, and internal approvals. It helps users move from raw assumptions to credible financial documentation that can be used in real business planning and funding discussions.
Revenue Breakdown
The revenue breakdown section gives users a detailed view of how total agency revenue is generated across different service streams. Instead of showing only one revenue number, this component separates income by categories such as core SEO packages, content and link-building, local SEO, analytics and reporting, technical consulting, or other service lines that the user chooses to model. This is important for an SEO agency because each revenue stream may have a different price point, margin profile, delivery requirement, staffing need, and growth pattern. A detailed breakdown helps users understand which services are driving sales, which packages may be most profitable, and how changes in service mix affect total revenue. Inputs may include monthly pricing, client counts, package adoption rates, upsell rates, churn, and launch timing for each service. Outputs can show monthly and annual revenue by stream, percentage contribution to total sales, and growth trends over the forecast period. This section supports better decision-making around pricing, productization, sales focus, and operational planning. It can also help users explain the business model more clearly to investors, lenders, or internal teams by showing exactly where revenue is expected to come from and how recurring income may scale over time.
KPI Dashboard
The KPI dashboard section tracks the performance metrics that matter most for an SEO agency and compares them against planning targets or benchmark expectations. This component may include customer acquisition cost, client growth, monthly recurring revenue, average revenue per client, churn, gross margin, EBITDA margin, cash balance, LTV to CAC, payback period, utilization, and other key indicators. For an SEO agency, these metrics are essential because revenue growth alone does not prove the business is healthy. The agency must acquire clients efficiently, retain them long enough to recover acquisition costs, deliver services profitably, and manage payroll and overhead as the client base grows. The KPI dashboard helps users monitor these dynamics in a structured way. Inputs are drawn from the revenue forecast, expense assumptions, staffing plan, and financial statements, while outputs summarize performance in a format that is easy to review. This section is useful for monthly management reporting, investor updates, operational planning, and strategic reviews. It helps users identify whether marketing efficiency is improving, whether margins are expanding, and whether the agency is moving toward sustainable profitability. By providing a focused view of key metrics, the KPI dashboard turns the financial model into an ongoing performance management tool rather than a one-time forecast.
Startup Cost and Funding Requirements
The startup cost and funding requirements section helps users estimate the initial investment needed to launch or expand an SEO agency before recurring revenue becomes stable. This component may include office setup, computer hardware, software subscriptions, website development, branding, legal fees, accounting setup, initial marketing, recruiting costs, deposits, working capital reserves, and other pre-opening or early-stage expenses. For an SEO agency, startup costs may be lower than a physical retail business, but careful planning is still important because cash can be absorbed quickly by payroll, sales efforts, technology tools, and client acquisition before the agency reaches break-even. This section allows users to separate one-time capital expenditures from recurring operating costs, making it easier to understand how much funding is required at launch and how long that funding may need to support operations. Outputs may include total startup investment, funding gap, owner contribution, external financing needs, and the timing of capital requirements. This is useful for founders preparing a business plan, consultants advising clients, or owners seeking a loan or investor contribution. By clearly documenting startup costs and funding needs, the model helps reduce the risk of undercapitalization and supports more realistic planning from the beginning.
Cash Flow and Break-Even Forecast
The cash flow and break-even forecast section helps users understand when the SEO agency may become financially self-sustaining and whether it has enough liquidity to reach that point. This component uses revenue projections, operating expenses, payroll, startup costs, capital expenditures, financing assumptions, and working capital timing to estimate monthly and annual cash movement. It can show opening cash balance, cash inflows, cash outflows, ending cash balance, burn rate, and the month when cumulative profits or cash flow turn positive. For an SEO agency, this is critical because the business may invest heavily in client acquisition, hiring, tools, and systems before the full benefit of recurring retainers appears. Even if the long-term forecast is profitable, the agency can still face cash pressure in the early months. The break-even forecast helps users identify the sales volume, client count, margin level, or cost discipline required to cover expenses. It also supports decisions such as whether to raise more capital, delay hiring, adjust pricing, reduce overhead, or require upfront client payments. For funding discussions, this section helps demonstrate how much runway the agency needs and when stakeholders can expect the business to move toward profitability. It is one of the most practical parts of the model for day-to-day planning and risk management.
File types:
Excel – Single-User: .xlsx
Excel – Multi-User: .xlsx
Similar ProductsOther customers were also interested in...

 HenrySheykin
Spa Financial Model Excel Template
The Spa Financial Model helps entrepreneurs, spa owners, consultants, analysts, and business planner... Read more
Physiotherapy Financial Model Excel Template
The Physiotherapy Clinic Financial Model helps founders, clinic owners, consultants, analysts, and b... Read more
Skin Care Financial Model Excel Template
The Skin Care Clinic Financial Model helps entrepreneurs, clinic owners, consultants, analysts, and ... Read more

Gift Shop Financial Model Excel Template
The Gift Shop Financial Model helps users build a structured financial forecast for a retail gift st... Read more

Dog Grooming Financial Model Excel Template
The Dog Grooming Financial Model helps entrepreneurs, salon owners, consultants, analysts, and busin... Read more

Tattoo Shop Financial Model Excel Template
The Tattoo Studio Financial Model helps entrepreneurs, studio owners, consultants, analysts, and bus... Read more
Cafe Financial Model Excel Template
The Cafe Financial Model is a ready-to-use financial model template designed to help entrepreneurs, ... Read more
Outpatient Clinic Financial Model Excel Template
The Outpatient Clinic Financial Model helps users turn a clinic business concept into a structured, ... Read more
Catering Financial Model Excel Template
The Catering Service Financial Model helps users turn a catering business plan into a structured, ed... Read more
Web Design Agency Financial Model Excel Template
The Web Design Agency Financial Model helps entrepreneurs, founders, consultants, analysts, and agen... Read more
You must log in to submit a review.