
0 ITEMS

Soy Production Financial Model Excel Template
The Soy Production Financial Model helps users turn a soybean farming and processing plan into a structured financial forecast. It is built for entrepreneurs, agricultural business owners, consultants, analysts, founders, and planning teams that need to understand the numbers behind land use, crop yield, pricing, production costs, staffing, capital investment, cash flow, and profitability. Instead of relying on disconnected calculations, the template brings the key financial planning assumptions into one editable model so users can evaluate whether a soy production project is commercially viable before launch, expansion, or funding discussions. This financial model template is especially useful for business plans, lender presentations, investor reviews, internal budgeting, and operational decision-making. Users can map revenue assumptions around cultivated area, harvest frequency, yield per hectare, product category mix, expected selling prices, and yield losses. The model also helps organize startup costs, equipment investment, storage and facility requirements, operating expenses, payroll, logistics, quality control, and other cost drivers that affect margins and cash needs. By connecting the operational assumptions to financial outputs, the template makes it easier to see how changes in land allocation, pricing, input costs, staffing, or harvest timing influence the overall business case. The Soy Production Financial Model is designed to support both startup planning and long-term growth analysis. It can be used to estimate initial funding requirements, review monthly and annual cash flow, test profitability under different assumptions, and understand when the business may reach break-even. The model gives users a practical way to evaluate cost of goods sold, overhead, payroll, capital expenditures, EBITDA, net profit, returns, and liquidity requirements over time. This is particularly important in agriculture, where significant upfront investment may be required before the first major revenue cycle is realized. Built with editable inputs, pre-built formulas, presentation-ready outputs, and compatibility with Excel and Google Sheets, the template saves time compared with building a forecast from scratch. It helps users prepare more professional financial documents, communicate assumptions clearly, and make better decisions about land acquisition, leasing, equipment purchases, hiring, production scale, and funding strategy. Whether you are preparing a soybean business plan, reviewing a farm expansion, modeling a crop production investment, or supporting a client project, this template provides a clear framework for financial planning, profitability analysis, and decision-making.
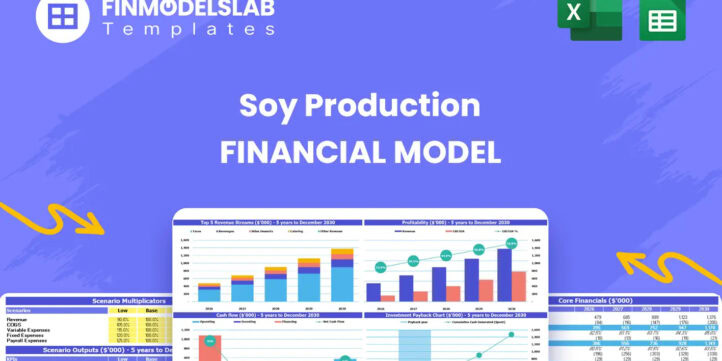


Financial Model Overview
The Soy Production Financial Model is a ready-to-use financial model template designed to help entrepreneurs, agricultural operators, consultants, analysts, and planning teams evaluate the financial viability of a soy production business. Soy farming can involve large upfront investment, seasonal revenue timing, changing yield assumptions, multiple crop categories, direct production costs, labor needs, storage requirements, equipment purchases, and financing decisions. This template brings those moving parts into one structured model so users can plan with more clarity before committing capital, approaching lenders, presenting to investors, or scaling operations. It is built to support practical decision-making by connecting assumptions such as cultivated hectares, yield per hectare, harvest frequency, selling price, yield loss, input costs, payroll, capital expenditures, and funding needs to projected revenue, expenses, cash flow, profitability, and returns. With editable fields, automated calculations, and professional reporting outputs, the model helps users replace scattered spreadsheet work with a more organized financial planning process tailored to soy production.
All-in-One Dashboard
The all-in-one dashboard gives users a central view of the most important inputs and outputs in the Soy Production Financial Model. It is designed to make the model easier to use by bringing core planning assumptions and headline financial results into one place. Users can review major drivers such as land area, land allocation, yield assumptions, pricing, revenue growth, direct costs, operating expenses, payroll, capital spending, cash balance, profitability, and return metrics without searching through every worksheet. The dashboard may show summary figures for revenue, gross margin, EBITDA, net profit, cash flow, funding needs, payback period, and other high-level indicators that matter to founders, farm owners, lenders, and investors. This section is useful because soy production decisions often depend on how operational choices translate into financial outcomes. A change in cultivated hectares, harvest timing, selling price, or cost structure can alter the entire business case, and the dashboard helps users see those effects quickly. For presentations, internal reviews, and funding conversations, it provides a concise executive summary that makes the forecast more accessible to both financial and non-financial stakeholders.
Low, Base, and High Scenario Analysis
The low, base, and high scenario analysis section helps users test how the soy production business may perform under different operating and market conditions. A soy production plan is sensitive to assumptions such as yield per hectare, commodity pricing, harvest frequency, input costs, labor costs, land expansion, financing terms, and logistics expenses. This component allows users to compare conservative, expected, and optimistic cases so they can understand the range of potential outcomes before making strategic commitments. In a low case, the model may reflect weaker yields, lower selling prices, higher operating costs, delayed expansion, or increased yield loss. In a base case, it may represent the most realistic plan based on current assumptions. In a high case, it may test stronger production efficiency, better pricing, improved margins, or faster scale-up. The outputs can help users compare revenue, EBITDA, cash flow, funding gaps, break-even timing, payback period, and investor returns across scenarios. This is valuable for decision-making because it shows whether the business remains viable if conditions are less favorable, and whether expansion or investment becomes more attractive under stronger conditions. It also strengthens lender and investor discussions by showing that management has considered risk rather than relying on a single forecast.
Professional Charts and Visual Reports
The professional charts and visual reports section converts the forecast into presentation-ready visuals that make the financial story easier to communicate. Soy production models can include many detailed assumptions, such as land usage, crop category mix, harvest volumes, revenue streams, direct costs, payroll, capital expenditures, cash movements, and profitability metrics. Charts help turn those details into a clearer narrative by displaying trends over time, comparing revenue and expense categories, highlighting cash requirements, and showing how margins evolve as the operation scales. This component may include visual summaries of revenue growth, EBITDA performance, net profit, cash balance, cost structure, land expansion, revenue mix, and return metrics. For founders and operators, these visuals help identify trends and pressure points more quickly than rows of numbers alone. For consultants and analysts, they make it easier to present findings to clients. For lenders and investors, they support more professional communication by showing the financial plan in a format that is easier to review during meetings, pitch discussions, credit evaluations, or business plan submissions. The visual reporting component also helps users spot inconsistencies, validate assumptions, and explain how operational scale translates into financial performance.
ROE Components and DuPont Analysis
The ROE components and DuPont analysis section helps users understand what is driving shareholder returns in the soy production business. Return on equity can be influenced by profitability, asset efficiency, and leverage, and this component breaks those drivers into a more transparent structure. Instead of looking only at a single return percentage, users can review how net profit margin, asset turnover, and financial leverage contribute to overall ROE. In a soy production context, this is particularly useful because the business may require significant investment in land, machinery, storage, irrigation, and working capital. A project may generate strong operating cash flow but still produce modest returns if asset intensity is high, or it may improve equity returns if debt is used responsibly and margins are stable. The model can help users analyze whether returns are being driven by real operating performance or by leverage, which is important for investors, lenders, and owners evaluating risk. Inputs may include revenue, net income, total assets, equity, debt, and balance sheet assumptions, while outputs may include return on equity, margin analysis, asset utilization, and leverage effects. This section supports better capital structure decisions and helps stakeholders understand whether the soy production plan creates attractive long-term value.
Revenue Inputs and Assumption Setup
The revenue inputs and assumption setup section is where users define the commercial foundation of the soy production forecast. This component allows users to enter the key assumptions that determine top-line performance, including cultivated land area, land expansion schedule, allocation across soybean categories, yield per hectare, harvests per year, expected yield loss, selling prices per kilogram, and revenue timing. A soy production business may serve multiple markets, such as animal feed, food-grade soybeans, non-GMO crops, specialty varieties, or processing-related categories, and each stream may have different pricing, yield, and demand assumptions. By structuring these inputs clearly, the model helps users build a more realistic revenue forecast rather than relying on a simple average sales estimate. The section may also allow assumptions to change over time, which is important for long-term planning as land under cultivation expands, operational efficiency improves, or market pricing changes. Outputs from this section feed into monthly and annual revenue projections, production volume estimates, revenue mix analysis, and profitability calculations. It is useful for business planning because it forces users to document exactly how the farm expects to generate income and gives lenders, investors, and management a transparent view of the assumptions behind the forecast.
Bank-Ready Financial Reports
The bank-ready financial reports section provides structured financial outputs that are suitable for lender reviews, investor discussions, business planning, and internal management. A soy production venture may need external financing for land acquisition, leases, tractors, harvesters, storage facilities, working capital, payroll, planting inputs, and early operating losses before revenue stabilizes. This component helps users present the financial plan in a format that stakeholders can evaluate more easily. It may include projected income statements, cash flow statements, balance sheets, sources and uses of funds, debt schedules, profitability summaries, and key return metrics. The reports translate the model’s assumptions into financial statements that show revenue, cost of goods sold, gross profit, operating expenses, EBITDA, depreciation, interest, taxes, net income, cash movements, assets, liabilities, and equity over the forecast period. This is useful because banks and investors usually want more than a revenue estimate. They need to see whether the business can service debt, maintain liquidity, absorb seasonal cash pressure, and generate sustainable profits. By providing organized reports with professional formatting, the template helps users prepare more credible funding documents and reduces the time required to build lender-friendly outputs from scratch.
Revenue Breakdown by Soy Category
The revenue breakdown by soy category section gives users a detailed view of how each product or crop category contributes to total sales. Soy production revenue is not always uniform because different categories may carry different yields, prices, loss rates, demand profiles, quality requirements, and margins. This component separates revenue streams so users can evaluate the contribution of each category, such as animal feed soybeans, food-grade soybeans, non-GMO soybeans, specialty varieties, or other product groups relevant to the operation. Inputs may include the percentage of land allocated to each category, hectares cultivated, yield per hectare, number of harvests, yield loss, and selling price per kilogram. The outputs may include gross production volume, net production volume, revenue by category, percentage of total revenue, and category-level performance trends. This is useful for planning because it helps management understand which categories drive the business model and whether the land allocation strategy supports profitability. If one category generates stronger pricing but has lower yield or higher testing costs, the model can help users evaluate trade-offs. It also supports sales strategy, capacity planning, and investor communication by showing the revenue mix in a detailed and transparent way.
KPI Dashboard and Benchmark Metrics
The KPI dashboard and benchmark metrics section helps users monitor the performance of the soy production business through practical financial and operational indicators. While full financial statements are important, management also needs clear metrics that show whether the business is moving in the right direction. This component may track KPIs such as revenue per hectare, yield per hectare, gross margin, EBITDA margin, net profit margin, operating expense ratio, payroll as a percentage of revenue, cash runway, break-even timing, debt service coverage, return on equity, internal rate of return, and payback period. It may also include benchmark comparisons where relevant, allowing users to compare modeled performance against target margins, industry expectations, or internal planning thresholds. These metrics are useful for decision-making because they highlight whether revenue growth is being achieved efficiently, whether costs are under control, whether liquidity is sufficient, and whether the investment case is improving over time. For consultants and analysts, the KPI dashboard provides a clear way to summarize model outputs for clients. For owners and founders, it supports ongoing performance reviews. For lenders and investors, it provides a compact view of operational health and financial discipline.
Startup Costs and Capital Expenditure Schedule
The startup costs and capital expenditure schedule section helps users estimate the upfront investment required to launch or expand a soy production operation. Soy farming can require significant capital before the first harvest generates revenue, including land purchases or lease deposits, tractors, harvesters, irrigation systems, storage facilities, processing or handling equipment, vehicles, technology, permits, setup costs, and initial working capital. This component allows users to organize those expenses by category, timing, and amount so the model can calculate cash requirements accurately. It may include monthly timing for major purchases, useful life assumptions, depreciation, replacement needs, and links to financing requirements. Outputs can include total startup investment, capital expenditure by period, depreciation expense, fixed asset balances, cash burn before revenue, and sources and uses of funds. This section is important because underestimating startup costs is one of the biggest risks in agricultural planning. A business may appear profitable on an operating basis but still fail if it cannot fund equipment purchases, land commitments, and early working capital needs. By mapping CapEx clearly, the model helps users plan fundraising, loan requests, timing of purchases, and cash reserves with more confidence.
Break-Even Analysis and Cash Flow Planning
The break-even analysis and cash flow planning section helps users understand when the soy production business may become profitable and how much cash is needed to reach that point. In agriculture, revenue may be seasonal while expenses such as payroll, lease payments, insurance, software, fuel, maintenance, logistics, quality testing, and debt service occur throughout the year. This component connects revenue timing, gross margin, fixed costs, variable costs, capital spending, working capital, and financing assumptions to show whether the operation can maintain liquidity during planting, growing, harvesting, and selling cycles. Inputs may include selling prices, production volumes, COGS percentages, operating expenses, payroll, CapEx timing, loan proceeds, repayments, and opening cash balance. Outputs may include monthly cash flow, minimum cash balance, funding gap, cash runway, break-even month, break-even revenue, break-even volume, and profitability milestones. This section is useful for founders, operators, lenders, and investors because it shows the cash reality behind the business plan.
File types:
Excel – Single-User: .xlsx
Excel – Multi-User: .xlsx
Similar ProductsOther customers were also interested in...


 HenrySheykin
Cashew Nut Processing Business Plan Financial Mode...
The Cashew Nut Processing Financial Model helps entrepreneurs, operators, consultants, analysts, and... Read more
 Pushkar
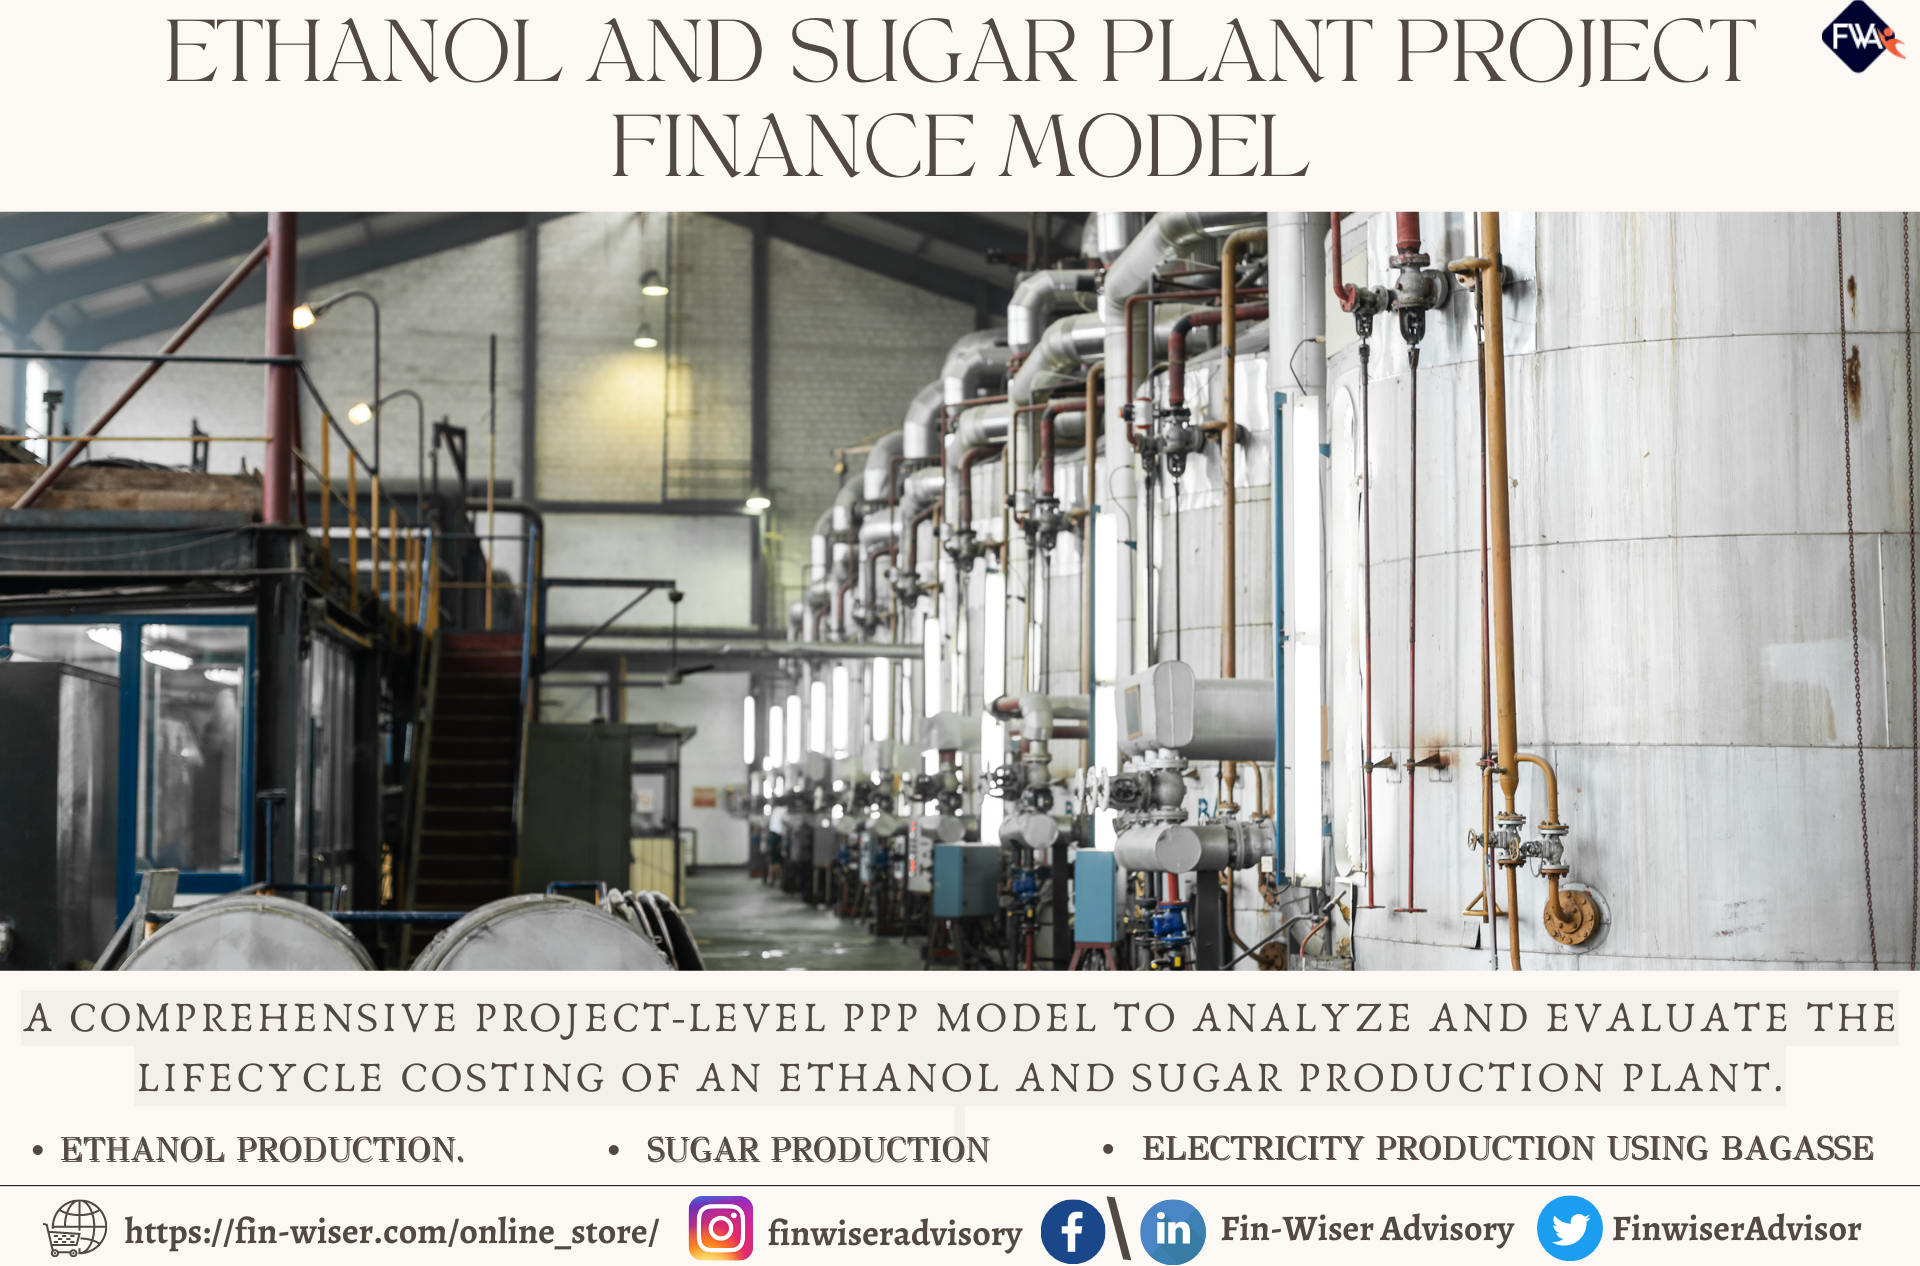
Ethanol and Sugar Production Plant Financial Model
Fin-wiser’s Ethanol and Sugar Plant PPP project model helps users to assess the financial viabilit... Read more
 Giorgos
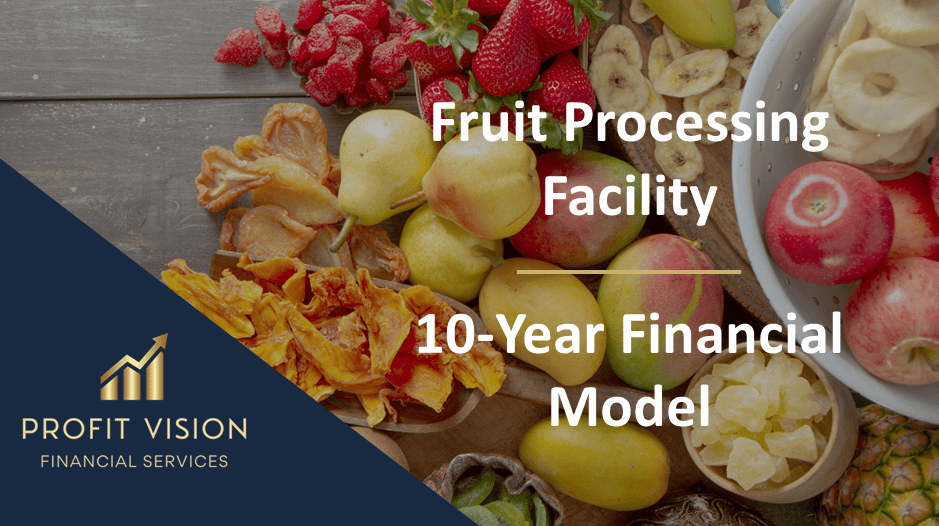
Fruit Processing Facility – 10 Year Financia...
Financial Model providing a dynamic up to 10-year financial forecast for a startup Fruit Processing ... Read more
 Luigi R.
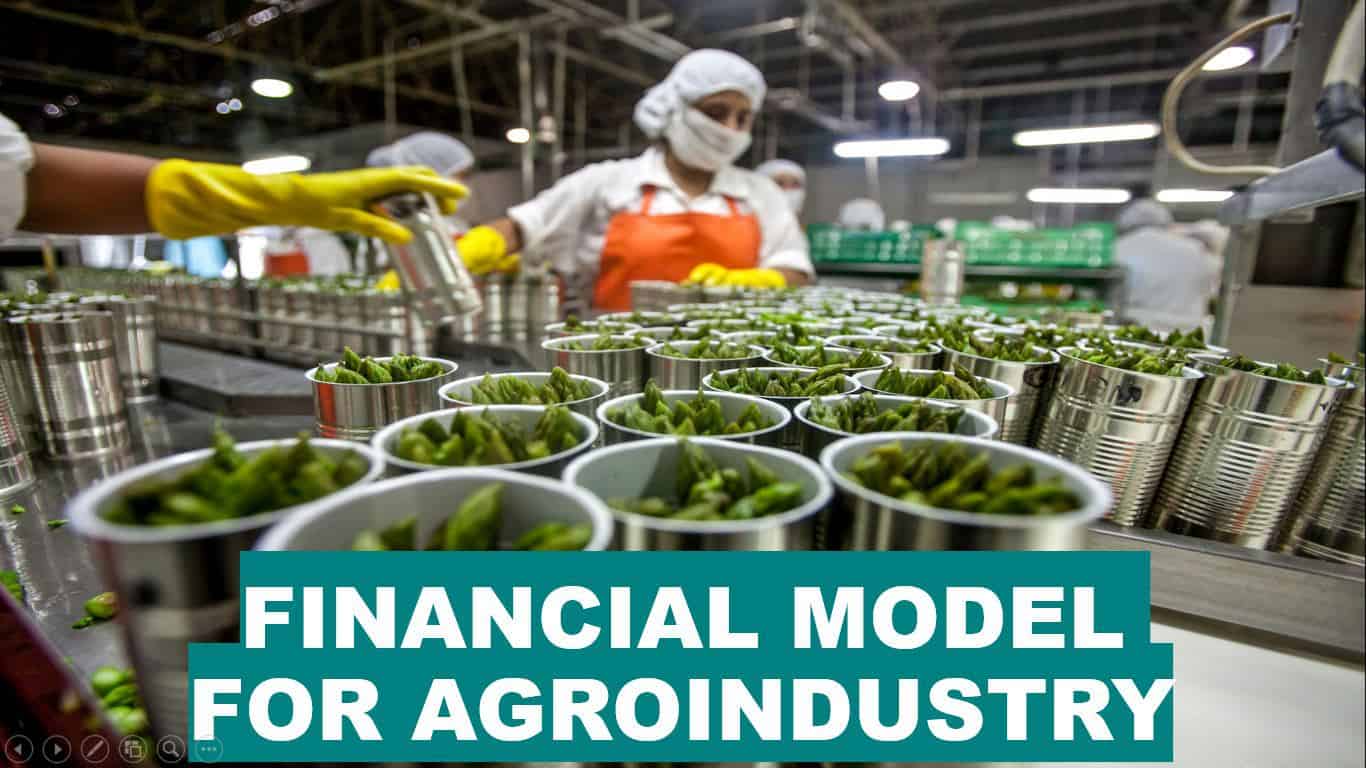
Financial Model for AGROINDUSTRY
The financial model I have built contains all the advanced corporate finance concepts referring to a... Read more
Solar Panel Manufacturing Plant Business Plan Fina...
The Solar Panel Manufacturing Financial Model helps users turn a solar factory concept into a struct... Read more
Cannabis Financial Model Excel Template
The Cannabis Business Financial Model is a ready-to-use financial model template designed to help en... Read more
Fruits Farming Financial Model Excel Template
The Fruit Farming Financial Model helps users turn a fruit farm concept, orchard expansion, or agric... Read more
Poultry Farm Financial Model Excel Template
The Poultry Farming Financial Model helps users turn a poultry farm concept into a structured, lende... Read more
Fish Farm Financial Model Excel Template
The Fish Farming Financial Model template helps entrepreneurs, aquaculture founders, business owners... Read more
Shrimp Farm Financial Model Excel Template
The Shrimp Farming Financial Model helps entrepreneurs, aquaculture operators, consultants, analysts... Read more
You must log in to submit a review.