
0 ITEMS

Direct Marketing Agency Financial Model Excel Template
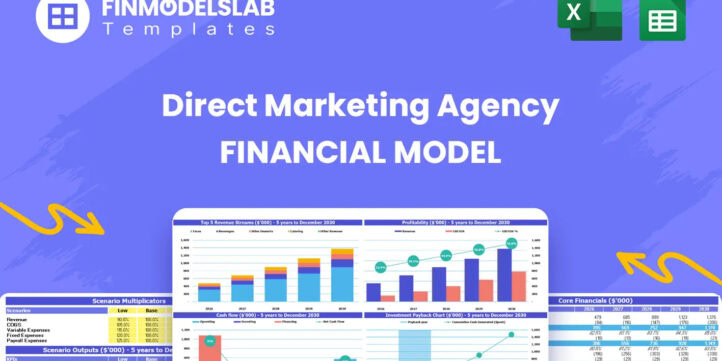
The Direct Marketing Agency Financial Model helps turn an agency concept into a structured financial forecast that can be used for planning, budgeting, funding preparation, and internal decision-making. Instead of building a model from scratch, users can enter their own assumptions and review how the agency may perform over time across revenue, expenses, cash flow, profitability, and investment requirements. The template is designed around the economics of a direct marketing agency, including services such as mail campaigns, email marketing, telemarketing, campaign execution, data acquisition, client acquisition, billable hours, and service-based pricing. This financial model template is useful for entrepreneurs launching a new agency, founders preparing an investor pitch, business owners planning expansion, consultants building client deliverables, and analysts reviewing the feasibility of a direct response or direct marketing business. It helps users organize revenue assumptions, estimate startup costs, map operating expenses, plan payroll, and understand how changes in customer volume, pricing, service mix, and cost structure affect the financial outcome. The model supports both early-stage planning and more advanced financial review by connecting assumptions to projected financial statements and key performance indicators. The template provides a practical framework for reviewing whether the business can reach sustainable profitability. Users can forecast monthly and annual performance, evaluate cash flow needs, estimate margins, analyze break-even timing, and understand how much funding may be required before the business can operate comfortably. It also helps identify the impact of variable costs, staffing plans, marketing spend, customer acquisition costs, and working capital requirements, which are especially important for agencies that depend on recurring clients and campaign-based billing. Built to be editable and presentation-ready, the Direct Marketing Agency Financial Model gives users a clearer view of the numbers behind the business plan. It can support loan applications, investor discussions, internal strategy sessions, and stakeholder presentations by providing organized outputs instead of disconnected estimates. Whether the goal is to test a new agency idea, compare growth scenarios, prepare a direct marketing agency pro forma, or make better operating decisions, this template provides a ready-to-use financial planning tool for reviewing risk, opportunity, cash flow, break-even analysis, and long-term profitability.


“
Financial Model Overview
The Direct Marketing Agency Financial Model is a ready-to-use financial planning template built for entrepreneurs, agency founders, consultants, analysts, and business owners who need to evaluate the economics of a direct marketing agency. It brings together the key assumptions required to forecast revenue, startup investment, operating expenses, payroll, cash flow, profitability, and financial performance over a multi-year period. For a direct marketing agency, financial planning depends on understanding billable hours, client volume, hourly rates, campaign types, customer acquisition costs, staffing requirements, data costs, and campaign execution expenses. This template gives users a structured way to connect those business drivers to financial statements and decision-ready outputs. It can be used when preparing a business plan, assessing funding needs, presenting to investors or lenders, or managing an existing agency with more discipline. Because the fields are editable, users can replace the built-in assumptions with their own service mix, pricing, staffing plan, marketing budget, and growth expectations, then review how the business performs under different operating conditions.
All-in-One Dashboard
The all-in-one dashboard gives users a central view of the Direct Marketing Agency Financial Model by combining core inputs and core outputs in one practical workspace. This component is useful because agency owners and planners need to see how their most important assumptions translate into projected results without searching through every worksheet. Inputs may include the number of active customers, billable hours per service, hourly rates, revenue growth assumptions, cost percentages, payroll plans, startup costs, and financing assumptions. Outputs may include total revenue, gross profit, EBITDA, net profit, cash balance, break-even timing, return metrics, and selected balance sheet indicators. For a direct marketing agency, the dashboard helps connect operational decisions to financial outcomes, such as how increasing email marketing clients or changing the hourly rate for mail campaign work affects total revenue and margin. It is especially valuable for quick reviews before meetings, funding discussions, or strategic planning sessions because it summarizes the model in a format that is easier to interpret than raw spreadsheet tabs. Instead of working with disconnected figures, users can monitor the main assumptions and projected results from a single control center.
Low, Base, and High Scenario Analysis
The low, base, and high scenario analysis component allows users to test how the agency may perform under different market and operating conditions. This is important for a direct marketing agency because performance can vary based on client acquisition speed, client retention, average billable hours, pricing power, campaign volume, staffing efficiency, and customer acquisition costs. In the low case, users can model slower growth, higher costs, lower utilization, or more conservative pricing. In the base case, they can build a realistic operating plan based on expected customer demand and manageable expense levels. In the high case, they can test the upside of stronger sales performance, higher-value clients, improved margins, or faster expansion. The outputs help show how revenue, profitability, cash flow, and funding needs may change across these scenarios. This component is useful for risk management and investor communication because it avoids relying on a single forecast. It helps founders prepare contingency plans, understand downside exposure, set realistic targets, and show stakeholders that the agency plan has been reviewed from multiple angles. Scenario analysis also supports better decision-making by making it easier to compare the financial impact of different strategic choices before committing resources.
Professional Charts
The professional charts component turns the financial forecast into visual outputs that are easier to understand, present, and discuss. Direct marketing agency financial models can include many moving parts, including service-specific revenue, monthly cash flow, payroll growth, operating costs, EBITDA, margin trends, and balance sheet movements. Charts help translate those details into clear visuals that can be used in pitch decks, internal reports, lender conversations, or management reviews. Inputs flow from the model’s assumptions and financial statements, while outputs may include graphs for revenue growth, profit trends, cash balance, expense composition, margin development, and other key financial indicators. This component is useful because investors, lenders, and business partners often need to understand the business quickly, and visual summaries can make the financial story more accessible. For example, a chart showing the rise in agency revenue across mail campaigns, email marketing, and telemarketing can communicate growth more clearly than a table alone. A cash flow chart can also highlight months where liquidity needs attention. By presenting the forecast visually, the model helps users make a more professional impression and communicate the financial plan with greater confidence.
ROE Components and DuPont Analysis
The ROE components and DuPont analysis section helps users understand what drives return on equity by breaking performance into key financial drivers. Rather than looking only at a single return percentage, this component helps explain whether returns are being driven by profit margin, asset efficiency, or financial leverage. For a direct marketing agency, this can be useful because the business may not require heavy physical assets, but it may depend heavily on labor productivity, pricing discipline, client acquisition efficiency, and expense management. Inputs may include net income, revenue, total assets, equity, debt assumptions, and balance sheet projections. Outputs may include return on equity, profit margin, asset turnover, equity multiplier, and related performance indicators. This analysis can help users identify whether the agency is generating returns because it has strong margins, efficient operations, or a capital structure that increases equity returns. It is valuable for investors and stakeholders because it gives more context than a simple profit figure. It can also support management decisions by highlighting which area of the business deserves attention. If margins are weak, the agency may need better pricing or lower direct costs. If asset efficiency is low, the business may need to use resources more effectively. If leverage is too high, financing risk may need to be reviewed.
Revenue Inputs
The revenue inputs component is where users define the commercial assumptions that drive the agency’s top-line forecast. For a direct marketing agency, revenue is often linked to the number of active clients, service categories, average billable hours, hourly rates, retainers, campaign frequency, and growth in demand over time. This section may include inputs for mail campaigns, email marketing, telemarketing, and other direct response services the agency provides. Users can adjust the number of customers, expected service usage, monthly billable hours, pricing, and growth rates to reflect their own business plan. The model then uses these assumptions to calculate projected revenue by month and year. This component is essential because small changes in pricing, client count, or utilization can have a major impact on profitability. It helps users test questions such as how many clients are needed to support a full-time team, whether current pricing can cover campaign execution costs, or how revenue changes if the agency shifts toward higher-margin services. By documenting revenue assumptions clearly, the model also makes the forecast more credible for investors, lenders, and internal stakeholders. It replaces vague sales estimates with a driver-based revenue plan that can be reviewed, challenged, and improved.
Bank-Ready Reports
The bank-ready reports component provides organized financial outputs designed to support lender review, funding applications, and professional stakeholder discussions. Banks and financing partners typically need to see clear financial statements, cash flow projections, debt capacity, repayment ability, profitability trends, and supporting assumptions. This component helps package the Direct Marketing Agency Financial Model into reports that are easier for lenders to evaluate. Inputs come from the revenue forecast, cost assumptions, payroll plan, startup costs, financing assumptions, taxes, working capital, and capital expenditures. Outputs may include projected profit and loss statements, cash flow statements, balance sheets, debt schedules, profitability summaries, and other lender-friendly financial metrics. For a direct marketing agency, these reports are useful because they show whether the business can generate enough recurring revenue and cash flow to cover operating costs and potential loan payments. They also help demonstrate that the founder understands the cost structure of the agency, including staff, software, data acquisition, campaign execution, marketing, and administrative expenses. Well-organized reports can reduce confusion during financing conversations and make the business plan appear more prepared, credible, and professionally managed.
Revenue Breakdown
The revenue breakdown component provides a detailed view of how total agency revenue is built across different services and revenue streams. Instead of treating sales as one overall number, this section separates income by categories such as mail campaigns, email marketing, telemarketing, and any other direct marketing services the user chooses to include. Inputs may include the number of clients per service, average billable hours, hourly rates, campaign volume, recurring retainers, one-time project fees, and growth assumptions by service line. Outputs may include monthly and annual revenue by stream, percentage contribution by service, growth by category, and total agency revenue. This component is useful because service mix has a direct effect on profitability and staffing needs. Some services may require more labor, higher data costs, or more campaign execution expense, while others may offer stronger margins or more predictable recurring revenue. By reviewing the revenue breakdown, users can identify which services are expected to drive growth and which may need pricing adjustments. It also helps support strategic decisions, such as whether to focus on higher-margin email marketing services, expand telemarketing capacity, or develop larger mail campaign accounts. For business plans and funding documents, a detailed revenue breakdown makes the forecast more transparent and easier to defend.
KPI Dashboard
The KPI dashboard component helps users monitor the performance metrics that matter most for a direct marketing agency. While financial statements show the overall outcome, key performance indicators help explain why the business is performing the way it is. Inputs may include revenue, gross profit, EBITDA, customer acquisition cost, client count, billable hours, payroll, marketing spend, operating expenses, cash balance, and service-level assumptions. Outputs may include revenue growth, gross margin, EBITDA margin, net profit margin, average revenue per client, cash runway, customer acquisition cost trends, return metrics, and benchmark comparisons. This component is useful because agency performance depends on more than sales volume alone. A direct marketing agency may grow revenue quickly but still struggle if acquisition costs are too high, staff utilization is weak, campaign execution costs rise, or margins are compressed. The KPI dashboard gives users a faster way to identify these issues and track progress against targets. It can also support management meetings by showing whether the agency is moving toward profitability, maintaining liquidity, and improving operating efficiency. For investors or lenders, KPI reporting adds credibility because it shows that the agency is being measured with practical business indicators, not just broad financial projections.
Break-Even Analysis
The break-even analysis component helps users identify when the agency’s revenue is expected to cover its total costs. This is a critical planning tool for a direct marketing agency because the business may incur startup expenses, payroll, software subscriptions, data acquisition costs, campaign execution expenses, sales and marketing costs, and general overhead before revenue reaches a sustainable level. Inputs may include fixed operating expenses, variable costs as a percentage of revenue, gross margin, service pricing, billable hours, payroll costs, and monthly revenue assumptions. Outputs may include the break-even month, required revenue to break even, cumulative profit or loss before break-even, and the relationship between sales volume and profitability. This component is especially useful for founders and investors because it clarifies how long the business may need support before it becomes self-sustaining. It also helps users understand which levers can accelerate profitability, such as improving pricing, reducing customer acquisition cost, increasing recurring retainers, controlling staffing growth, or shifting toward higher-margin services. In practical decision-making, break-even analysis can guide launch budgets, funding requests, sales targets, and expense controls. It gives users a measurable milestone that can be tracked monthly as the agency grows.
Startup Cost and Funding Requirements
The startup cost and funding requirements component helps users estimate the initial capital needed to launch or expand the direct marketing agency. This section organizes one-time and early-stage investments so users can understand how much funding may be required before the business generates enough operating cash flow. Inputs may include office setup, computers and IT hardware, software tools, website and branding, licenses, legal and professional fees, initial marketing campaigns, recruitment costs, deposits, training, campaign systems, data resources, and working capital reserves. Outputs may include total startup costs, funding required, timing of cash needs, initial cash balance, and the amount of capital needed to avoid early liquidity pressure. This component is valuable because many agency plans underestimate the cash needed to reach the first stable revenue period. Even service businesses with limited physical assets can require meaningful upfront investment in tools, people, brand development, sales outreach, and operational readiness. By separating startup investment from ongoing operating expenses, the model helps users build a more accurate funding plan.
Similar ProductsOther customers were also interested in...


 HenrySheykin
Content Marketing Agency Financial Model Excel Tem...
The Marketing Agency Financial Model is a ready-to-use financial model template built to help agency... Read more
Traditional Advertising Agency Financial Model Exc...
The Advertising Agency Financial Model helps founders, agency owners, consultants, analysts, and bus... Read more
 City Finance
Marketing Campaign Financial Projection Model
Comprehensive editable, Excel spreadsheet for tracking marketing campaign financials in months or st... Read more
Digital Marketing Agency Financial Model Excel Tem...
The Digital Marketing Agency Financial Model helps agency founders, business owners, consultants, an... Read more
Email Marketing Agency Financial Model Excel Templ...
The Email Marketing Agency Financial Model helps founders, agency owners, consultants, analysts, and... Read more
Social Media Agency Financial Model Excel Template
The Social Media Agency Financial Model helps users turn an agency concept, launch plan, or growth s... Read more

Photography Studio Financial Model Excel Template
The Photography Studio Financial Model helps users turn a studio concept into a structured, editable... Read more

Bookkeeping Agency Finance Model Excel Template
A comprehensive editable, MS Excel spreadsheet for tracking Bookkeeping services finances, including... Read more

Social Media Marketing Agency Finance Model 5 Year...
Comprehensive editable, 5-year 3 statement MS Excel spreadsheets for tracking Social Media Service f... Read more

Digital Advertising Agency Finance Model Excel Tem...
A comprehensive editable 5 Year 3 Statement, MS Excel spreadsheet for tracking Digital Advertising A... Read more
You must log in to submit a review.